한수지 49(6), 849-855, 2016
849
Copyright © 2016 The Korean Society of Fisheries and Aquatic Science pISSN:0374-8111, eISSN:2287-8815 Korean J Fish Aquat Sci 49(6),849-855,2016
Original Article
서 론
황해는한반도와중국으로둘러싸여있고동중국해와지형적 인경계는없으나일반적으로제주도와양자강을연결하는선
을경계로구분되는평균수심약
44 m
의넓은대륙붕으로이루이진반폐쇄성해역이다
.
황해중앙부에는수심70-80 m
의 깊은해저골짜기(Sea trough)
가있으며, 10˚C
이하의수온과32.0-33.5 psu
의범위인황해저층냉수가연중분포하는특징을가지고있다
(Nakao, 1977; Lie, 1984; Youn et al.,1991; Jang et al., 2011).
또한NOAA
가구분한전세계64
개광역해양생 태계(LME: Large Marine Ecosystem)
중하나이기도하며수산자원의어획량이 전해양의약
5%
정도를차지한다(FAO,
2009).
하지만최근중국의산둥성및발해만의개발과산업단지의조성으로인해해양환경사고와해양환경오염이빈번하
게발생하고있으며중국어선들의남획으로인하여수산생물 자원이급격한감소가보고되고있어자원관리를위해서는다 양한분야에서종합적인연구가필요하다
(Joo, 2006; Im et al, 2009; Lee, 2014).
지금까지황해에서식하는어류를대상으로수행된종조성및 군집구조에대한연구중우리나라의경우대부분이
EEZ
내에 서수행되어한국과중국사이황해중부의어업자원에대한연 구는매우부족한실정이다(Kim et al., 1999; Yeon et al., 2004;
Joo, 2006; Im, 2007; Im et al., 2009; Kim et al., 2011).
또한중 국의경우대부분1
년단위의짧은기간동안4
계절변화에대 한연구가보고되었다(Jin and Tang, 1996; Chen et al., 1997;
Jin et al., 2003; Xu and Jin, 2005).
그러나,
단기간의연구결과 로는해당해역의해양환경및자원의변동을파악하기에어려 움이있으므로본연구는7
년간황해중앙부에서하계에서식하황해중앙부에서 저층트롤에 의해 어획된 하계의 어류 종조성 및 분포특성 (2008-2014)
고은혜·주형운·이동우
1·차형기·최정화
2*
국립수산과학원 연근해자원과, 1국립수산과학원 기반연구부, 2국립수산과학원 남동해수산연구소
Community Composition and Distribution of Fish Species Collected by Bottom Trawl from the Middle of the Yellow Sea in Summer (2008–2014)
Eun Hye Koh, Hyeong Woon Joo, Dong Woo Lee
1
, Hyung Kee Cha and Jung Hwa Choi2
*Coastal Water Fisheries Resources Research Division, National Institute of Fisheries Science, Busan 46083, Korea
1
Fundamental Research Department, National Institute of Fisheries Science, Busan 46083, Korea
2
Southeast Sea Fisheries Research Institute, National Institute of Fisheries Science, Tongyeong 53085, Korea
The community composition and distribution of fish species in the middle of the Yellow Sea were investigated in summer from 2008 to 2014. A total of 72 demersal fish species from 46 families and 17 orders were collected. The most common species were Larimichthys polyactis , Engraulis japonicus , and Chaeturichthys hexane , which account- ed for 72.0% of the total number of individuals while Liparis tanakai , Larimichthys polyactis , and Lophius litulon accounted for 67.8% of the total biomass. A cluster analysis based on the Bray-Curtis similarity revealed that the fish community fell into three groups, according to latitude. Principal Component Analysis (PCA) and correlation analy- sis showed that variation in bottom water temperature could act as an indicator of variation in community structure and abundance of the dominant species. Characteristics of fish communities, such as the number of species, the total number of individuals (/km
2), and biomass (/km
2), were highly correlated with bottom water temperature and depth.
Key words: Middle of the Yellow Sea, Bottom trawl, Species composition
This is an Open Access article distributed under the terms of the Creative Commons Attribution Non-Commercial Licens (http://creativecommons.org/licenses/by-nc/3.0/) which permits unrestricted non-commercial use, distribution, and reproduction in any medium, provided the original work is properly cited.
http://dx.doi.org/10.5657/KFAS.2016.0849 Korean J Fish Aquat Sci 49(6) 849-855, December 2016
Received 1 November 2016; Revised 10 December 2016; Accepted 13 December 2016
*Corresponding author: Tel: +82. 55. 640. 4720 Fax: +82. 55. 641. 4774
E-mail address: [email protected]
고은혜
ㆍ
주형운ㆍ
이동우ㆍ
차형기ㆍ
최정화850
는어류의분포특성을파악하였으며나아가
,
수산자원의장기 변동성을이해하고자한다.
재료 및 방법
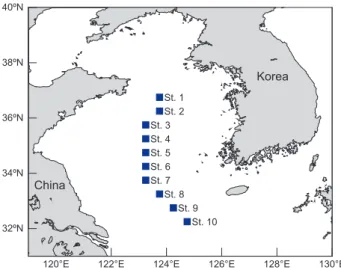
본연구는
2008
년부터2014
년까지하계인7-8
월에황해중앙해역을따라남북방향으로 정점별약
30 km
인10
개의정점(32.25°, 123.25°-36.75°, 124.75°)
을설정하고년1
회씩총7
회 트롤조사를실시하였다(Fig. 1).
조사에는국립수산과학원시 험조사선탐구20
호(885
톤)
의트롤어구(cod end, 20 mm)
를 사용하였고,
예망은선속평균3.3 knot
로60
분을기준으로하 였으나,
해저의상태에따라시간을조정(30-60
분)
하였다.
채집된생물중어류만을선별하여분석시료로사용하였고
, Nakabo (2013)
와Kim et al. (2005)
에따라종을동정한후,
개 체수와생체량(
습중량, 1 g)
을기록하였다.
트롤에의해채집된어류의출현량과서식환경의관계를파악 하기위해
CTD (Sea-bird 911plus)
를이용하여정점별수심과 저층수온및염분(
바닥에서5 m
층)
을측정하였다(
각정점별평 균,
표준편차로나타냈다.).
분석에사용된자료는소해면적법에따라단위면적당
(km
2)
개체수및생체량으로환산하였으며어획효율q
값은0.5 (Pra- do, 1990)
를적용하였다.
이때출현량은연도별채집된모든값 을합산하여계산하였다.
정점별 종 다양성을 파악하기 위하여
,
종 다양도지수(H′, Shannon and Wiener, 1963)
를구하였다.
정점별출현종의분 포 양상을파악하기 위하여출현 종수와개체수를 바탕으로Bray-Curtis
유사도지수를구하고group-average
방법을이 용하여 군집분석(Cluster analysis)
을 실시하였으며,
구분된 그룹간의차이를유발하는종과기여하는종을알아보기위해SIMPER
분석(Clarke and Warwick, 2001)
을실시하였다.
또 한어류의군집구조와해양환경요인과의관계를분석하기위 하여주성분분석(Principal Component Analysis, PCA)
을실 시하고추출된Principal Score
값과해양환경요인과의상관분 석(Correlation analysis)
을통해군집구조변동의요인을파악 하였으며,
출현종수및출현량(
개체수,
생체량)
과환경요인과의상관성을알아보기위하여
Pearson
상관분석을실시하였다.
분석에사용된모든자료는우점종의
bias
를줄이기위하여로그변환
[log10(x+1)]
을수행하였고,
소수로 채집된비우점종 은오류를증가시킬확률이높기때문에분석에서제외시켜전 체의98.7%
를차지하는상위13
종을이용하였다.
자료분석에 는PRIMER 5.0 (PRIMER-E, Plymouth, UK)
과SPSS 20.0 (IBM Corp, USA)
프로그램을사용하였다.
결 과
조사해역의정점별수심은
47-73 m
범위로평균수심이62 m
로위도상남쪽정점으로갈수록수심이낮아지는해저지형의 형태였다.
저층수온의범위는7.8-15.4℃
로수심과반대로위 도상남쪽정점으로갈수록증가하는경향을나타내었으며,
저 층염분의범위는31.9-33.4 psu
로나타났다(Table 1).
조사기간동안출현한어류는
17
목, 46
과, 72
종으로분류군별 로농어목(Perciformes)
어류가15
과24
종,
쏨뱅이목(Scorpae- niformes) 7
과13
종,
가자미목(Pleuronectiformes) 4
과11
종,
뱀 장어목(Anguilliformes) 4
과4
종,
청어목(Clupeiformes) 2
과4
종,
대구목(Gadiformes)
과복어목(Tetraodontiformes)
이2
과2
종씩,
홍메치목(Aulopiformes)
과아귀목(Lophiiformes)
이1
과2
종씩,
그외금눈돔목(Beryciformes),
샛비늘치목(Myctophi- formes),
큰가시고기목(Gasterosteiformes),
첨치목(Ophidi- iformes),
홍어목(Rajiformes),
돔발상어목(Squaliformes),
앨 퉁이목(Stomiformes),
달고기목(Zeiformes)
은1
과1
종씩출현32ºN 34ºN 36ºN 38ºN 40ºN
120°E 122°E 124°E 126°E 128°E 130°E
China
Korea
St. 1 St. 2 St. 3 St. 4 St. 5 St. 6 St. 7 St. 8 St. 9 St. 10
-4 -2 0 2 4
-6 -4 -2 0 2 4 6
Principle component 1
Pr in cipl e co m po ne nt 2
St. 1 St. 2 St. 3 St. 4 St. 5 St. 6 St. 7
St. 8 St. 9
St. 10 32ºN
34ºN 36ºN 38ºN 40ºN
120°E 122°E 124°E 126°E 128°E 130°E
China
Korea
Group AGroup B Group C
St. 1 St. 2 St. 3 St. 4 St. 5 St. 6 St. 7
St. 8 St. 9
St. 10
Similarity
50 60 70 80 90 100
0 200 400 600 800
N o. of in ds . (1 ,00 0 in ds ./km
2)
0 2 4 6 8 10
Bi omass (t on //km
2)
0 10 20 30 40 50
N o. of s pe ci es
0.0 0.5 1.0 1.5 2.0
St. 1 St. 2 St. 3 St. 4 St. 5 St. 6 St. 7 St. 8 St. 9 St. 10
Station
D iv er si ty ind ex (H ')
(A)
(C) (B)
(D)
Fig. 1. Location of sampling site in the middle of the Yellow Sea from 2008 to 2014.
Table 1. Mean (±SD) environmental values of depth, bottom tem- perature and salinity by sampling stations in the middle of the Yel- low Sea from 2008 to 2014
Station Depth (m) Temperature (℃) Salinity (psu) St. 1 73 (±3) 7.8 (±0.75) 32.5 (±0.34) St. 2 73 (±4) 8.7 (±1.21) 33.1 (±0.55) St. 3 67 (±3) 8.9 (±0.85) 33.1 (±0.30) St. 4 68 (±4) 9.3 (±0.82) 33.2 (±0.26) St. 5 72 (±4) 10.0 (±0.55) 33.2 (±0.52) St. 6 66 (±3) 9.9 (±1.16) 33.3 (±0.35) St. 7 58 (±3) 10.3 (±1.29) 33.4 (±0.41) St. 8 55 (±2) 10.8 (±1.24) 33.3 (±0.38) St. 9 41 (±4) 13.7 (±1.25) 32.3 (±0.37) St.10 43 (±4) 15.4 (±2.01) 31.9 (±0.60)
황해중앙부 어류의 종조성 및 분포특성
851
하였다
.
채집된 어류의 단위면적당 개체수는 참조기
(Larimichthys polyactis)
가전체의채집개체수의28.6%
를차지하여가장많 았고,
다음으로 멸치(Engraulis japonicus)
가28.5%,
도화망 둑(Chaeturichthys hexanema)
이15.0%
순으로나타났다.
그 외꼼치(Liparis tanakai)
와풀미역치(Erisphex pottii)
는 각각8.0%, 5.4%
로상위5
종이전체의채집개체수의85.5%
를차지하였다
.
단위면적당생체량은꼼치가43.1%
를차지하여가 장 많았고,
다음으로 참조기13.4%,
황아귀(Lophius litulon) 11.2%
순으로나타났다.
그외멸치와대구(Gadus macroceph- alus)
는각각8.1%, 5.2%
로상위5
종이전체의81.1%
를차지 하였다.
단위면적당개체수의변화를살펴보면
St. 1
에서약23,880 inds./km
2으로가장낮게나타났으며, St. 3
에360,445 inds./
km
2로급격히증가하였으나다시감소한후St. 9
에서623,751 inds./km
2로가장많이채집되었다(Fig. 2A).
생체량의경우개 체수와비슷한증감형태를나타내었으며, St. 2
에서1,108 kg/
km
2로가장적고St. 9
에서9,597 kg/km
2로가장많이채집되 었다(Fig. 2B).
출현종수의경우St. 7-10
에서30
종이상채집되 었으며, St. 2
에서16
종으로가장적은종수가채집되었다(Fig.
2C).
종다양성지수는0.47-1.66
의범위로평균1.07
로나타났 으며, St. 6
이가장낮았고St. 10
이가장높았다(Fig. 2D).
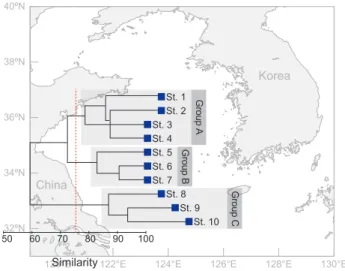
전체조사기간동안출현한상위
13
종의단위면적당개체수 값을이용하여 정점별어류군집의유사도를 분석한결과약75%
에서3
개의그룹으로 구분되었다(Fig. 3).
각 그룹은위 도상 황해중앙해역의북부(Group A),
중앙(Group B),
남부(Group C)
로구분하였으며,
각그룹에기여한종수는Group A
는6
종, Group B
는9
종, Group C 10
종으로아래쪽정점으로 내려갈수록그룹간차이에기여하는종이증가하였다.
그중기 여도가높은상위3
종을살펴보면Group A
는대구,
꼼치,
흰베 도라치(Pholis fangi), Group B
는멸치,
꼼치,
황아귀, Group C
는참조기,
꼼치,
성대(Chelidonichthys spinosus)
로나타났으 며,
공통적으로꼼치가상위종에속하였다(Table 2).
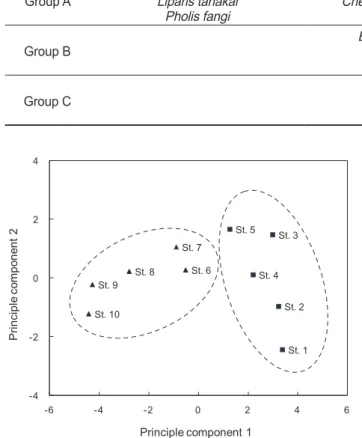
정점간어류의종조성의변동에가장많은영향을미치는해 양환경요인을알아보기위하여
13
종을대상으로한주성분분석
(PCA)
결과전체변동의누적85%
까지기여하는상위성분32ºN 34ºN 36ºN 38ºN 40ºN
120°E 122°E 124°E 126°E 128°E 130°E
China
Korea
St. 1 St. 2 St. 3 St. 4 St. 5 St. 6 St. 7 St. 8 St. 9 St. 10
-4 -2 0 2 4
-6 -4 -2 0 2 4 6
Principle component 1
Pr in cipl e co m po ne nt 2
St. 1 St. 2 St. 3 St. 4 St. 5 St. 6 St. 7
St. 8 St. 9
St. 10 32ºN
34ºN 36ºN 38ºN 40ºN
120°E 122°E 124°E 126°E 128°E 130°E
China
Korea
Group AGroup B Group C
St. 1 St. 2 St. 3 St. 4 St. 5 St. 6 St. 7
St. 8 St. 9
St. 10
Similarity
50 60 70 80 90 100
0 200 400 600 800
N o. of in ds . (1 ,00 0 in ds ./km
2)
0 2 4 6 8 10
Bi omass (t on //km
2)
0 10 20 30 40 50
N o. of s pe ci es
0.0 0.5 1.0 1.5 2.0
St. 1 St. 2 St. 3 St. 4 St. 5 St. 6 St. 7 St. 8 St. 9 St. 10
Station
D iv er si ty ind ex (H ')
(A)
(C) (B)
(D)
Fig. 2. Variations in number of number of individuals (A), bio- mass (B), number of species (C) and diversity index (D) of fish by sampling stations in the middle of the Yellow Sea from 2008 to 2014. (D: Filled circles and vertical line denote means and 95%
confidence intervals, respectively.)
32ºN 34ºN 36ºN 38ºN 40ºN
120°E 122°E 124°E 126°E 128°E 130°E
China
Korea
St. 1 St. 2 St. 3 St. 4 St. 5 St. 6 St. 7 St. 8 St. 9 St. 10
-4 -2 0 2 4
-6 -4 -2 0 2 4 6
Principle component 1
Pr in cipl e co m po ne nt 2
St. 1 St. 2 St. 3 St. 4 St. 5 St. 6 St. 7
St. 8 St. 9
St. 10 32ºN
34ºN 36ºN 38ºN 40ºN
120°E 122°E 124°E 126°E 128°E 130°E
China
Korea
Group AGroup B Group C
St. 1 St. 2 St. 3 St. 4 St. 5 St. 6 St. 7
St. 8 St. 9
St. 10
Similarity
50 60 70 80 90 100
0 200 400 600 800
N o. of in ds . (1 ,00 0 in ds ./km
2)
0 2 4 6 8 10
Bi omass (t on //km
2)
0 10 20 30 40 50
N o. of s pe ci es
0.0 0.5 1.0 1.5 2.0
St. 1 St. 2 St. 3 St. 4 St. 5 St. 6 St. 7 St. 8 St. 9 St. 10
Station
D iv er si ty ind ex (H ')
(A)
(C) (B)
(D)
Fig. 3. A Dendrogram of clustering on fish assemblage by sam- pling stations in the middle of the Yellow Sea from 2008 to 2014.
고은혜
ㆍ
주형운ㆍ
이동우ㆍ
차형기ㆍ
최정화852
이
2
개의축으로구분되었다(Fig. 4). PC 1
은총분산의71.8%, PC 2
는12.5%
로위성분이총분산의84.3%
를차지하였다. PC
1
에투영된정점별주성분값을살펴보면,
비교적수심이깊고저층수온이낮은
St. 1-5
은PC 1
성분축에서양의값을나타내 었고,
수심이얕고수온이높았던St. 6-10
은음의값을나타내 었다.
추출된Principal Score
값과해양환경요인과의상관분석결과
PC 1
은저층수온과수심에유의한차이가있었으나,
저층수온이가장크게유의한차이를나타냈으며
(P<0.01), PC 2
는다른환경요인과유의한결과를나타내지않았다
(Table 3).
또한저층수온과염분
,
수심이출현한어류의종수와단위면적당 개체수및생체량에미친영향을알아보기위하여상관분석을 실시한결과,
출현종수와개체수및생체량은저층수온과양의 상관관계,
수심과는음의상관관계를나타냈으며(P<0.05),
저 층염분과는유의한관계를나타내지않았다(Table 4).
고 찰
Lee (2004)
의보고에의하면황해에서는총30
목109
과339
종의어류가서식하며농어목이
41%,
쏨뱅이목12%,
가자미목9%,
복어목7%
를차지한다고알려져있는데,
본연구에서는농 어목이전체의33%,
쏨뱅이목18%,
가자미목이15%
를차지하 여유사한어류상을나타내었다.
황해에서저층트롤을이용한 선행연구를살펴보면,
황해동부에서171
종(Im, 2007)
과97
종(Im et al., 2009),
동중국해와황해중·
서부에서봄과가을에각177
종, 149
종(Jin et al., 2003)
으로본연구의72
종보다많은것 으로나타났다.
이는시기의차이뿐아니라황해중부에비해황 해동부와서부가생산력이높고다양한생물의산란장이나색 이장이연안역(Boaden and Seed, 1985; Cha, 1999; Kwak and
Huh, 2007)
에많이포함되어출현종이다양하게나타난것으로Table 4. Pearson correlation coefficients (r value) between envi- ronmental variables and three variables (total number of species, individuals and biomass) by sampling stations related to fish in the middle of the Yellow Sea from 2008 to 2014 (*=P <0.05, **=P
<0.01)
Total no. of species
Total no.
of individuals (inds./km2)
Total biomass (kg/km2) Bottom
temperature 0.821** 0.726* 0.773**
Bottom salinity -0.314 -0.456 -0.299
Depth -0.820** -0.707* -0.841**
Table 3. The relationship between PC scores and bottom tempera- ture, salinity and depth (*=P<0.05, **=P<0.01)
Pearson's r value PC score 1 PC score 2
Bottom temperature -0.930** 0.001
Bottom salinity 0.435 0.623
Depth 0.911** 0.192
Table 2. The list of higher contributing species to similarity within each groups and dissimilarity between group by sampling stations (Group A, B, C) in the middle of the Yellow Sea from 2008 to 2014 as revealed by the SIMPER analysis
Group A Group B Group C
Group A Gadus macrocephalus Liparis tanakai
Pholis fangi
Scomber japonicus Chelidonichthys spinosus
Conger myriaster
Chaeturichthys hexanema Gadus macrocephalus Chelidonichthys spinosus
Group B Engraulis japonicus
Liparis tanakai Lophius litulon
Gadus macrocephalus Chaeturichthys hexanema
Decapterus maruadsi
Group C Larimichthys polyactis
Liparis tanakai Chelidonichthys spinosus
32ºN 34ºN 36ºN 38ºN 40ºN
120°E 122°E 124°E 126°E 128°E 130°E
China
Korea
St. 1 St. 2 St. 3 St. 4 St. 5 St. 6 St. 7 St. 8 St. 9 St. 10
-4 -2 0 2 4
-6 -4 -2 0 2 4 6
Principle component 1
Pr in cipl e co m po ne nt 2
St. 1 St. 2 St. 3 St. 4 St. 5 St. 6 St. 7
St. 8 St. 9
St. 10 32ºN
34ºN 36ºN 38ºN 40ºN
120°E 122°E 124°E 126°E 128°E 130°E
China
Korea
Group AGroup B Group C
St. 1 St. 2 St. 3 St. 4 St. 5 St. 6 St. 7
St. 8 St. 9
St. 10
Similarity
50 60 70 80 90 100
0 200 400 600 800
N o. of in ds . (1 ,00 0 in ds ./km
2)
0 2 4 6 8 10
Bi omass (t on //km
2)
0 10 20 30 40 50
N o. of s pe ci es
0.0 0.5 1.0 1.5 2.0
St. 1 St. 2 St. 3 St. 4 St. 5 St. 6 St. 7 St. 8 St. 9 St. 10
Station
D iv er si ty ind ex (H ')
(A)
(C) (B)
(D)
Fig. 4. A ordination diagram for the first two principal components on the abundance 13 most numerous species in the middle of the Yellow Sea from 2008 to 2014.
황해중앙부 어류의 종조성 및 분포특성
853
판단된다
.
그러나Joo (2006)
와Kim et al. (2011)
의연구에서 는각각38
종과26
종이채집되어본연구의결과와2
배가까이 적은종수가출현했다고보고하였다.
이는사용한어구의망목크기에대한차이로본연구에서사용된그물코크기는
20 mm
이며
, Joo (2006)
와Kim et al. (2011)
은각각150 mm, 60 mm
로비교적큰그물코를사용하여소형어종의출현이적게나타 난것으로생각된다.
특히본연구와가장비슷한시기와해역에 서조사된Kim et al. (2011)
의연구에서는26
종중18
종이동일 한어류가채집되었고,
위도상남쪽으로내려올수록종다양도 가높은것으로나타나본연구와비슷한결과를나타내었으며 이는황해남쪽이대마난류를따라회유하는다양한어종의출 현에의한것으로여겨진다.
본연구에서개체수와생체량에서모두우점한종은참조기
,
멸치,
꼼치,
대구로선행연구에서언급한우점종과유사하게나 타났으며(Jin et al., 2003; Yeon et al., 2004; Xu and Jin, 2005;
Joo, 2006; Im, 2007; Im et al., 2009; Kim et al., 2011),
특히멸치의경우황해에서가장우점하는종으로알려져있어
(Xu and
Jin, 2005)
본연구결과와일치하였다.
대구의경우도황해냉수대역을중심으로주로분포하며
(Im, 2007)
주로서해북부에서어장이형성된다고알려져있는기존의연구
(NFRDI, 2010)
와유사한결과를나타내었다.
특히황해의대부분의어류자원 들이동중국해에서월동후봄철수온상승에따라황해로내유 하며한국과중국연안에서산란,
성장하고있어가을연안수 온하강과함께동중국해로월동회유하는것으로알려져있다(Lim et al., 1970; Lee et al., 1995).
본연구의경우하계만을 대상으로한조사이지만참조기와같이하계에형성되는황해 냉수대에영향을받는황해주요어종의분포및이동을이해하 기위한중요한자료가될것으로사료된다.
또한황해중부해역은위도상북쪽과남쪽으로뚜렷한공간적 분포차이를보였는데
,
이는우점종의출현량과환경요인에영 향을받는다고 알려져있다(Yeon et al., 2004; Im, 2007).
본 연구에서도위도상가장북쪽인Group A
에서대표적냉수성 어종인대구가가장크게기여하였으며,
중간정점을포함하는Group B
에서는황해중·
서부에주우점종알려져있는멸치가,
가장남쪽인
Group C
에서참조기가가장크게기여하여분리된그룹중가장다양한종이군집구분에영향을미친것으로나타 났다
.
이러한결과는황해동부의기존연구에서위도상위쪽정점과아래쪽정점으로분리되는군집과
(Joo, 2006),
외해의경우북쪽과남쪽으로군집이구분되어
(Im, 2007)
군집구분에서도유사한결과를나타내었다
.
또한모든그룹에서군집구분에 기여하는상위종으로출현한꼼치는황해중앙해역이주요한성 육장인것으로추정되지만,
추가적으로황해의동서부연안역 을포함한추가연구가진행되면1
년생인꼼치의정확한성육장및이동경향등을추정할수있을것으로판단된다
(Kosaka
et al., 1971; Ustadi et al., 2005).
PCA
분석결과이러한군집구조에서의차이는저층수온에따라구분되는것으로나타났다
(P<0.01).
수온은해양생물군 집의생물상변화에영향을미치기때문에중요한해양환경요 인으로알려져있다(Francis et al., 2002; Garces et al., 2006;
Tittensor et al., 2010).
특히본연구에서황해저층냉수대로정 의되는수온(10˚C
이하)
과염분(32.0-33.5 pus)
은St. 6
과St. 7
사이위도34°
를경계로나타났는데이는군집분석의결과와도 비슷한결과를나타냈으며,
여름철안정된수괴와강한일사량 으로인한수온약층의발달로저층수온분포로부터황해저층 냉수괴의뚜렷한경계를내는Seung (1992)
과Lee (1996)
의연 구결과와일치하였다.
또한Hong et al. (1995)
의보고에따르 면대형저서동물군집에서도출현종조성과서식밀도에서의분 포에따라황해냉수괴군집과비교적고온·
고염분수를나타내 는주변군집을경계로생태적장벽(Ecological barrier)
이존재 한다고보고하였는데이는본연구결과가장남쪽군집(Group
C)
의경계와상당히일치하여,
어류의군집또한이경계로황해저층냉수의영향을받아군집이구분되는것이라고해석할수 있다
.
뿐만아니라Lim et al. (2014)
의연구에따르면황해에서이용되는주요어종인참조기의여름철어획적수온이
15.8˚C
이며황해저층냉수의확장과축소에따른해양환경변화를크 게받아황해저층냉수의확장이강할수록어획수준이낮아지 는것으로나타났다
.
이는본연구에서참조기의출현량이평균저층수온이낮은곳에서
(St. 1-5)
가장적으며수온이가장높은
St. 10 (15.4˚C)
에서높은것으로나타나어류의출현이저층 냉수대에영향을받는것으로판단된다.
또한출현한어종수,
개 체수,
생체량과환경요인과의상관관계에서는저층수온과수 심의영향을많이받았고비교적높은상관관계나타내었는데(P<0.05),
이는기존의연구와일치하는 결과이다(Joo, 2006;
Im, 2007).
그러나연도별변화에따른우점종의출현과환경요인의상관관계에서유의한차이가나타나지않았는데
(P>0.05),
이는황해동부(1990
년대후반)
와황해남부(1980
년대후반)
가각각
1990
년대와1980
년대후반이후로종조성과군집구조에서의큰변화가없는것으로나타나
(Jin et al., 2003; Xu and Jin, 2005; Im, 2007)
연도별로는종조성에서큰변화를나타나 지않는것으로생각되지만보다장기적이고과학적인모니터 링조사를통한명확한변화양상을파악할필요가있다고생각 된다.
그동안우리나라에서수행된황해에서의연구는연안과 근해에초점이맞춰져있거나단발성조사로제한되어있어황 해의전반적인수산생물에대한조사가미진한상태이다.
따라 서황해중부해역은앞으로더욱체계적이고정밀한조사를통 한생태계의변화양상을파악해야할필요가있다고생각된다.
사 사
본연구는국립수산과학원수산과학연구사업
(R2016026)
의 지원에의해수행되었습니다.
References
고은혜
ㆍ
주형운ㆍ
이동우ㆍ
차형기ㆍ
최정화854
Boaden PJS and Seed R. 1985. An Introduction to Coastal Ecol- ogy. Chapman and Hall, New York.
Cha BY. 1999. Species composition of fish in coastal water off Goeje Island. Korean J Ichthyol 11, 184-190.
Chen D, Liu Q, Zeng X and Su Z. 1997. Catch composition and seasonal variation of set net fisheries in the Yellow and Bohai Seas. Fish Res 32, 61-68.
Clarke KR and Warwick RM. 2001. Changes in marine com- munities. In: an approach to statistical analysis and inter- pretation. Natural environment research council Plymouth Marine Laboratory, UK, 114.
FAO. 2009. The state of world review of fisheries and Aquacul- ture 2008. Rome, Italy, 546.
Francis MP, Hurst RJ, McArdle BM, Bagley NW and Anderson OF. 2002. New Zealand demersal fish assemblages. Environ Biol Fish 65, 215-234.
Garces LR, Stobutzki I, Alias M, Campos W, Koongchai N, Lachica-Alino L, Mustafa G, Nurhakim S, Srinath M and Silvestre G. 2006. Spatial structure of demersal fish assem- blages in South and Southeast Asia and implications for fisheries management. Fish Res 78, 143-157. http://dx.doi.
org/10.1016/j.fishres.2006.02.005.
Hong JS, Yoo JW and Park HS. 1995. Niche characteriza- tion of the tree species of genus Ophiura (Echinodermata, Ophiuroidea) in Korean waters, with special emphasis on the distribution of Ophiura sarsi vadicola Dja. J Oceanogr 30, 442-457.
Im YJ. 2007. Species Composition and Abundance of Fish Col- lected by Otter Trawl in the Eastern Yellow Sea. Ph.D. The- sis, Inha University, Incheon, Korea.
Im YJ, Hwang HJ, Lee JB, Shon MH and Yeon IJ. 2009. Fish fauna collected by an otter trawl in the eastern Yellow Sea over the period 1999-2001. Korean J Ichthyol 21, 299-306.
Jang ST, Lee JH, Kim CH, Jang CJ and Jang YS. 2011. Move- ment of cold water mass in the northern east china sea in summer. J Oceanogr 16, 1-13. http://dx.doi.org/10.7850/
jkso.2011.16.1.001.
Jin X and Tang Q. 1996. Changes in fish species diversity and dominant species composition in the Yellow Sea. J Fish Res 26, 337-352. http://dx.doi.org/10.1016/0165- 7836(95)00422-X.
Jin X, Xu B and Tang Q. 2003. Fish assemblage structure in the East China Sea and southern Yellow Sea during autumn and spring. J Fish Biol 62, 1194-1205. http://dx.doi.org/10.1046 /j.1095-8649.2003.00116.
Joo H. 2006. Variation in Abundance and Species Composition of Fishes by Bottom Otter Trawl in The Middle of Yellow Sea, Korea 2000. Ph.D. Thesis, Yeosu National University, Yeosu, Korea.
Kim IS, Choi Y, Lee CR, Lee YJ, Kim BJ and Kim JH. 2005.
Illustrated Book of Korean Fishes. Gyohaksa, Seoul, Korea.
Kim MS, Kim DS, Kim MS, Lee JG, Kim JH and Kang IK.
2011. Distribution characteristics composition of fishes by a bottom trawl in the jointly controlled waters of the East China Sea. J Fish Mar Sci Edu 23, 141-152.
Kim JY, Yeon IJ, Hong SH, Im YJ, Hwang HJ, Cho SH, Kim SA and Kang DH. 1999. Distribution of fisheries resources by the scientific resource surveys in the western waters of Korea. Bull Natl Fish Res Dev Inst 57, 13-25.
Kosaka M. 1971. On the ecological niche of the sea snails, Li
paris tanakai in Sendai Bay. J Coll Mar Sci Tech Tokai Univ
5, 27-41.Kwak SN and Huh SH. 2007. Temporal variation in species composition and abundance of fish assemblages in Masan Bay. Korean J Ichthyol 19, 132-141.
Lee CL. 2004. Review of the fish-fauna of the West Sea of Ko- rea. Korean J Ichthyol 16, 60-74.
Lee HB. 2014. Characteristics of Sound-Scattering Layer in Yellow Sea Bottom Cold Water Using Hydroacoustic Tech- nique. Ph.D. Thesis, Hangyang University, Seoul, Korea.
Lee YC. 1996. The Exploitation Research of Marine Resources on the Yellow Sea. Inha Univ., Korea, 827.
Lee YC, Yoo JM, Kim WS and Kim S.1995.On the distribution of larval fish in the Yellow Sea. The Yellow Sea 1, 1-8.
Lie HJ. 1984. A note on water masses and general circulation in the Yellow Sea (Hwanghae). J Oceanol Soc Korea 19, 187- Lim TY, Jo MK and Lee MJ. 1970. The occurrence and distribu-194.
tion of the fish eggs and larvae in the Korean adjacent sea.
Reports Fish Resource 8, 7-29.
Lim YN, Kim HY and Kim DH. 2014. Predicting changes in fishing conditions for the small yellow croaker Larimichthys
polyactis based on expansions of the Yellow Sea bottom
cold water. Korean J Fisher Aquat Sci 47, 419-423. http://dx.doi.org/10.5657/KFAS.2014.0419.
Nakabo T. 2013. Fishes of Japan with pictorial keys to the spe- cies. 3rd ed, Tokai University Press, Tokyo, Japan.
Nakao T. 1977. Oceanic variability in relation to fisheries in the East China Sea and the Yellow Sea. J Fac Mar Sci Tech To- kai Univ., 190-367
NFRDI (National Fisheries Research & Development Insti- tute). 2010. Ecology and Fishing Ground of Fisheries Re- sources in Korean Waters. Yemoonsa, Busan, Korea, 384.
Prado J. 1990. Fisherman’s Workbook. FAO, Fishing News Books, Oxford, England 99, 1-180.
Seung YH. 1992. Water masses and circulations around Korean peninsula. J Oceanogr 27, 324-331.
Shannon CE and Weaver W. 1963. The mathematical theory of communication. University of Illinois Press Urbana, 77.
Tittensor DP, Mora C, Jetz W, Lotze HK, Ricard D, Berghe EV and Worm B. 2010. Global patterns and predictors of ma- rine biodiversity across taxa. Nature 466, 1098-1101. http://
dx.doi.org/10.1038/nature09329.
Ustadi U, Kim KY and Kim SM. 2005. Purification and
황해중앙부 어류의 종조성 및 분포특성
855
identifica tion of a protease inhibitor from glassfish (Liparis
tanakai) eggs. J Agric Food Chem 53, 7667-7672. http://
dx.doi.org/10.1021/jf0482459.
Xu B and Jin X. 2005. Variations in fish community structure during winter in the southern Yellow Sea over the period 1985-2002. J Fish Res 71, 79-91. http://dx.doi.org/10.1016/j.
fishres.2004.07.011.
Yeon IJ, Hwang HJ, Choi YM, Im YJ, Hong SH and Ko TS.
2004. Summer spatial distribution and abundance of domi- nant fisheries resources in the Yellow Sea. J Korean Soc Fish Res 6, 63-78.
Youn YH, Park YH and Bong JH. 1991. Enlightenment of the characteristics of the Yellow Sea bottom cold water and its southward extension. J Kor Earth Sci 12, 25-37.