Monitoring water injection with borehole ERT: preliminary results of an experiment carried out in Sindos (N. Greece)
gPanagiotis Tsourlos1), Jung-Ho Kim2), George Vargemezis1), and Myeong-Jong Yi2)
1)Geophysics Department, Aristotle University of Thessaloniki, Greece, [email protected]
2) Engineering Geophysics Group, Korea Institute of Geoscience & Mineral Resources, Korea
Abstract: This work describes the installation and preliminary measurements of an electrical resistivity tomography (ERT) system to monitor the injection of recycled water into a confined aquifer in the area of Sindos (Thessaloniki N. Greece). The aim is to provide, through time- lapse ERT measurements and processing, geoelectrical images of rather increased volumetric sampling around and between the holes and to obtain improved understanding of the flow and transport of the injected water. The details about the general setting, the construction and installation of the ERT cables into the boreholes are explained in full. Preliminary measurements involving single and cross-hole ERT measurements were obtained and processed with a 2D inversion algorithm to produce images of the subsurface. Results depict a very good correlation between ERT images and the lithology and resistivity logs; an indication of the reliability of the approach.
Keywords: cross-hole ERT, single-borehole ERT, water injection, inversion
1. INTRODUCTION
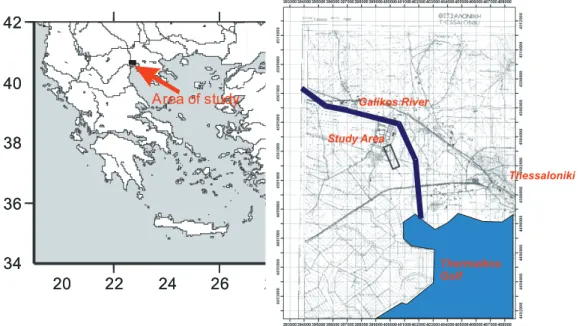
This study was undertaken in support of a larger programme to access the impact of recycled water injection into a confined aquifer at the Area of Sindos, around 12 Km east to the city of Thessaloniki (Greece) (Fig 1). The overall aim of this injection process is to improve the quality of a degraded aquifer and increase the groundwater quantity. The project involves the injection of water coming from the Thessaloniki sewage treatment plant after being subjected to tertiary treatment to reach the standards required (viz. potable water) before it is discharged into the ground.
The construction of the injection facility is currently completed and involved the drilling a 100m main injection well (P0, Fig 2) to allow the injection of 13 m3/h of recycled water and additional four 100m piezometers around it (P1-P4, Fig 2) to allow the monitoring of the injection process. Standard procedures that were followed before, during and after the drilling involved: (i) preliminary hydrogeological study and surface geophysical survey to position and design the boreholes. (ii) water level monitoring and rock sampling and analysis during the boring (iii) well logging, (iv) analysis of water samples, (v) pumping tests. Currently, permanent monitoring stations are submerged into three of the piezometers to monitor water level, conductivity and PH before and during the injection process. Further, the systematic chemical analysis of water samples which was initiated before the injection will continue for several months after the injection starts.
Monitoring is a rather essential part in every water injection process (EEA, 1997). Traditional groundwater monitoring relies heavily on “spot” borehole sampling but this approach is often infrequent, and most importantly may not be representative in heterogeneous aquifers. In an attempt to increase the monitoring capabilities of the injection site, permanent in-situ geoelectric
sensors were installed in all 5 boreholes. The present paper is intended to demonstrate the sensor installation procedure, to explain the measurement and data analysis approach and to show preliminary field ERT interpreted images which clearly demonstrate the effectiveness and the potentials of the technique.
The application of ERT has particularly wide use for environmental monitoring involving groundwater exploration, mapping and monitoring salt-water incursion in susceptible aquifers and transport processes of contaminants (LaBrecque, 1989, Daily et al., 1992, Ramirez et al., 1993, Park, 1998). ERT imaging in a time-lapse mode, involving permanent electrode installations, has proven to provide in many cases images of larger volumetric scale, in comparison to the standard spot sampling from boreholes and laboratory chemical analysis, which help to recognise and distinguish pollutant transport mechanisms. Several algorithms for inverting time-lapse ERT data have been reported (Loke, 1999; LaBrecque and Yang, 2001; Yi et al., 2003; Kim, 2005).
In the framework of this project ERT spatio-temporal images combined with water quality monitoring in different water levels will promote the understanding and will help to the evaluation of the water injection process.
34 36 38 40 42
20 22 24 26 28
34 36 38 40 42
20 22 24 26 28
Area of study
Thessaloniki Study Area
Galikos River
Thermaikos Golf
Fig. 1. Location map with the study area marked in black.
2. GEOLOGICAL AND HYDROGEOLOGICAL SETTING
The Sindos area is located in the western part of Thermaikos Gulf, North Greece (Fig. 1). The mean annual rainfall is 449 mm at Sindos rain gauge station. The rainfall occurs mainly from late October to May (78% of annual rainfall).
From a geological point of view, the area is formed of recent unconsolidated material consisting of sands, fine clay to silty sand deposits, which form one multiple aquifer system. Three main aquifer systems can be identified: one phreatic and two deep confined. As a result of their origin the deposits are characterized by high degree of heterogeneity and anisotropy.
Groundwater recharge in the aquifer system occurs via the following mechanisms: direct infiltration of rainfall and infiltration through river beds. The direction of groundwater flow is generally from North to South-West. The water level within these deposits was at an average
depth of about 10-15 m below ground surface (b.g.s.). The groundwater table is below sea level.
There is a small rise trend during the last three years, mainly because of the significant decrease or interruption of the pumping rates from the Thessaloniki Water Supply and Sewerage Company (EYATh).
P1
P0
P2
P3 P4
RIVER
Fig 2. The water injection installation with injection and monitoring wells (P0, P1-4).
Based on the results from the conducted pumping test analyses, the mean hydraulic conductivity was estimated to be k=6.5x10⁻³ m/min- 1.5x10⁻² m/min. Transmissivity (T) and Storage coefficient (S) values vary between T=5.5x10⁻¹ – 9.4x10⁻¹ m2/min and S=10-3, respectively. The presence of silts implies the occurrence of artesian conditions in the area. In the last decades artesian phenomena seized, due to overexploitation. Conductivity logs from the water wells in the region recorded locally high conductivity values ranging from 900 up to 1800 mS/cm indicative of the intense salinization problem faced by some of the aquifers. The planned water injection is intended to improve the quality of such aquifers.
3. ERT INSTALLATION
In order for borehole ERT measurements to be possible PVC rather than metal casing must be used. Further any metal protective casing commonly used in water wells must be avoided. Yet no other special technical specification as to the construction of the borehole is required.
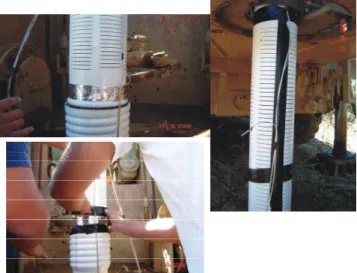
Instrumenting the boreholes to obtain ERT measurements requires the prior construction of special cables and electrodes which are then attached to the borehole’s casing during its installation (Fig 3).
Given that in our case boreholes were planned to have an approximate length of 100m, a 3m inter-electrode was selected as being the optimum. Even though a denser inter-electrode spacing would allow obtaining higher resolution images it was considered impractical given the increased construction and installation cost and the limited channels (48) that the available resistivity-meter can address. As a result every typical borehole cable used in this work had a length of 110m with a total of 36 electrodes spaced 3m apart and 5m lead-in distance.
The borehole cable was made by assembling 36 standard (easily available and low cost) PVC coated 0.5mm copper conductors of variable length (viz. 5,8,11,…110m for 1st, 2nd , 3rd…36th electrodes respectively). As the casing was lowered into the hole the cable was simultaneously
attached to the casing using tag tapes. In order to increase the electrode’s effective area, and thus further reduce contact resistance, each electrode was attached to the casing and then was fully covered by a ring of aluminium tag tape (5cm width) which encircled the casing forming in this way a relatively larger electrode (Fig 3).
Fig. 3. Photographs showing the ERT cable installation.
4. ERT MEASUREMENTS AND INTERPRETATION
The permanently installed cables are planned to be used to obtain cross-hole and surface-to-hole ERT measurements. Yet, at this preliminary stage, extensive repeated tests of the ERT installation have been carried out using single and cross-hole configurations. The aim is to assess the quality of the measurements and further to correlate borehole ERT images with the respective lithological columns and well logs in order to calibrate interpretations and design future systematic time-lapse ERT measurements which will intensify when the injection procedure starts during summer 2007.
Measurements were carried out during several field visits. The recorded contact resistances for the electrodes of all boreholes are very low typically 0.2 KOhm and only the first one or two electrodes which are above the water level (viz. above the depth of 12m) exhibit higher contact resistances (aprox. 10KOhm). This fact allowed introducing currents typically higher than 500mA and thus good quality measurements with excellent repeatability (low RMS errors) were collected. Data were inverted with a smoothness constrained algorithm and the final inversion RMS errors were below 5% after rejecting 2-3% of the data as outliers.
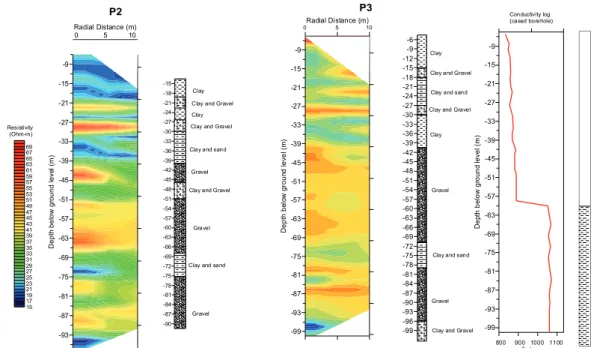
In Fig. 4 the results produced from inverting the dipole-dipole single hole data set (470 data points) from boreholes P2 and P3 are depicted. Generally, low resistivities, suggesting mainly clay formations, are depicted until the depth of 40m followed by formations of higher resistivities corresponding to an inhomogeneous gravel and sand aquifer. The lithological column of the wells are depicted as well in the figure to allow comparisons. The ERT sections is in very good correlation with the lithology logs: low resistivities correspond nicely to the more clayey formations while resistivity highs correspond to gravel and sand layers. ERT images seem to be sensitive even to relatively local lithology changes and most importantly provide an image of the formation up to a radial distance of 10m away from the borehole. This spatial information cannot be obtained with logging or sampling.
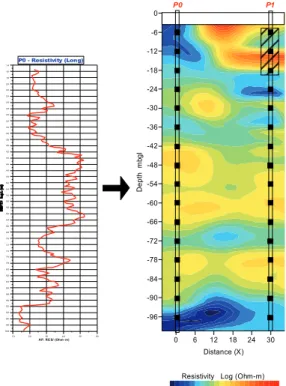
In Fig. 5 the results produced from inverting the diagonal dipole-dipole data-set of the cross- hole data between P0-P3 are depicted. Note that 6m electrode spacing is used in this case. The image shows clearly the stratigraphy and the main aquifers are depicted in detail. The results are in a very good correlation with the resistivity log which was obtained in well P0 before it was cased (Fig. 5 left).
Fig 4. Single borehole inverted ERT image for boreholes P2 (left) and P3(right) with the respective lithology logs
5. DISCUSSION AND CONCLUSIONS
The study shows the potential of ERT even in a single borehole mode. The cable array is easy to build, it is of low cost and can be readily installed in any PVC cased borehole. As long as it is installed it can be used to produce reliable resistivity images of the subsurface with increased resolution compared to the surface geophysical techniques. The fact that the produced image is the “true” resistivity resulting form the inversion of numerous apparent resistivity data renders it more reliable than respective resistivity well logging tools. Further, it produces images of increased spatial information compared to point logging or sampling techniques.
The results presented here demonstrate a very good correlation of the images with the lithology logs: an indication of the reliability of the approach. The permanent installation makes the application of time-lapse measurements easy and will allow the monitoring of the temporal changes into the aquifers due to the water injection. Overall it is believed that the described procedure, combined with standard sampling and analysis, will increases the monitoring ability significantly and will help to understand and evaluate the effects of the water injection process
Radial Distance (m)
-93 -87 -81 -75 -69 -63 -57 -51 -45 -39 -33 -27 -21 -15 -9
Depth below ground level (m)
15 17 19 21 23 25 2729 31 3335 37 3941 43 45 47 49 51 53 55 57 59 61 6365 6769
Radial Distance (m)
-99 -93 -87 -81 -75 -69 -63 -57 -51 -45 -39 -33 -27 -21 -15 -9
Depth below ground level (m)
-99 -96 -93 -90 -87 -84 -81 -78 -75 -72 -69 -66 -63 -60 -57 -54 -51 -48 -45 -42 -39 -36 -33 -30 -27 -24 -21 -18 -15 -12 -9 -6
Clay Clay and Gravel Clay and sand Clay and Gravel
Clay
Gravel
Clay and sand
Gravel 0 5 10
0 5 10
Resistivity (Ohm-m)
-90 -87 -84 -81 -78 -75 -72 -69 -66 -63 -60 -57 -54 -51 -48 -45 -42 -39 -36 -33 -30 -27 -24 -21 -18 -15
Clay and sand
Gravel Clay and sand
Clay
Clay Clay and Gravel
Clay and Gravel
Clay and Gravel Gravel
Gravel
P2 P3
Clay and Gravel -99 -93 -87 -81 -75 -69 -63 -57 -51 -45 -39 -33 -27 -21 -15 -9
Depth below ground level (m)
800 900 1000 1100 ? /cm
Conductivity log (cased borehole)
Fig 5. Cross-hole inverted ERT image for boreholes P0-P2 (right) and the respective resistivity log for P0 (left).
ACKNOWLEDGEMENTS
The support of the geophysical works by the GSRT Greek–.Korean Bilateral Collaboration Project “Borehole-To-Surface Electrical Resistivity Tomography Technology for Environmental Monitoring” is acknowledged.
REFERENCES
Daily, W., Ramirez, A., LaBrecque, D. and Nitao, J., 1992, Electrical resistivity tomography of vadose water movement. Water Resour. Res., 28, 1429-1442.
EEA, 1997, European Freshwater Monitoring Network Design. Topic report No 10/1997.
Kim J-H, 2005,. 4-D least-squares inversion of geophysical monitoring data: application to dc resistivity monitoring. Proceedings of the 112th SEGJ Conference Waseda University, Tokyo, Japan May 9-11, 2005 211-214.
LaBrecque, D.J., 1989, Cross-borehole resistivity modeling and model fitting. Ph.D thesis, Univ. Utah, Salt Lake City, UT.
LaBrecque, D. J. and Yang, X., 2001, Difference inversion of ERT data: a fast inversion method for 3-D in situ monitoring. Journal of Environmental and Engineering Geophysics, 5, 83-90.
Loke, M. H., 1999, Time lapse resistivity imaging inversion, Proceedings of the 5th Meeting of the Environmental end Engineering European, Em1, Budapest, Hungary.
Park, S, 1998, Fluid migration in the vadose zone from 3-D inversion of resistivity monitoring data:
Geophysics, 63, no. 1, pp. 41-51.
Ramirez, A., Daily, W., LaBrecque, D., Owen E., and Chesnut, D., 1993, Monitoring an underground steam injection process using electrical resistance tomography. Water Resour. Res., 29, 73-87.
Yi, M.-J., Kim, J.-H., and Chung, S.-H., 2003, Enhancing the resolving power of least-squares inversion with active constraint balancing, Geophysics, 68, 931-941.
0 6 12 18 24 30
Distance (X) -96
-90 -84 -78 -72 -66 -60 -54 -48 -42 -36 -30 -24 -18 -12 -6 0
Depth mbgl
0.3 0.6 0.9 1.2 1.5 1.8 2.1 2.4
Resistivity Log (Ohm-m)
P0 P1
1 0 20 30 40 50 60
AP. RE S/ (Ohm- m) 100
98 96 94 92 90 88 86 84 82 80 78 76 74 72 70 68 66 64 62 60 58 56 54 52 50 48 46 44 42 40 38 36 34 32 30 28 26 24 22 20 18 16
14 P0 - Resistivity (Long)