• 검색 결과가 없습니다.

Determinants of Tax Aggressiveness: Empirical Evidence from Malaysia

N/A
N/A
Protected

Academic year: 2021

Share "Determinants of Tax Aggressiveness: Empirical Evidence from Malaysia"

Copied!
10
0
0

로드 중.... (전체 텍스트 보기)

전체 글

(1)

Print ISSN: 2288-4637 / Online ISSN 2288-4645 doi:10.13106/jafeb.2021.vol8.no5.0179

Determinants of Tax Aggressiveness: Empirical Evidence from Malaysia

Rosmaria JAFFAR

1

, Chek DERASHID

2

, Roshaiza TAHA

3

Received: January 15, 2021 Revised: March 21, 2021 Accepted: April 01, 2021

Abstract

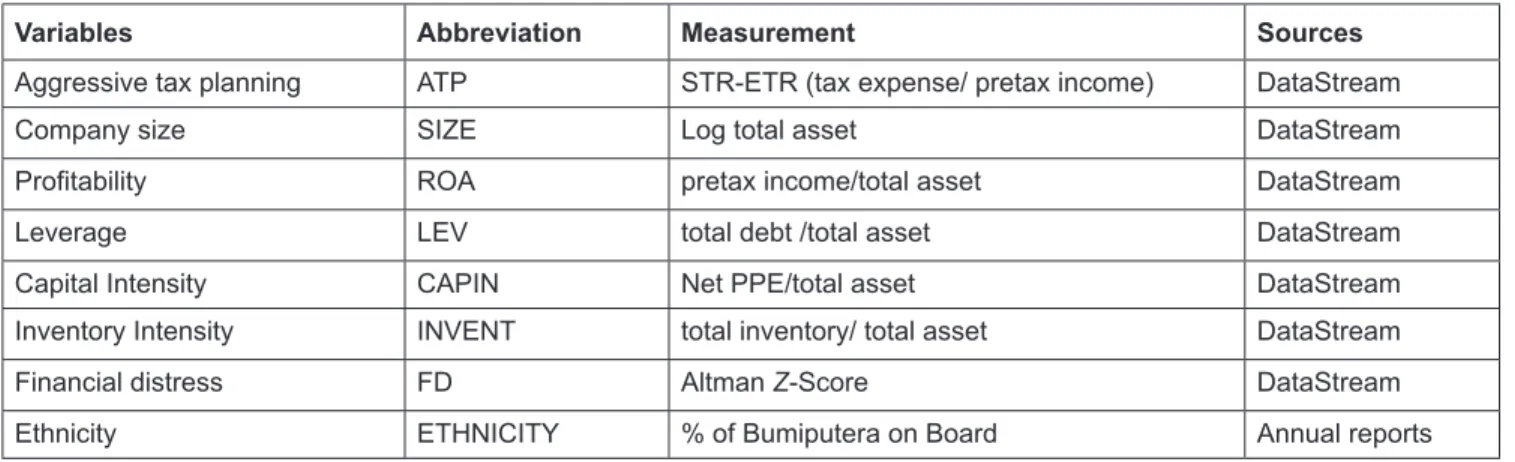
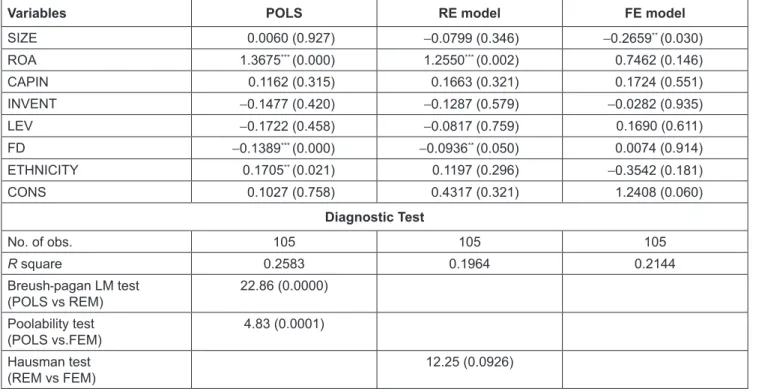
The purpose of this study is to examine the level of aggressive tax planning (ATP) among companies listed in the Access, Certainty, Efficiency (ACE) Market of Bursa Malaysia. On top of that, this study also investigates the relationship between company characteristics, ethnicity, and ATP. This study uses a balanced pooled sample of 105 firm years-observations for the period from 2014 to 2018. These samples were selected to provide new insight into this market and to explore the attitude of small firms toward ATP in Malaysia. The data was retrieved from DataStream and the downloaded annual reports. The finding shows that profitability and financial distress have a significant relationship with ATP. Other variables including size, capital intensity, inventory intensity, leverage, and ethnicity, were not determinants of ATP. The result in this study may assist the reader in understanding the nature of companies in the ACE market, particularly on its behavior toward tax planning. A strict requirement is needed to be adopted in the sample selection process, thus limiting the sample size. Further, since the previous study focused on large companies, the discussion of this paper will provide new insight into the nature of tax planning within the small- and medium-sized companies in Malaysia.

Keywords: Effective Tax Rate, Aggressive Tax Planning, Ethnicity, Financial Distress JEL Classification Code: H25, H26, M41

the past studies used the effective tax rate (ETR) as a proxy to measure tax avoidance, tax evasion, and tax planning as well as tax aggressiveness (James, 2019; Salehi, Khazaei,

& Tarighi, 2019; Vu & Le, 2021; Wahab, Ariff, Marzuki, &

Sanusi, 2017).

The ETR is also commonly used as a measurement to calculate companies’ tax burden and aggressive tax planning (Noor, Mastuki, & Bardai, 2008; Wahab et al., 2017).

Therefore, the ETR can be said to be the most significant measure in determining the level of tax paid by companies (Delgado, Fernández-Rodríguez, & Martínez-Arias, 2018).

The tendency to avoid and not pay taxes becomes greater when companies assume tax as a burden for them, leading them to be involved in ATP because the increase in tax burden will increase the amount of tax paid by the companies (Kwak

& Park, 2020; Sadjiarto, Hartanto, Natalia, & Octaviana, 2020). Therefore, it is crucial to determine the factors influencing the aggressiveness of a company’s tax planning because the company’s decision and strategies will affect its ETR, especially on investment and financing (Fernández- Rodríguez & Martínez-Arias, 2014).

Previous researchers have highlighted various factors that may contribute to ATP (Edwin & Victor, 2019; Higgins, Omer,

& Phillips, 2015; Wahab et al., 2017). One of the factors that may

1

First Author. Lecturer, Faculty of Business and Management, Universiti Sultan Zainal Abidin, Terengganu, Malaysia.

Email: [email protected]

2

Corresponding Author. Associate Professor, Tunku Puteri Intan Safinaz, School of Accountancy, Universiti Utara Malaysia, Kedah, Malaysia [Postal Address: 60100, Sintok, Kedah, Malaysia]

Email: [email protected]

3

Associate Professor, Faculty of Business, Economics and Social Development, Universiti Malaysia Terengganu, Terengganu, Malaysia. Email: [email protected]

© Copyright: The Author(s)

This is an Open Access article distributed under the terms of the Creative Commons Attribution Non-Commercial License (https://creativecommons.org/licenses/by-nc/4.0/) which permits unrestricted non-commercial use, distribution, and reproduction in any medium, provided the original work is properly cited.

1. Introduction

Taxpayers have used various tax planning strategies to

minimize their pre-tax income and reduce their tax burden

(Dhamara & Violita, 2018; Lazăr, 2014). Different terms,

such as tax avoidance (Desai & Dharmapala, 2006), tax

planning (Armstrong, Blouin, & Larcker, 2012), and tax

management (Minnick & Noga, 2010), have been used in the

past research to describe the strategies used to minimize the

tax burden. To determine the level of the tax burden, most of

(2)

influence ATP is the company’s characteristics (Mohanadas, Abdullah, & Pheng, 2018). Studies on the relationship between tax planning and company characteristics are rich and varied where the results can be summarized as being significantly positive, negative, or insignificant (Fernández-Rodríguez &

Martínez-Arias, 2014; Hazir, 2019; Mohanadas et al., 2018;

Noor, Fadzillah, & Mastuki, 2010). The inconsistent results from the previous studies have become one of the motivations for conducting this research.

Further, as a limited number of studies have been devoted to small- and medium-sized companies, this study has focused on companies listed in the Access, Certainty, and Efficiency (ACE) Market. The ACE Market is one of the markets on Bursa Malaysia that serves and provides an opportunity for all small and medium-sized companies in all sectors to raise funds and be listed in the share market.

Previously, the ACE Market was known as the Malaysian Exchange of Securities Commission (MESDAQ) Market.

The ACE Market is similar to the Growth Enterprise Market (GEM) in Hong Kong and Catalyst in Singapore.

Thus, research on this issue remains inconclusive, and further work is needed to fill the gap. Realizing this, the main aim of this study is to identify the relationship between size, profitability, capital intensity, inventory intensity, leverage, financial distress and ethnicity with ATP in small and medium-sized companies. The objective of this study was twofold. The first was to determine the level of tax planning amongst companies listed in the ACE Market. The second was to examine the relationships between firm size, profitability, capital intensity, inventory intensity, leverage, financial distress, and ethnicity with ATP amongst companies listed in the ACE Market.

This study has applied a few theories to support the discussion. The first theory is the agency theory, which relies on the mismatch between the interest of the management and the shareholders (Jensen & Meckling, 1976). In this study, the relationships between profitability, capital intensity, inventory intensity, leverage, and financial distress with ATP have been based on this theory. Second, the political cost theory explains the relationship between firm size and ATP. Larger companies face a higher level of ETR, indicating that larger companies are doing less planning due to public pressure and scrutiny (Watts & Zimmerman, 1986).

Third, the Upper Echelons theory suggests that top-level management’s background influences the organizational outcome (Hambrick & Mason, 1984). In this study, this theory explains the relationship between the ethnicity of the BODs and ATP.

Further discussion in this study is structured as follows.

Section 2 discusses the previous studies based on the variables investigated and develops research hypotheses, and section 3 elaborates on the research methodology. Section 4 discusses the results and section 6 concludes the study.

2. Literature Review

2.1. Aggressive Tax Planning (ATP)

ATP is defined as the downward management of taxable income through tax-planning activities, including legal and illegal activities, and activities that may fall into a grey area (Wahab et al., 2017). This definition is consistent with the previous unifying tax planning framework by Lietz (2013).

The framework covers tax avoidance and the degree of tax aggressiveness by the taxpayers. According to Lietz (2013), tax avoidance includes all aggressive and non- aggressive activities of tax planning. The aggressiveness of tax planning will lead to greyscale activities and, thereby, open an opportunity for tax evasion activities that are illegal. Due to this, ATP is found to maximize the complexity of the organizational structure and minimize transparency in financial reporting (Tee, Gul, Foo, & Teh, 2017). Previous researchers used various measures in determining the tax planning strategies used by companies, such as GAAP ETR, current ETR, cash ETR, and long- run cash ETR, which are calculated based on the estimates on the financial statement (Salihu, Obid, & Annuar, 2013).

This study has utilized the differences between ETR and STR as the measurement of ATP.

2.2. Company Size and Tax Planning

Previous research demonstrates that the tax burden varies

depending on the companies’ size (Wu, Wang, Luo, & Gillis,

2012). The relationship between company size and ETR

has been widely investigated by previous studies, where

again mixed results were reported. For example, a positive

relationship has been reported, which explained that a larger

size would pay a higher tax rate (Delgado, Fernandez-

Rodriguez, & Martinez-Arias, 2014; Kraft, 2014; Noor

et al., 2010). Meanwhile, a negative relationship was reported,

which indicated that a larger company paid a lower tax rate

(Adhikari, Derashid, & Zhang, 2006; Derashid & Zhang,

2003; Hadjidema, Stamatopoulos, & Eleftheriou, 2016); and

an insignificant relationship was reported where there was

no relationship between company size and payment of taxes

(Hussin & Noor, 2012; Liu & Cao, 2007; Stickney & McGee,

1982). The variation in the results between company size

and ETR can be described due to the political cost theory and

political power theory (Fernández-Rodríguez & Martínez-

Arias, 2014; Moreno Rojas, González Rodríguez, & Samper,

2017). The political cost theory suggests that a larger

company will have a higher ETR because larger companies

are more transparent to the government regulatory body

(Wu, Wu, Zhou, & Wu, 2012). Whilst, the political power

theory suggests that larger firms have the political power to

lower their ETR due to the enormous resources they have to

(3)

engage in tax planning activities (Gupta & Newberry, 1997).

From these considerations, this study has proposed that the larger the size, the higher the ETR; therefore, the lower the level of ATP activities. The first hypothesis is formulated as follows:

H1: There is a negative relationship between firm size and ATP.

2.3. Profitability and Tax Planning

There is also no uniformity in the relationship between profitability and ETR. In one cohort of studies, positive relationships were reported (Kim & Im, 2017; Moreno Rojas et al., 2017; and Yinka & Uchenna, 2018), indicating that companies that earn higher profits would have higher ETR.

Theoretically, companies with higher profits will pay more taxes. In another cohort of studies, negative relationships were found, indicating that companies with higher profits have lower ETR (Adhikari et al., 2006; Kraft, 2014; Laguir, Elbaz, & Laguir, 2015; Pratama, 2017). The reason found behind this situation is that companies with higher profits focus more on tax planning and financial management activities (Elbaz, Laguir, & Staglian, 2015; Kraft, 2014).

Based on these arguments, this study has proposed that the higher the profitability, the higher the ETR, therefore, the lower the level of ATP activities. The second hypothesis is formulated as follows:

H2: There is a negative relationship between profitability and ATP.

2.4. Capital Intensity and Tax Planning

Previous studies found mixed results between capital intensity and ETR. The negative results suggest that a company with a large property, plant, and equipment (PPE) will benefit from the deduction of capital allowance, thus lowering the amount of tax expense (Noor et al., 2010, 2008;

Rashid, Noor, & Mastuki, 2015; Yinka & Uchenna, 2018).

It also suggests that companies will benefit from other tax policies rather than just the deduction of capital allowance (Hazir, 2019; Vintilă, Gherghina, & Păunescu, 2018). The positive relationships suggest that companies with higher PPE will have higher ETR. The primary reason for the positive relationships might be the companies’ inability to manage tax deductions related to assets. From this discussion, this study has proposed that the higher the PPE, the lower the ETR; therefore, the higher the level of ATP activities. The third hypothesis is formulated as follows:

H3: There is a positive relationship between capital intensity and ATP.

2.5. Inventory Intensity and Tax Planning

Studies on the relationship between inventory intensity and ETR also found inconsistent results. Some of the studies found positive relationships, which suggest that a company that invests in high levels of inventory will pay higher ETR as no deduction is available for inventory (Hsieh, 2012;

Noor et al., 2010; Ribeiro, Cerqueira, & Brandao, 2015; and Yinka & Uchenna, 2018). A negative relationship between inventory intensity and ETR was also found where the plausible explanation is that companies are unable to manage their resources in profitable investments, thus lowering their profits and consequently leading them to pay lower income tax rates (Hadjidema et al., 2016; Savitri, 2017). Regarding these considerations, this study has proposed that the higher the inventory level, the higher the ETR; therefore, the lower the level of ATP activities. The fourth hypothesis is formulated as follows:

H4: There is a negative relationship between inventory intensity and ATP.

2.6. Leverage and Tax Planning

The companies’ choice of capital structure will also influence the companies’ ETR (Graham, Hanlon, Shevlin, &

Shroff, 2014). Companies that opt for equity financing would not enjoy any tax deductions on their dividend payments as compared to companies that choose debt financing, where interest expenses are tax-deductible (Ribeiro et al., 2015).

In previous literature, there were inconsistent relationships between leverage and ETR. Some studies found positive relationships where a company faces higher leverage, resulting in a higher tax burden (Fernández-Rodríguez

& Martínez-Arias, 2014; Gupta & Newberry, 1997). The negative relationships suggest that companies with higher leverage face lower tax burdens because of deductions on their interest expenses (Hadjidema et al., 2016; Nomura, 2017). Meanwhile, previous studies also found insignificant relationships between leverage and ETR (Minnick & Noga, 2010; Pratama, 2017; Vintilă et al., 2018). Based on the discussions, this study has proposed that the higher the leverage, the lower the ETR; therefore, the higher the level of ATP activities. The fifth hypothesis is formulated as follows:

H5: There is a positive relationship between leverage and ATP.

2.7. Financial Distress and Tax Planning

Companies under financial distress are willing to

be involved in tax planning strategies that manage

to help companies avoid and reduce tax payments

(4)

(Richardson, Taylor, & Lanis, 2015; Tilehnouei, Esfahani,

& Soltanipanah, 2018). The financial distress condition becomes an attractive opportunity for a manager to be involved in risky and costly strategies to reduce taxes (Edwards & Schwab, 2013). This is due to the benefit received having toppled its costs (Richardson et al., 2015).

The financial distress condition also becomes higher during a global financial crisis (Campello, Giambona, Graham, &

Harvey, 2011). Thus, the level of financial distress becomes one factor that influences the companies in avoiding paying taxes (Sadjiarto et al., 2020). Altman (1968) introduced the score for the level of financial distress. A score of 3 and above indicates that companies are in a safe zone. A score of 2.9 to 1.8 indicates that companies are in an unstable condition.

A score below 1.8 indicates that companies are in the red zone or distress area. However, previous studies found mixed results between financial distress and ETR, which included negative relationships and insignificant relationships (Cita & Supadmi, 2019; Dhamara & Violita, 2018; Putri

& Launtania, 2016; Richardson et al., 2015; Tilehnouei et al., 2018). Regarding these considerations, this study has proposed that the higher the financial distress, the lower the ETR; therefore, the higher the level of ATP activities. The sixth hypothesis has been formulated as follows:

H6: There is a positive relationship between financial distress and ATP.

2.8. Ethnicity and Tax Planning

The major ethnic groups in Malaysia were consisting of Bumiputera 69.3% (20,367,100) Chinese 22.8% (6,695,700), and Indian 6.9% (2,01,450) (Malaysian Department of Statistics, 2019). Malays and Chinese have become the major ethnicities and dominate the Malaysian business environment (Ramasamy, Ling, & Ting, 2007). Studies on the relationship between ethnicity and ETR have not been widely investigated as not many countries have such a unique ethnicity like Malaysia. However, some studies have concentrated on culture. For example, Wahab et al. (2017) reported that companies with a higher percentage of Bumiputera boards of directors (a proxy for culture) in companies listed in the Main Market of Bursa Malaysia were involved in fewer ATP activities. Due to the limited study of ATP in small and medium companies, this study has tried to investigate the relationship between ethnicity and ATP in companies listed in the ACE Market. Regarding these considerations, this study has proposed that the higher the percentage of Bumiputera acting as board of directors (BODs), the higher the ETR, therefore, the lower the level of ATP activities. The seventh hypothesis is formulated as follows:

H7: There is a negative relationship between ethnicity and ATP.

3. Research Methodology

3.1. Sample Selection and Data Filtering

This study obtained the data from the Thomson data stream and annual reports of companies listed in the ACE Market from 2014 to 2018. Table 1 presents the statistics of the companies in the ACE Market, which reported negative tax, negative income, and zero income. The table shows that the companies in the ACE Market reported negative incomes with the highest percentage of 47% in 2018 and the lowest at 36% (2017). Further, these companies also reported negative tax expenses with the range between the minimum and maximum percentage of 11% (2017) and 20% (2016), respectively. These negative tax expenses may have been due to tax refunds and deferred tax credits (Noor et al., 2008).

The highest percentage of 10% for companies that declared zero tax was in 2017 while it was 5% in 2018; this might have been due to the aggressive move by the government from the Special Voluntary Disclosure Programme campaign in 2018.

The sample of companies listed in the ACE Market was later filtered with the specific requirement, as shown in Table 2. After the data screening process, the final sample, which excluded the conditions stated in Table 2, comprised 21 companies with 105 observations that were valid for analysis. Data in this study were analyzed using SPSS and STATA software. This study winsorized the observations that fell in the top and bottom 5% of the dependent variables to mitigate the influence of outliers.

3.2. Empirical Model

The model used in this study as shown below was developed based on a prior study by Noor et al. (2008).

The previous model used size, leverage, capital intensity, inventory intensity, foreign operation, and multinational companies for the empirical investigation and focused on companies listed in the Main Market (previously known as the mainboard and second board). For this study, foreign operation and multinational companies were excluded due to the sample companies listed in the ACE Market are considered as small and medium-sized companies, and their Table 1: Percentage of Companies with Negative Tax, Negative Income, and Zero Tax Reported for the Years 2014 to 2018

Year 2014 2015 2016 2017 2018

Firm years 107 109 113 115 119

Negative tax 13% 18% 20% 11% 15%

Negative income 44% 40% 41% 36% 47%

Zero tax 7% 8% 8% 10% 5%

(5)

involvement in multinational activities is also considered low. Nevertheless, we included two new variables, which have not been widely investigated by previous studies, especially in Malaysia, namely ethnicity and financial distress, to determine the relationships with ATP.

ATP

it

= β

0it

+ β

1

SIZE

it

+ β

2

ROA

it

+ β

3

CAPIN

it

+ β

4

INVENT

it

+ β

5

LEV

it

+ β

6

FD

it

+ β

7

ETHNICITY

it

+ e

it

3.3. Variable Measurement

The definition of the variables and the sources of the data are presented in Table 3.

4. Results and Discussion 4.1. Descriptive Analysis

Table 4 presents the descriptive statistics for all the variables used in this study from 2014 to 2018. The table shows the minimum, maximum, mean, and standard deviation for each variable investigated. The mean for ATP

was 3%, which explained that the companies in the ACE Market paid their taxes at 3% lower than the statutory tax rate imposed by the IRBM, which suggests that the companies in the ACE Market are involved in tax planning activities.

Based on the total assets, the smallest company size in this study was 4.3981, and the largest was 5.4860. The mean for the ROA shows that the companies in this sample earned a profit at an average of 9%. In terms of the investment in the PPE and inventory, the means for both variables were 27%

and 9%, respectively. This result indicates two situations.

Firstly, most of the companies in this study made higher investments in PPE compared to the inventory. Secondly, most of the companies in this study might have been from the service sector, which would have limited their investments in inventory. The mean for leverage was 9%, with a minimum value of 0.00 and a maximum value of 0.39. The mean of financial distress was 1.88, which indicated that most of the companies in this sample had unstable financial conditions.

Altman (1968) interpreted companies with scores of 1.8 and below as being in the distress level. The mean ethnicity of 16% indicated that the number of Bumiputera acting as members of the BODs in this sample was lower compared to non-Bumiputera.

Table 2: Sample Excluded from the Study

No Explanation No. of

Companies Sources 1 Companies with incomplete financial data for the five

years under investigation were excluded. 19 (Nomura, 2017; Salihu et al., 2013) 2 Companies with negative pre-tax income (operating

losses) were excluded. 77 (Gupta & Newberry, 1997; Minnick & Noga,

2010; Noor, et al., 2010) 3 Companies such as banks, insurance companies, trust,

and other financial companies were excluded. 2 (Noor et al., 2008; Richardson et al., 2015)

Table 3: Variables and Measurements

Variables Abbreviation Measurement Sources

Aggressive tax planning ATP STR-ETR (tax expense/ pretax income) DataStream

Company size SIZE Log total asset DataStream

Profitability ROA pretax income/total asset DataStream

Leverage LEV total debt /total asset DataStream

Capital Intensity CAPIN Net PPE/total asset DataStream

Inventory Intensity INVENT total inventory/ total asset DataStream

Financial distress FD Altman Z-Score DataStream

Ethnicity ETHNICITY % of Bumiputera on Board Annual reports

(6)

According to Gupta and Newberry (1997), the level of the ETR can be categorized into lower (0% to 10%), moderate (11% to 24%), and high (more than 24%). Concerning the first objective of this study; to determine the level of tax planning amongst companies listed in the ACE Market, Figure 1 presents the taxes paid by companies in the ACE Market. In this study, the companies that paid taxes lower than the STR were considered as practicing ATP. From the result, it was found that 61.90% of the companies in this sample planned their tax aggressively by paying tax rates less than the STR. From this total, 43% paid taxes in the range of 11% to 24%, and the remaining 19% paid taxes less than 10%. 38% of the companies in this study paid taxes more than 24%, indicating that they were involved in lower tax planning activities.

4.2. Regressions Model

The second objective of this study was to examine the factors influencing ATP. This study used the panel data estimation method, which is the combination of time series and cross-sectional data. Thus, in this regression analysis, three analyses have been run to identify the best and appropriate model for this study. The three analyses were the Pool OLS (POLS), the random-effect (REM), and the fixed- effect (FEM) model. In order to choose the best model, the Breusch Pagan LM test was used to test which model was more appropriate between the POLS and REM. The null hypothesis (Ho) indicated that if the P-value was more than 0.05, then the POLS was more appropriate than the REM.

The alternative hypothesis (H1) stated that the REM was Table 4: Descriptive Analysis for the Overall Sample

Variable Minimum Maximum Mean Std. Dev.

ATP -0.3107 0.24 0.0320 0.1534

SIZE 4.3981 5.4860 4.8838 0.2804

ROA 0.0019 0.2741 0.0978 0.0646

CAPIN 0.0089 0.6302 0.2679 0.1592

INVENT 0.0000 0.3736 0.0925 0.1017

LEV 0.0000 0.3865 0.0974 0.1089

FD 0.7304 3.5202 1.8833 0.6419

ETHNICITY 0.0000 0.7778 0.1608 0.2081

Figure 1: Percentage of the ETR Paid by Companies Listed in the ACE Market

(7)

more appropriate than the POLS if the P-value was less than 0.05. From the analysis, the result shows that the P-value was 0.0000, less than 0.05 (Reject Ho); thus, the REM was better than the POLS. The Hausman test was used to determine whether the REM or the FEM was the best model. The null hypothesis (Ho) indicated that if the P-value was more than 0.05, then the REM was more appropriate than the FEM. The alternative hypothesis (H1) stated that the FEM was more appropriate than the REM if the P-value was less than 0.05.

From the analysis, the result shows that the P-value was 0.0926, more than 0.05 (accept Ho; thus, the REM was better than the FEM. Thus, for this study, the best model was REM.

4.3. Regression Result

Table 5 presents the results of the three analyses used in this study. The regression model suggested that the random- effect model was more appropriate than the fixed-effect model for this study. Thus, the discussion of the study was based on the results of the RE model.

The result of the study found that profitability and financial distress have relationships with ATP. From the regression analysis, there is a positive and significant relationship between profitability and ATP, as shown in Table 5 (Beta = 1.2550, P < 0.05). The result indicates that a company with

higher profits will engage in ATP activities to reduce the tax payment. Thus, the result of this study supports the agency theory. Besides that, the result of this study is consistent with a previous study conducted by Adhikari et al. (2006), Elbaz et al. (2015), Kraft (2014) and Pratama (2017).

Meanwhile, the relationship between financial distress and ATP indicates a negative and significant relationship, as shown in Table 5 (Beta = –0.0936, P < 0.05). The result demonstrates that a company that faces higher financial distress is not engaged in ATP, resulting in a hefty tax payment. The situation might be due to the company’s manager wanting to focus more on its performance rather than engaging in ATP to survive in the future (Abd Halim, Adiana, Abdullah, Nisham, & Mohd, 2018).

For other variables investigated in this study, namely size, capital intensity, inventory intensity, leverage, and ethnicity, there were no relationships between these variables with ATP. The result indicates that these variables are not significant factors that influence ATP in the Malaysian ACE Market companies.

5. Conclusion and Recommendations

This study examined the relationships between size, profitability, capital intensity, inventory intensity, leverage,

Table 5: Results of the Regression Model

Variables POLS RE model FE model

SIZE 0.0060 (0.927) -0.0799 (0.346) -0.2659

**

(0.030)

ROA 1.3675

***

(0.000) 1.2550

***

(0.002) 0.7462 (0.146)

CAPIN 0.1162 (0.315) 0.1663 (0.321) 0.1724 (0.551)

INVENT -0.1477 (0.420) -0.1287 (0.579) -0.0282 (0.935)

LEV -0.1722 (0.458) -0.0817 (0.759) 0.1690 (0.611)

FD -0.1389

***

(0.000) -0.0936

**

(0.050) 0.0074 (0.914)

ETHNICITY 0.1705

**

(0.021) 0.1197 (0.296) -0.3542 (0.181)

CONS 0.1027 (0.758) 0.4317 (0.321) 1.2408 (0.060)

Diagnostic Test

No. of obs. 105 105 105

R square 0.2583 0.1964 0.2144

Breush-pagan LM test

(POLS vs REM) 22.86 (0.0000)

Poolability test

(POLS vs.FEM) 4.83 (0.0001)

Hausman test

(REM vs FEM) 12.25 (0.0926)

***, ** and * denote the statistical significance of the coefficients at 0.01, 0.05, and 0.1 levels.

The figure in parentheses shows the probability value.

(8)

financial distress, and ethnicity with ATP. The result shows that profitability and the level of financial distress have significant relationships with ATP. The positive relationship between profitability and ATP indicates that a company in the ACE Market, which earns higher profits, pays a lower tax rate and exercises more planning to reduce the tax burden.

Thus, the result of this study supports the assumption that companies are focusing more on tax strategies to reduce their income tax liabilities but not on income in their financial statement (Kraft, 2014). It can be assumed that companies listed in the ACE Market have proper strategies in managing their tax planning.

The second factor influencing ATP is financial distress where a negative and significant relationship was found between these variables. This relationship indicates that companies in a higher level of financial distress situations are not aggressively planning their taxes, which resulted in higher tax to be paid. Thus, the result of this investigation is not consistent with previous empirical studies which reported that the financial distress level would reduce companies’ tax burdens (Richardson et al., 2015; Tilehnouei et al., 2018).

The negative direction might suggest that managers in these companies are risk-averse and reluctant to involve in risky and costly strategies. Meanwhile, other variables, such as the companies’ size, investments in PPE and inventory, leverage, and ethnicity of the BODs are not determinants of ATP.

Although this study shows some impressive results, it also has several limitations that can be overcome in future research. First, as only the small sample size was used in the analysis the results cannot be generalized to the overall population of companies in Malaysia, specifically to the larger size of firms. Covering both small and larger size of firms in future research may yield a better result on the relationships.

Second, future research can consider other variables that are not included in this study. This study hopes may help the reader to have a deeper understanding of the nature and behaviors of the companies listed in the ACE Market toward tax planning. Besides, the finding of this study is believed may able to provide useful information to the academicians, government officials, and company managers in terms of the reconciliation of ETRs and tax planning.

References

Abd Halim, A., Adiana, N., Abdullah, H., Nisham, K., & Mohd, T.

(2018). Long-run performance of firms emerging from financial distress: Empirical evidence from Malaysia. Economics and Business Letters, 7(1), 47–54. https://doi.org/10.17811/

ebl.7.1.2018.47-54

Adhikari, A., Derashid, C., & Zhang, H. (2006). Public policy, political connections, and effective tax rates: Longitudinal evidence from Malaysia. Journal of Accounting and Public Policy, 25(5), 574–595. https://doi.org/10.1016/j.

jaccpubpol.2006.07.001

Altman, E. I. (1968). Financial ratios, discriminant analysis and the prediction of corporate Bankruptcy. The Journal of Finance, 23(4), 589–609.

Armstrong, C. S., Blouin, J. L., & Larcker, D. F. (2012).

The incentives for tax planning. Journal of Accounting and Economics, 53(1–2), 391–411. https://doi.org/10.1016/

j.jacceco.2011.04.001

Campello, M., Giambona, E., Graham, J. R., & Harvey, C. R.

(2011). Liquidity management and corporate investment during a financial crisis. The Review of Financial Studies, 24(6), 1944–1979. https://doi.org/10.1093/rfs/hhq131

Cita, I. G. A., & Supadmi, N. L. (2019). Pengaruh financial distress dan good corporate governance pada praktik tax avoidance.

E-Journal Akauntansi, 29(3), 912–927. Retrieved from http://

u.lipi.go.id/1352700000

Delgado, F. J., Fernandez-Rodriguez, E., & Martinez-Arias, A.

(2014). Effective tax rates in corporate taxation: A quantile regression for the EU. Engineering Economics, 25(5), 487–496. https://doi.org/10.5755/j01.ee.25.5.4531

Delgado, F. J., Fernández-Rodríguez, E., & Martínez-Arias, A.

(2018). Corporation effective tax rates and company size:

evidence from Germany. Economic Research-Ekonomska Istrazivanja , 31(1), 2081–2099. https://doi.org/10.1080/1331 677X.2018.1543056

Desai, M. A., & Dharmapala, D. (2006). Corporate tax avoidance and high-powered incentives. Journal of Financial Economics, 79(1), 145–179. https://doi.org/10.1016/j.jfineco.2005.02.002 Dhamara, G. P., & Violita, E. S. (2018). The influence of financial

distress and independence of board of commissioners on tax aggressiveness. Advances in Economics, Business and Management Research, 55(Iac 2017), 81–86.

Edwards, A., & Schwab, C. (2013). Financial constraints and the incentive for tax planning. In: American Taxation AssociationMidyear Meeting.

Edwin, O. A., & Victor, O. (2019). Corporate board characteristics and tax aggressiveness: A study of manufacturing firms in Nigeria. Global Journal for Research Analysis, 8(4), 245–251.

Elbaz, J., Laguir, I., & Staglian, R. (2015). Does corporate social responsibility affect corporate tax aggressiveness?

Journal of Cleaner, 107, 662–675. https://doi.org/10.1016/

j.jclepro.2015.05.059

Fernández-Rodríguez, E., & Martínez-Arias, A. (2014).

Determinants of the effective tax rate in the BRIC countries.

Emerging Markets Finance & Trade, 50(March), 214–228.

https://doi.org/10.2753/REE1540-496X5003S313

Graham, J. R., Hanlon, M., Shevlin, T., & Shroff, N. (2014).

Incentives for tax planning and avoidance: Evidence from the field. The Accounting Review, 86(3), 991–1023. https://doi.

org/10.2308/accr-50678

Gupta, S., & Newberry, K. (1997). Determinants of the variability in corporate effective tax rates: Evidence from longitudinal data. Journal of Accounting and Public Policy, 16(1), 1–34.

https://doi.org/10.2753/REE1540-496X5004S4007

(9)

Hadjidema, S., Stamatopoulos, I., & Eleftheriou, K. (2016).

Explaining Corporate Effective Tax Rates Before and During the Financial Crisis: Evidence from Greece. Munich Personal RePEc Archive. Retrieved from https://mpra.ub.uni-muenchen.

de/73787/

Hambrick, D. C., & Mason, P. A. (1984). Upper Echelons: The organization as a reflection of its top managers. Academy of Management Review, 9(2), 193–206.

Hazir, A. (2019). Determinants of effective tax rate in Turkey.

Journal of Research in Business, 4(1), 35–45. https://doi.

org/10.23892/JRB.2019453293

Higgins, D., Omer, T. C., & Phillips, J. D. (2015). The influence of a firm’s business strategy on its tax aggressiveness.

Contemporary Accounting Research, 32(2), 674–702. https://

doi.org/10.1111/1911-3846.12087

Hsieh, Y. (2012). New evidence on determinants of corporate effective tax rates. African Journal of Business Management, 6(3), 1177–1180. https://doi.org/10.5897/AJBM11.1522 Hussin, siti nor adawiyah, & Noor, R. M. (2012). The dual role

of auditor-provided tax services (ATS) in SMEs tax planning.

In: CHUSER 2012–2012 IEEE Colloquium on Humanities, Science and Engineering Research (pp. 351–356). https://doi.

org/10.1109/CHUSER.2012.6504338

James, H. L. (2019). CEO age and tax planning. Review of Financial Economics, 00(June), 1–25. https://doi.org/10.1002/rfe.1072 Jensen, M. C., & Meckling, W. H. (1976). Theory of firm:Managerial

behaviour, agency cost, and ownership structure. Journal of Financial Economics, 3, 305–360.

Kim, J. H., & Im, C. C. (2017). The study on the effect and determinants of small-and medium-sized entities conducting tax avoidance. Journal of Applied Business Research, 33(2), 375–390.

Kraft, A. (2014). What really affects German firms’ effective tax rate? International Journal of Financial Research, 5(3), 1–19.

https://doi.org/10.5430/ijfr.v5n3p1

Kwak, J. W., & Park, M. J. (2020). Effect of auditor’s simultaneous audit and tax services and tax-service fee on firm value:

Korea’s evidence. Journal of Asian Finance, Economics and Business, 7(7), 219–228. https://doi.org/10.13106/jafeb.2020.

vol7.no7.219

Laguir, I., Elbaz, J., & Laguir, L. (2015). Empirical evidence on SMEs’ tax management. Applied Economics Letters, 22(14), 1133–1137. https://doi.org/10.1080/13504851.2015.1008757 Lietz, G. M. (2013). Tax avoidance vs. tax aggressiveness: A

unifying conceptual framework. SSRN Electronic Journal.

https://doi.org/10.2139/ssrn.2363828

Liu, X., & Cao, S. (2007). Determinants of corporate effective tax rates: Evidence from listed companies in China. The Chinese Economy, 40(6), 49–67. https://doi.org/10.2753/CES1097- 1475400603

Malaysian Department of Statistics. (2019). Population and Demographic. Retrieved on June 15, 2020 from: https://www.

dosm.gov.my/

Minnick, K., & Noga, T. (2010). Do corporate governance characteristics influence tax management? Journal of Corporate Finance, 16(5), 703–718. https://doi.org/10.1016/

j.jcorpfin.2010.08.005

Mohanadas, N. D., Abdullah, S., & Pheng, L. K. (2018). The impact of firm characteristics on corporate tax aggressiveness:

A study on Malaysian public listed companies. Advanced Science Letters, 24(4), 2208–2212. https://doi.org/10.1166/

asl.2018.10918

Moreno Rojas, J., González Rodríguez, M. R., & Samper, M. (2017).

Determinants of the effective tax rate in the tourism sector: a dynamic panel data model. Tourism & Management Studies, 13(3), 31–38. https://doi.org/10.18089/tms.2017.13304 Nomura, H. (2017). What determines Japanese corporate effective

tax rates? Evidence from firms listed on the Tokyo stock exchange, (June), 1–18. Retrieved from http://apeaweb.org/

confer/seoul17/papers/Nomura_Hiroyasu.pdf

Noor, R. M., Fadzillah, N. S., & Mastuki, N. (2010). Corporate tax planning: A study on corporate effective tax rates of Malaysian listed companies. International Journal of Trade, Economics and Finance, 1(2), 189–193.

Noor, R. M., Mastuki, N., & Bardai, B. (2008). Corporate Effective Tax Rates: A Study on Malaysian Public Listed Companies.

Malaysian Accounting Review, 7(1), 1–20.

Pratama, A. (2017). Company characteristics , corporate governance and aggressive tax avoidance practice: A study of Indonesian companies. Review of Integrative Business and Economics Research, 6(4), 70–81.

Putri, C. L., & Launtania, M. F. (2016). Effect of capital intensity ratio, inventory intensity ratio, ownership structure and profitability on effective tax rate (Studies on Manufacturing Companies Listed on the Indonesia Stock Exchange 2011–2014). Jurnal Ilmiah Mahasiswa Ekonomi Akuntansi, 1(1), 101–119.

Ramasamy, B., Ling, N. H., & Ting, H. W. (2007). Corporate social performance and ethnicity: A comparison between Malay and Chinese chief executives in Malaysia. International Journal of Cross Cultural Management, 7(29). https://doi.

org/10.1177/1470595807075169

Rashid, N. N., Noor, R. M., & Mastuki, N. A. (2015). Longitudinal study of corporate tax planning: Analysis on companies ’ tax expense and financial ratios. Pertanika Journal of Social Sciences & Humanities, 23(S), 109–120.

Ribeiro, A. I. M., Cerqueira, A., & Brandao, E. (2015). The Determinants of Effective Tax Rates: Firms’ Characteristics and Corporate Governance. FEP Working Papers 567. Retrieved from http://wps.fep.up.pt/wplist.php

Richardson, G., Taylor, G., & Lanis, R. (2015). The impact of financial distress on corporate tax avoidance spanning the global financial crisis: Evidence from Australia.

Economic Modelling, 44, 44–53. https://doi.org/10.1016/j.

econmod.2014.09.015

Sadjiarto, A., Hartanto, S., Natalia, & Octaviana, S. (2020).

Analysis of the effect of business strategy and financial distress

(10)

on tax avoidance. Journal of Economics and Business, 3(1), 238–246. https://doi.org/10.31014/aior.1992.03.01.193 Salehi, M., Khazaei, S., & Tarighi, H. (2019). Tax avoidance

and corporate risk: Evidence from a market facing economic sanction country. The Journal of Asian Finance, Economics and Business, 6(4), 45–52. https://doi.org/10.13106/jafeb.2019.

vol6.no4.45

Salihu, I. A., Obid, S., & Annuar, H. (2013). Measures of corporate tax avoidance: Empirical evidence from an emerging economy.

International Journal of Business and Society, 14(3), 412–427. http://dx.doi.org/10.1108/17506200710779521 Savitri, E. (2017). Determinants of effective tax rate of the top 45

largest listed companies of Indonesia. International Journal of Management Excellence, 9(3), 1183–1188.

Stickney, C. P., & McGee, V. E. (1982). Effective corporate tax rates the effect of size, capital intensity, leverage, and other factors. Journal of Accounting and Public Policy, 1(2), 125–152. https://doi.org/10.1016/S0278-4254(82)80004-5 Tee, C. M., Gul, F. A., Foo, Y., & Teh, C. G. (2017). Institutional

monitoring , political connections and audit fees: Evidence from Malaysian firms. International Journal of Auditing, 21, 164–176. https://doi.org/10.1111/ijau.12086

Tilehnouei, M. H., Esfahani, S. T., & Soltanipanah, S. (2018).

Investigating the effect of financial distress on tax avoidance during the global financial crisis in companies listed on Tehran stock exchange. International Journal of Finance and Managerial Accounting, 3(9), 41–51.

Vintilă, G., Gherghina, Ş. C., & Păunescu, R. A. (2018). Study of effective corporate tax rate and its influential factors: Empirical evidence from emerging European markets. Emerging Markets Finance and Trade, 54(3), 571–590. https://doi.org/10.1080/15 40496X.2017.1418317

Vu, T. A. T., & Le, V. H. (2021). The effect of tax planning on firm value: A case study in Vietnam. Journal of Asian Finance, Economics and Business, 8(2), 973–979. https://doi.

org/10.13106/jafeb.2021.vol8.no2.0973

Wahab, E. A. A., Ariff, A. M., Marzuki, M. M., & Sanusi, Z. M.

(2017). Political connections, corporate governance, and tax aggressiveness in Malaysia. Asian Review of Accounting, 25(3), 424–451. https://doi.org/10.1108/ARA-05-2016-0053

Watts, R., & Zimmerman, J. (1986). Positive Accounting Theory.

Journal of Accountancy. Prentice Hall Incorporation. Retrieved from https://ssrn.com/abstract=928677

Wu, L., Wang, Y., Luo, W., & Gillis, P. (2012). State ownership , tax status and size State ownership , tax status and size effect of effective tax rate in China. Accounting and Business Research, 42(2), 97–114. https://doi.org/10.1080/00014788.2012.628208 Wu, W., Wu, C., Zhou, C., & Wu, J. (2012). Political connections,

tax benefits and firm performance: Evidence from China.

Journal of Accounting and Public Policy, 31(3), 277–300.

https://doi.org/10.1016/j.jaccpubpol.2011.10.005

Yinka, M. S., & Uchenna, C. E. (2018). Firm specific determinants of corporate effective tax rate of listed firms in Nigeria.

Journal of Accounting and Taxation, 10(2), 19–28. https://doi.

org/10.5897/JAT2017.0288

수치

Table 2:  Sample Excluded from the Study
Figure 1:  Percentage of the ETR Paid by Companies Listed in the ACE Market
Table 5 presents the results of the three analyses used in  this study. The regression model suggested that the  random-effect model was more appropriate than the fixed-random-effect  model for this study

참조

관련 문서

The purpose of this study is to examine the relationship between the social support and mental health of university taekwondo athletes, and clearly clas sify

The major purpose of this study is to examine the moderating role of affect intensity, an important individual difference variable, upon affect formation

The purpose of this study is to verify whether The mediating effects of planned happenstance skills on the relationship between perceived social support

Puspose: Puspose: Puspose: Puspose: This study is to identify relations between activity of daily living, social support and loneliness of facilities for

The purpose of this study is to analyze the relationship between dance performances, which is a part of social contribution activities of local governments,

Purpose: The aim of this study is to identify the relationship between knowledge and awareness of radiation department students and their intent in

Low intensity pulsed ultrasound used in this

This study was conducted to recognize the importance of self - management of dance major students and to understand the relationship between the sub -