Measurement of Sound Speed Following the Fluid Temperature Using Acoustic Inspection Device
E. S. Jeon*, W. T. Kim*✝, I. S. Kim** and H. Park*
Abstract In this paper, the fluid AID(acoustic inspection device) was developed to measure SOS(speed of sound) since fluids used in most of industrial fields have different properties and its equipment is highly expensive. From AID developed, it is intended to get potentially the capability to distinguish the kind of fluid using the measurement by the SOS at various fields. In order to measure the sound speed of specific fluids, the measurement system and ultrasonic sensors are composed. The fluid used in the experimental work are soybean oil, glycerin, diesel oil and the error of time difference due to the container wall is extracted for preliminary experiment. As results, the variations of sound speed according to the temperature change of target fluid were analyzed and the polynomial equations were proposed.
Keywords: Sound Speed, Fluid Temperature, Acoustic Inspection, Ultrasonic Sensor, Time Difference, Temperature Compensation
Received: January 28, 2010, Revised: April 26, 2010, Accepted: June 10, 2010, *Div. of Mechanical and Automative Engineering, Kongju National University, 275 Budae-dong, Cheonan, Chungnam 331-717, Korea, **Wess Gloval Inc., 43-5 Jiksan-eup, Cheonan, Chungnam 330-717, Korea, ✝Corresponding Author: [email protected]
Journal of the Korean Society for Nondestructive Testing Vol. 30, No. 3 (2010. 6)
1. Introduction
Typically, field engineers engaged in on-site industrial fields have wanted to know about the status of their various fluids, as example in lubricants, hydraulic oils for actuator, transformer oils, fuel oils, and etc.. using online method.
However, for most cases except specific process exactly up to now, this kind of task was performed under the regular sampling analysis.
Therefore, according to its didactic inspection way, traditional measurement activity is inefficient because of its boring, dangerous, and time consuming work.
Also, in most of industrial field, so many kinds of fluids have been used for equipment maneuvering, product ingredients, cooling, etc.
and they have different properties - sound speed, viscosity, bulk modulus, dielectric constant, etc...
Among these properties, sound speed is usually measured using a simple device and provide its own accurate information for fluid identification, and status changes according to surrounding conditions. Thus, it was needed the development of fluid acoustic inspection device(AID) which can distinguish the kind of fluid by sound speed measurement at the work field. In this work, it is intended for the development of the fluid AID with low price and ease operation (Ji, 2001).
As one of constraints during the development process, sound speed of each fluids are varied with temperature changes. In this work, it was studied to obtain the sound speed of target fluids at on-site as a function of temperature and conduct to verify the results with one of references.
Fig. 1 Schematic of ultrasonic sensor
Table 1 The function of sensor component
Component Function
PZT ceramics
- Main part of ultrasonic sensor - Receiving and transmitting ultrasound Backing
material
- Residual vibration reduction of ultrasonic sensor
Acoustic window
- Impedance matching between measuring medium and piezoelectric ceramics.
- Efficiency decision of ultrasonic sensor
External housing
- Protect sensors from application field environment factor (temperature, pressure, etc.)
Connector - Electric connection between sensor and electronics
(a)
(b)
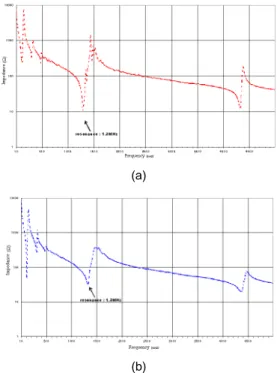
Fig. 2 Impedance properties of ultrasonic sensor;
(a) Impedance of piezoelectric ceramics selected, (b) Impedance of piezoelectric ceramics manufactured
ultrasonic sensors manufactured for this own work and the functional roles of each components are specified in the Table 1.
In this work, the frequency of sensor is selected to 1.3 MHz with consideration of transmitting/receiving capability and NDE(non- destructive testing) ultrasonic sensors. In case of non-destructive evaluations, the operational frequency range of sensors was 500 kHz ~ 20 MHz and the optimal frequency for their specific applications was applied (Schutzmittel, 2001).
Fig. 2 shows the impedance of selected piezoelectric ceramics.
The impedance of ultrasonic sensor manufactured was shown in the Fig. 2. Through
acoustic window, backing material, adhesive), but frequency components were not changed (Tat and Gerpen, 2003; Dang et al., 2002).
3. Experimental Configuration
Fig. 3 shows the photography of experimental apparatus and a schematic diagram of the sound speed measuring system. The experimental systems are consisted of the plastic container filled with target fluid, the sensor mounting jig for sensor fixed to container, the ultrasonic receiving, the function generator to drive the sensors for ultrasonic signal transmitting and transmitter at specific frequency, and the oscilloscope to measure time difference between a transmitter and a receiver.
The container made with acrylic plate has a size of 100 mm outside diameter and 10 mm
Fig. 3 Schematic diagram of SOS measurement
Table 3 SOS of fluids at normal temperature Fluid Sound speed at 20ºC, (m/s)
Diesel oil 1,250
Saybean oil 1,430
Glycerin 1,920
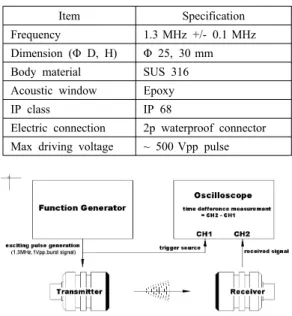
Table 2 Specifications of the ultrasonic sensor
Item Specification
Frequency 1.3 MHz +/- 0.1 MHz
Dimension (Φ D, H) Φ 25, 30 mm
Body material SUS 316
Acoustic window Epoxy
IP class IP 68
Electric connection 2p waterproof connector Max driving voltage ~ 500 Vpp pulse
Fig. 4 Measuring process of SOS
thickness and could be checked easily the existence of vapor or impurities in the sensor attached the external wall, so the accuracy could be improved by adjusting the ultrasonic transmission time difference measurement (Lin et al, 2008). The sensor mounting jig can be easily mounted at the container and the it can accommodate various size containers (70 ~ 110 mm outside diameter). Table 2 shows the specification of the ultrasonic sensor developed in this study (Lin et al, 2001).
Fig. 4 shows the process of time difference measurement and functions of each apparatus.
The transmitter attached at the external wall
generates the ultrasound and the receiver installed at the opposite external wall receives the ultrasound transmitted through the wall and the fluid. The sound speed of fluid is calculated by both measured time difference and known ultrasound transmission path length.
4. Results and Discussions
4.1 Formulation of Time Difference
Table 3 shows the sound speed at normal temperature of 20 ℃ for each fluid used in the experiment. At first, it was determined the time effects of the container and the water was filled the container and measured time differences at various temperatures. The reason for choosing water as first trial liquid was that the sound speed variation of water is commonly known.
During experiment, the temperature of fluids was heated at desired temperature and measured the time difference induced by the container walls and water path at various temperatures. After experiments, the theoretical time difference of water was subtracted from measured ones and the temperature for the time difference of container wall. through eqns. (1) and (2) was
where TDmeasurd(t) is the measured time difference of integrated system for container and water, TDtheory(t) is theoretical time difference of water, and TDcontainer(t) is the time difference induced by container walls, respectively.
TDmeasured(t) = [2·tcontainer/ Vcontainer(t)] + IDcontainer/Vtheory water(t) (2) where 2·tcontainer/Vcontainer(t)=TDcontainer(t), IDcontainer is a inner diameter of container, Vtheory_water(t) is the theoretical sound speed of water at various temperature, and tcontainer is the container wall thickness, respectively.
The sound speed of target liquids can be calculated by compensation of container wall effect as eqns. (3) and (4).
TDtarget fluid(t) = TDmeasured(t) - Tcontainer(t) (3) Vtarget fluid(t) = IDcontainer/TDtarget fluid (4) where TDtarget fluid(t) is the calculated time difference of target fluids and Vtarget fluid(t) is the calculated sound speed of target fluids.
4.2 Compensations and Discussions
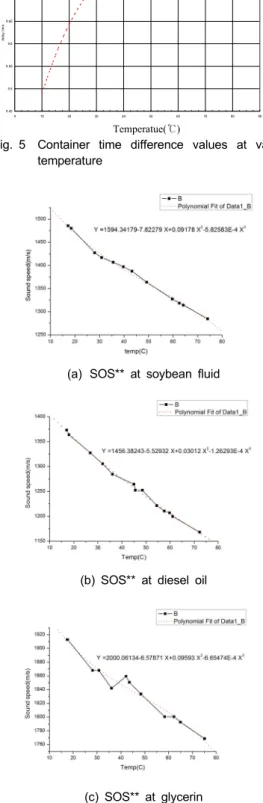
Fig. 5 shows the container time difference compensation values at various temperature. The eqn. (5) represents estimated polynomial equation of container time difference as a function of temperature.
Y(t) = 9.2562 + 0.02758·t - 4.5711E-4·t2+
2.65651E-6·t3 (5)
where t is the experimental temperature at 0 ℃ and, as Y(t) is the container time difference, it means the time delay(μs). After obtained compensation factor, more experiments for verifications were conducted. The selected fluids were soybean oil, diesel oil and glycerin. Fig. 6
9.45 9.5 9.55 9.6 9.65 9.7
0 10 20 30 40 50 60 70 80 90
temperature
delay time
dt(ms)
Temperatue(℃)
Fig. 5 Container time difference values at various temperature
(a) SOS** at soybean fluid
(b) SOS** at diesel oil
(c) SOS** at glycerin
Fig. 6 Sound speed of each fluid at 20 ℃
Table 4 Deviation between the general SOS and the calculated ones
Liquid SOS*
(m/s)
SOS**
(m/s)
Deviation (%)
Diesel oil 1,250 1,356.8 8.5
Soybean oil 1,430 1,469.9 2.8
Glycerin 1,920 1,901.5 1
Fig. 7 Container time difference values at various temperature
shows the experimental results and Table 4 shows the deviation between SOS known previously and measured ones in this research, where SOS*(m/s is the sound speed known previously at 20 ℃ and SOS** (m/s) is the sound speed calculated at 20 ℃ from this research. During experiments, it was delicate the exactness of our result because the sound speed of materials becomes fast with increasing temperature. But at final stage, it was found that test results were reliable. From reference of (Benedetto et al., 2003), there was a experimental result performed at similar experiment with Biodiesel oil. From the comparison between results of Fig. 6(b) and Fig.
7, it was found that the experimental measurement data were verified as correct like shown in Fig. 7.
5. Conclusion
In this work, the sound speed measuring system was devised and the measurements of sound speed of the target fluids following the temperature change were conducted.
1) As results, the polynomial equations were extracted as experimental results.
2) Compensations provided some unique important informations for various fluid identifications.
3) Complementary of experimental apparatus and more detail measuring points were included includ\ing more accurate results as expected.
4) It was confirmed that SOS was related to not only temperature but also pressure.
References
Benedetto, G., Gavioso, R. M., Giuliano Albo, P. A., Lago, S., Madonna Ripa, D. and Spagnolo, R. (2003) Speed of Sound of Pure Water at Temperatures between 274 and 394 K and Pressures up to 90 MPa, Proceeding of the Fifteenth Symposium on Thermophysical Properties, pp. 1408-1414
Dang, C., Lester, W. and Schmerr, Jr. (2002) Complete Modeling of an Ultrasonic NDE Measurement System - An Electroacoustic Measurement Method, Journal of the Korean Society for Nondestructive Testing, Vol. 21, No.
1, pp. 1-21
Ji, H. M., (2001) Industrial Present Condition of Ultrasonic Oil Gauge (Japanese), Sin-inTechnopia, pp. 107-145
Lin, J. F., Liao, T. T. and Chang, C. C. (2008), Measurement of the Concentration of Glucose by a Circular Polariscope with Electro-Optic Modulation, Advanced Nondestructive Evaluation (ANDE), Vol. 1, pp. 1285-1290
Schutzmittel, H. V., (2001) Property Measurement Apparatus, Sonotec, pp. 21-47
Tat, M. E. and Van Gerpen, J. H. (2003) Measurement of Biodiesel Speed of Sound and Its Impact on Injection Timing, NREL/SR-510-31462, pp. 289-297