J. Kor. Soc. Fish. Tech., 45(1), 22 33, 2009 DOI:10.3796/KSFT.2008.45.1.022
An ecological risk assessment for the effect of the Korean tuna longline fishery in the Western and Central Pacific Ocean
Youjung KWON1,2, Doo-Hae AN2*, Dae Yeon MOON2, Seon Jae HWANG2and Jae Bong LEE3
1Department of Fisheries Physics, Graduate School, Pukyong National University, Busan, 608-737, Korea
2Distant Water Fisheries Resources Division, National Fisheries Research and Development Institute, Busan, 619-902, Korea
3Fisheries Resources Research Division, National Fisheries Research and Development Institute, Busan, 619-902, Korea
Ecological risk assessment(ERA), developed in Australia, can be used to estimate the risk of target, bycatch and protected species from the effects of fishing using limited data for stock assessment. In this study, we employed the ERA approach to estimate risks to tunas, billfishes, sharks, sea turtles and other species by the Korean tuna longline fishery in the Western and Central Pacific Ocean using productivity and susceptibility analyses of the ERA based on low(<1.30), medium(1.30-1.84) and high risk(>1.84). Albacore, bigeye, yellowfin, skipjack and bluefin tunas were generally evaluated in the medium risk. The susceptibility of tuna species, however, had higher risks than the productivity. Billfishes were also at medium risk, while sharks were at high risk by the tuna longline fishery. The risk of productivity was generally high, because most sharks caught by the tuna longline fishery have high longevities, i.e., over 10 years, including ovoviviparous species. Susceptibility, which is related with the selection of fishing gear, was also high, because the longline fishery has no gear modifications to prevent bycatch of protected species. Not only target tuna species were influenced by the tuna longline fishery in the Western and Central Pacific Ocean, but also non- target species, such as pomfret, mackerels rays, sea turtle were done. Ecosystem-based fishery assessment
*Corresponding author: [email protected], Tel: 82-51-720-2320, Fax: 82-51-720-2337
.
.
(Gilman et al., 2008 ; Yokota et al., 2006).
FAO (biodiversity)
(precautionary approach) (FAO, 2007a).
, ,
.
(ecosystem- based fisheries management, EBFM)
(Kirby, 2006).
, ,
,
(Pikkitch et al., 2004).
(ecological risk assessment, ERA)
, (repro-
ductive rate)
(Kirby and Moloney, 2007).
(management strategy evaluation)
(Smith et
al., 2007), (Western and
Central Pacific Fisheries Commission, WCPFC) 2006
(Kirby, 2006).
20
(Thunnus obesus)
90% , 10%
(Moon et al., 2007).
,
.
Fig. 1 2005 7 15
2008 2 29
7 355
.
tools, such as productivity and susceptibility analysis(PSA), have the ability to provide broad scientific advice to the policy makers and stakeholders.
Key words : Ecological risk assessment, Bycatch, Longline fishery, Pacific Ocean
(ecological risk assessment, ERA)
(quantitative stock assessment)
(semi-quantitative analysis)
(productivity and susceptibility analysis, PSA) (Stobutzki et al., 2001, Smith et al., 2007). PSA
(1) .
dB B
____ rB(1 __) qEB (1)
dt K
B , r
, K , q , E
. PSA
(1)
(r) ,
(2) (q)
.
ERA 47
Table 1 , , ,
5
. (Thunnus
obesus), (Thunnus alalunga) 5 , (Xiphias gladius),
(Makaira mazara) 6 , 12 ,
3 , 21
.
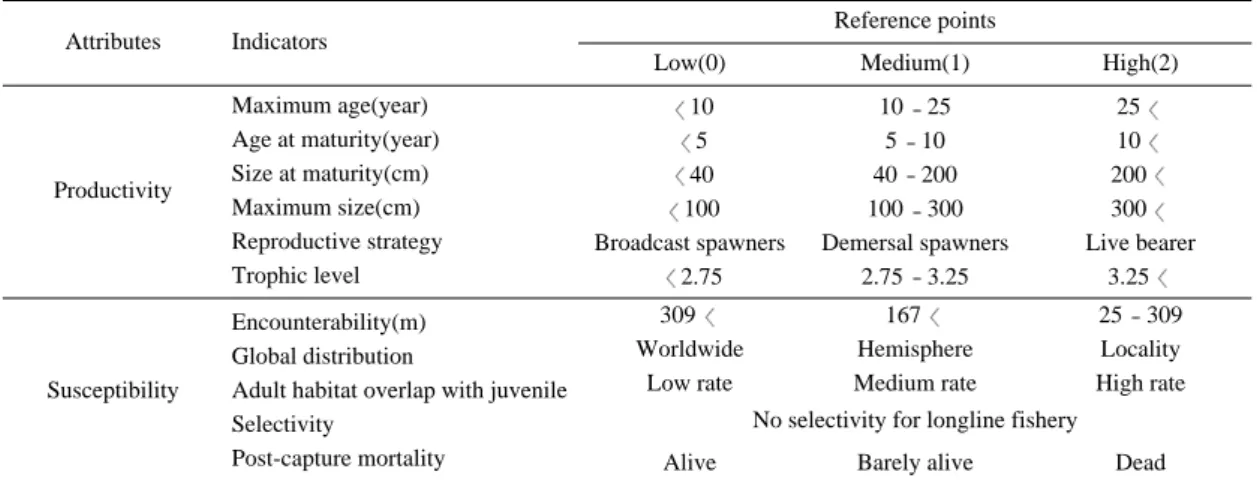
ERA Table 2
(indicators) (reference points) (Stobutzki et al., 2001). PSA
,
FishBase(http:// www.fishbase.net) .
, ,
(encounterability),
, .
, Fig. 2
7
.
, 309m
100%
(2) , 309m
0%
(0) .
.
(family) , Fig. 1. Survey areas of the Korean tuna longline fisheries
by the Korean scientific observers during 2005-2008 in the Western and Central Pacific Ocean.
N 60 40 20 0 20 40 60 S
E 100 120 140 160 180 160 140 120 100 80 W Western and Central
Pacific Ocean
Eastern Pacific Ocean
Table 1. Species composition of species caught by the Korean tuna longline fisheries during 2005-2008 in the Western and Central Pacific Ocean
Group English name Scientific name
Tunas (5)
Billfishes (6)
Turtles (3)
Other species
(21) Sharks
(12)
Bigeye tuna Albacore Yellowfin tuna Skipjack tuna Bluefin tuna Swordfish Blue marlin Striped marlin Indo-Pacific sailfish Shortbill spearfish Black marlin Blue shark Mako shark Bigeye thresher shark Oceanic whitetip shark Salmon shark
Smooth hammerhead shark Scalloped hammerhead shark Crocodile shark
Silky shark Galapagos shark Grey reef shark Dogfish shark Green sea turtle Loggerhead sea turtle Olive ridley sea turtle Escolar
Opah Sickle pomfret Oilfish Wahoo Lancetfish
Shortnose Lancetfish Dolphinfish Sharptail mola Pelagic stingray Crested oarfish Snake mackerel Black pomfret Manta ray Ocean sunfish Great barracuda Razorback scabbardfish Slender sunfish Rainbow runner Suck fish Flyingfish
Thunnus obesus Thunnus alalunga Thunnus albacares Katsuwonus pelamis Thunnus thynnus Xiphias gladius Makaira mazara Tetrapturus audax Istiophorus platypterus Tetrapturus angustirostris Makaira indica
Prionace glauca Isurus oxyrinchus Alopias superciliosus Carcharhinus longimanus Lamna ditropis
Sphyrna zygaena Sphyrna lewini
Pseudocarcharias kamoharai Carcharhinus falciformis Carcharhinus galapagensis Carcharhinus amblyrhynchos Isistius brasiliensis
Chelonia mydas Caretta caretta Lepidochelys olivacea Lepidocybium flavobrunneum Lampris guttatus
Taractichthys steindachneri Ruvettus pretiosus Acanthocybium solandri Alepisaurus ferox Alepisaurus brevirostris Coryphaena hippurus Masturus lanceolatus Dasyatis violacea Lophotus lacepede Gempylus serpens Taractes rubescens Mobula japanica Mola mola
Sphyraena barracuda Assurger anzac Ranzania laevis Elagatis bipinnulata Remora remora Prognichthys gibbifrons
.
Fig. 3 ,
(attribute) . Fig. 3(a)
.
FishBase ,
2005 2008
. Fig. 3(b)
, ( 1.30),
Table 2. Attributes, indicators and reference points for ecological risk assessment Attributes
Productivity
Susceptibility
Indicators Maximum age(year) Age at maturity(year) Size at maturity(cm) Maximum size(cm) Reproductive strategy Trophic level Encounterability(m) Global distribution
Adult habitat overlap with juvenile Selectivity
Post-capture mortality
Reference points
Low(0) Medium(1) High(2)
10 5 40 100 Broadcast spawners
2.75
10 25 5 10 40 200 100 300 Demersal spawners
2.75 3.25
25 10 200 300 Live bearer
3.25 309
Worldwide Low rate
167 Hemisphere Medium rate
25 309 Locality High rate No selectivity for longline fishery
Alive Barely alive Dead
Fig. 2. An example of indicators for ecological risk assessment. This example shows the overlap with fishing effort by is the Korean tuna longline fisheries during 2005-2008 in the Western and Central Pacific Ocean.
Sea surface
Sp.
A Sp.
B Sp.
C 25m
309m
0m 25m
167m
309m
bottom Maximum hook depth
Reference
point (Species A: High risk(2), 100%
Species B: Medium risk(1), 50%
Species C: Low risk(0), 0%
Fig. 3. Plots between (a) indicators and (b) attributes. Indicators are length at maturity and captured mean length of species, and Attributes are productivity and susceptibility of species caught by the Korean tuna longline fisheries during 2005-2008 in the Western and Central Pacific Ocean.
(a)
High risk
High risk
Low risk
Low risk
Medium risk (b)
Attribute 2
Indicator 2
Attribute 1 Indicator 1
(1.30 1.84), (1.84 ) .
(2) .
Di Pi 2 Si
2 (2)
, Di , Pi i
, Si i .
,
.
Fig. 4 5 , 5 ,
11 12
Fig. 4. Plot between indicators of species caught by the Korean tuna longline fisheries during 2005-2008 in the Western and Central Pacific Ocean.
300
200
100
0
300
200
100
00 100 200 300 100 200 300
0 100 200 300 100 200 300
Lenght at maturity(cm)
Captured mean length(cm)
(a) tunas (b) billfishes
(d) other species (c) sharks
.
. Fig.
4(a)
, (Thunnus thynnus)
, (Katsu-
Table 3. Risk score of productivity and susceptibility and distance of species caught by the Korean tuna longline fisheries during 2005-2008 in the Western and Central Pacific Ocean
Productivity risk score Susceptibility risk score 0.857
0.714 0.714 0.714 1.143 1.167 1.286 1.000 1.000 1.000 1.143 1.714 2.000 1.857 1.714 2.000 2.000 1.857 1.667 1.857 1.857 1.714 2.000 1.000 1.000 0.667 0.833 1.333 0.600 1.000 0.714 1.500 1.250 0.429 1.000 1.500 0.500 0.667 0.800 1.833 1.000 1.000 1.333 1.000 0.750 0.600 0.333
1.000 1.000 1.000 0.750 1.250 1.000 1.250 1.250 1.250 1.000 1.000 1.250 1.750 1.250 1.750 1.250 1.500 1.750 1.250 1.500 2.000 1.500 1.000 0.750 0.750 1.200 1.000 1.000 0.750 1.500 1.500 1.000 0.750 1.500 1.500 1.667 1.333 1.000 0.750 1.250 1.000 1.750 1.000 1.250 1.500 1.500 2.000
Distance 1.317 1.229 1.229 1.036 1.694 1.537 1.793 1.601 1.601 1.414 1.519 2.122 2.658 2.239 2.450 2.358 2.500 2.552 2.083 2.387 2.729 2.278 2.236 1.250 1.250 1.373 1.302 1.667 0.960 1.803 1.661 1.803 1.458 1.560 1.803 2.242 1.424 1.202 1.097 2.219 1.414 2.016 1.667 1.601 1.677 1.616 2.028 Species
Thunnus obesus Thunnus alalunga Thunnus albacares Katsuwonus pelamis Thunnus thynnus Xiphias gladius Makaira mazara Tetrapturus audax Istiophorus platypterus Tetrapturus angustirostris Makaira indica
Prionace glauca Isurus oxyrinchus Alopias superciliosus Carcharhinus longimanus Lamna ditropis
Sphyrna zygaena Sphyrna lewini
Pseudocarcharias kamoharai Carcharhinus falciformis Carcharhinus galapagensis Carcharhinus amblyrhynchos Isistius brasiliensis
Chelonia mydas Caretta caretta Lepidochelys olivacea Lepidocybium flavobrunneum Lampris guttatus
Taractichthys steindachneri Ruvettus pretiosus Acanthocybium solandri Alepisaurus ferox Alepisaurus brevirostris Coryphaena hippurus Masturus lanceolatus Pteroplatytrygon violacea Lophotus lacepede Gempylus serpens Taractes rubescens Mobula japanica Mola mola
Sphyraena barracuda Assurger anzac Ranzania laevis Elagatis bipinnulata Remora remora Prognichthys gibbifrons Group
Tunas
Billfishes
Sharks
Turtles
Other species
wonus pelamis)
. Fig. 4(b)
, (Istiophorus platypterus)
.
,
(Makaira indica) .
Fig. 4(c) (Isistius brasiliensis) 11
, , ,
(Carcharhinus amblyrhynchos) 5
, 6
. Fig. 4(d)
(Mobula japanica) (Ranzania
laevis) ,
10 .
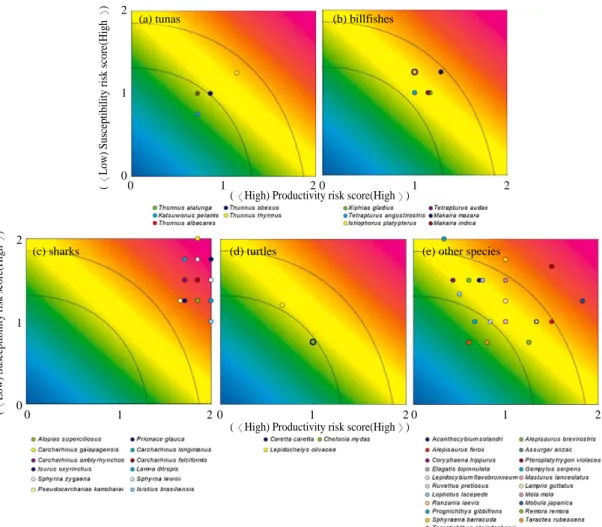
Fig. 5 Table 3 ,
,
Fig. 5. Plot between productivity and susceptibility analysis of species caught by the Korean tuna longline fisheries during 2005-2008 in the Western and Central Pacific Ocean.
(a) tunas 2
1
00 1 2 0 1 2
0 1 2 0 1 2 0 1 2
(Low) Susceptibility risk score(High)
( High) Productivity risk score(High )
( High) Productivity risk score(High )
(Low) Susceptibility risk score(High)
2
1
0
(c) sharks (d) turtles (e) other species
(b) billfishes
,
. Fig. 5(a)
(D) 1.694
, 1.317
. 1.229
, 1.036
. Fig. 5(b)
, 1.793 .
, (Tetrapturus angustirostris)
1.414 .
Fig. 5(c)
,
. (Carcharhinus
galapagensis) 2.729
,
, , ,
. Fig. 5(d)
(Caretta caretta) 1.250 , (Lepidochelys olivacea) 1.373
. Fig. 5(e)
0.960 2.242
, (Taractichthys steindachneri)
, (Dasyatis violacea)
.
56.8% , 43.2%
. 20
90%
, ,
(Moon et al., 2007).
,
(Stobutzki et al., 2001).
,
.
.
(FAO,
2007c), , 1960
(Ichinokawa et al., 2007).
, 1960
2 . 1960
3 (FAO, 2007b).
(Katsuwonus pelamis)
. (Thunnus thynnus)
(Thunnus obesus)
.
(Thunnus albacares) (Thunnus alalunga)
,
.
(25 309m)
(FAO, 1993). , ,
(Langley et al., 2008; Langley et al., 2007; Hoyle et al., 2008).
(Langley and Hampton, 2008).
.
(Xiphias gladius) ,
.
,
(Kolody et al., 2008).
(Makaira mazara)
,
(BMSY)
(Kleiber et al., 2003).
11 (Prionace glauca), (Isu- rus oxyrinchus), (Sphyrna lewini),
(Pseudocarcharias kamoharai), (Carcharhinus amblyrhynchos) 5
6
. ,
. 10
,
.
.
90%
(Western and Central Pacific Fisheries
Commission, WCPFC) 2008
,
, (Carcharhinus
longimanus), (Alopias superciliosus) , 4
(WCPFC, 2008).
4
,
, (Carcharhinus gala-
pagensis), , (Sphyrna zygaena) .
,
.
WCPFC 4
, ,
,
.
,
.
. 2005 2008
7
. ,
, .
.
, ,
4 ,
.
(RP 2009 FR 003),
.
FAO(Food and Agriculture Organization of the United Nations), 2007a. Report of the expert consultation on international guidelines for the management of deep-sea fisheries in the high seas, pp. 48.
FAO, 2007b. Capture production 2005. FAO Yearbook of Fishery Statistics Vol.100/1, pp. 539.
FAO, 2007c. Methodological Workshop on the Management of Tuna Fishing Capacity. Stock status, data envelopment analysis, industry surveys and management options. FAO Fisheries Proceedings P8, pp. 218.
FAO, 1993. Interactions of Pacific tuna fisheries. Volume 2 Papers on biology and fisheries. FAO Fisheries Technical Paper 336/2. pp. 439.
Gilman, E., S. Clarke, N. Brothers, J. Alfaro-Shigueto, J.
Mandelman, J. Mangel, S. Petersen, S. Piovano, N.
Thomson, P. Dalzell, M. Donson, M. Goren and T.
Werner, 2008. Shark interactions in pelagic longline fisheries. Mar. Pol, 32, 1 18.
Hoyle1, S., A. Langley, and J. Hampton, 2008. Stock assessment of albacore tuna in the South Pacific Ocean. WCPFC-SC4-2008/SA-WP-8. 4th Regular
Session of the WCPFC Scientific Committee, Port Moresby, pp. 126.
Ichinokawa, M., M. Kai, Y. Takeuchi and R. Conser, 2007. Brief review of the methods for the future projections of Pacific bluefin tuna stock assessment.
ISC/07/PBFWG-3/21, pp. 29.
Kirby, D.S., 2006. An ecological risk assessment for species caught in WCPO longline and purse seine fisheries. Working Paper EB-WP1, 2nd Regular Session of the WCPFC Scientific Committee, Manila, pp. 25.
Kirby, D.S., B. Moloney, 2007. An ecological risk assessment(ERA) for the effects of fishing in the Western & Central Pacific Ocean: research planning workshop report and draft research plan. Working Paper EB-WP3, 3rd Regular Session of the WCPFC Scientific Committee, Honolulu, pp. 31.
Kleiber, P., M.G. Hinton and Y. Uozumi, 2003. Stock assessment of blue marlin (Makaira nigricans) in the Pacific using MULTIFAN-CL. Marine and Freshwater Research. 54(4), 349 360.
Kolody, D., R. Campbell and N. Davies, 2008. A MULTIFAN-CL stock assessment of South-West Pacific swordfish 1952-2007. WCPFC-SC4-2008 /SA-WP-6. 4th Regular Session of the WCPFC Scientific Committee, Port Moresby, pp. 90.
Langley, A. and J. Hampton, 2008. Stock assessment of skipjack tuna in the western and Central Pacific Ocean. WCPFC-SC4-2008/SA-WP-4. 4th Regular Session of the WCPFC Scientific Committee, Port Moresby, pp. 74.
Langley, A., J. Hampton, K. Pierre and S. Hoyle, 2008.
Stock assessment of bigeye tuna in the Western and Central Pacific Ocean, including an anlaysis of management options. WCPFC-SC4-2008/SA-WP-1.
4th Regular Session of the WCPFC Scientific Committee, Port Moresby, pp. 137.
Langley, A., J. Hampton, P. Kleiber and S. Hoyle, 2007.
Stock assessment of yellowfin tuna in the western and central Pacific Ocean, including an analysis of management options. WCPFC-SC3-SA SWG/WP- 01. 3rd Regular Session of the WCPFC Scientific Committee, Honolulu, pp. 120.
Moon, D.Y., S.J. Hwang, D.H. An and S.S. Kim, 2007.
Bycatch of sharks in Korean tuna longline fishery. J.
Kor. Soc. Fish. Tech., 43(4), 392 338.
Pikkitch, E.K., C. Santora, E.A. Babcock, A. Bakun, R.
Bonfil, D.O. Conover, P. Dayton, 2004. Ecosystem based fishery management. Science, 305, 346 347.
Smith, A.D.M., E.J. Fulton, A.J. Hobday, D.C. Smith and P. Shoulder, 2007. Scientific tools to support the practical implementation of ecosystem-based fisheries management. ICES J. Mar. Sci., 64, 633 639.
Stobutzki, I., M. Miller and D. Brewer, 2001.
Sustainability of fishery bycatch: a process for assessing highly diverse and numerous bycatch.
Environmental Conservation, 28(2), 167 181.
WCPFC(Western and Central Pacific Fisheries Commission), 2008. Executive summary. Commission for the Conservation and Management of highly migratory fish stocks in the Western and Central Pacific Ocean. Scientific committee fourth regular session. 11 22, Aug., 2008, pp. 266.
Yokota, K., M. Kiyota and H. Minami, 2006. Shark catch in a pelagic longline fishery: Comparison of circle and tuna hooks. Fish. Res., 81, 337 341.
2009 2 5
2009 2 12 1
2009 2 12