Journal of the Korean Society for Power System Engineering http://dx.doi.org/10.9726/kspse.2016.20.3.029 Vol. 20, No. 3, pp. 29-35, June 2016
크랭크스로 단조강의 피로수명의 확률분포 추정
Estimation of Probability Distribution of Fatigue Lives in Crank Throw Forged Steel
김선진*․안석환**†
Seon-Jin Kim* and Seok-Hwan Ahn**†
(Received 23 February 2016, Revision received 16 May 2016, Accepted 18 May 2016)
Abstract: Because of the severe service environment of the large marine vessel, the fatigue strength and its evaluation play an important role in design and maintenance of marine crankshaft. The aim of this work is to investigate the probability distribution of fatigue lives in crank throw forged steel and to develop the methodology for estimation of the probabilistic design fatigue strength. Detailed studies were performed on the constant amplitude axial loading fatigue test. The experiments were controlled by stress ratio of –1 and 15Hz frequency for each stress level. The considerable variability of fatigue life was observed in each stress level under rigidly controlled constant fatigue testing conditions. The fatigue life of crank throw forged steel was well followed the log-normal and Weibull distribution. In addition, it can be used for the estimation of probabilistic design fatigue strength by using the proposed methodology.
Key Words:Crank Throw, Fatigue Life, Variability, Weibull Distribution, Design Fatigue Strength
**†안석환(교신저자) : 중원대학교 메카트로닉스학과 E-mail : [email protected], Tel : 043-830-8942
*김선진 : 부경대학교 기계설계공학과
**†Seok-Hwan Ahn(corresponding author) : Department of Mechatronics, Jungwon University.
E-mail : [email protected], Tel : 043-830-8942
*Seon-Jin Kim : Department of Mechanical Design Engineering, Pukyong National University.
1. 서 론
금속재료의 피로수명은 시험편의 형상, 치수 및 피로시험 조건 등을 일정으로 하여 엄격히 제어 한 실험에 있어서도 일반적으로 상당한 산포를 나타내고, 특히 피로한도 부근의 장수명 영역에서 이 경향이 크다고 하는 것이 널리 알려져 있다.
1,2)일반적으로 피로실험 특히 응력-수명(S-N) 데이 터는 엄격히 제어된 동일 조건의 실험하에서도 상당히 큰 산포를 나타내고 있다.
3)비록 잘 알려 진 S-N 곡선은 재료의 피로 성질을 나타낼 수 있 지만, 그것으로부터 피로수명의 산포를 이해할 수
는 없다. 지난 수십 년 동안 S-N 데이터의 산포에 대한 많은 연구가 수행되었다.
2-7)피로 성질의 산 포는 통상 피로수명 혹은 피로강도의 확률분포에 의하여 표현된다. 이러한 피로수명 혹은 피로강도 의 산포는 통상 대수정규분포 혹은 와이블분포로 가정하여 그 통계적 성질을 평가하는 것이 일반 적이다.
1,2,8,9,14,15)기계설계의 중요성 때문에 피로강도에 관한 연
구가 개발되어 왔다. 피로강도를 추정하는 방법의
하나로 Staircase 법
10)이 널리 사용되어 왔다. 저자
등도 본 방법에 의하여 대형 박용 엔진 크랭크스
로 부품에 대하여 제품의 신뢰성을 확보하기 위
하여 피로강도의 신뢰도를 추정한 바 있다.
11)대형 박용 엔진의 경우 크랭크스로는 주로 단 조에 의하여 만들어지고 있다. S34MnV강은 박용 디젤 엔진의 크랭크샤프트 제조에 기본적인 소재 로 폭넓게 사용되고 있다. 박용 엔진의 크랭크샤 프트는 중소형 엔진의 경우 일체형으로 제작이 가능하나, 대형 엔진의 경우는 치수 및 중량과 설 비 조건 등으로 인해 크랭크샤프트를 구성하는 저널, 웹, 핀, 플랜지 등을 각기 따로 제작하여 조 립하게 된다. 최근 선박의 대형화로 인하여 높은 출력을 요구하게 되고 또한 저속 엔진의 기술적 추세는 보다 높은 강도와 높은 신뢰성을 확보하 기 위하여 조립형 크랭크샤프트를 필요로 하고 있다. 일반적으로 크랭크샤프트의 웹부와 핀부가 일체형으로 된 것을 크랭크스로라 부른다.
12)본 연구에서는 S34MnV강으로 제작된 크랭크스 로의 단조강에 대하여 동일 응력 레벨에서 다수 의 완전 양진 축하중 일정 진폭 피로실험을 수행 하여 각각의 응력 레벨에서의 피로수명의 통계적 성질과 그 확률분포를 추정하였다. 또한 이들의 확률분포를 활용하여 확률론적으로 설계피로강도 를 결정하는 방법에 대하여 고찰하였다.
2. 실험방법 및 절차
본 연구의 실험에 사용된 크랭크스로 단조강의 재질은 S34MnV강으로 박용 엔진의 크랭크샤프트 에 사용되는 탄소강이다. 시험편 채취를 위한 시 작품은 880℃ 17시간 노말라이징과 600℃ 17시간 템퍼링 열처리를 수행하였다. Table 1은 실제 사 용된 강괴의 Laddle의 화학적 성분과 실제 시작품 에서 분석한 화학적 성분을 나타낸 것이다.
시험편은 크랭크스로의 핀부 부근의 위치에서 채취하였으며, 피로시험편의 형상과 치수를 Fig. 1 에 나타내었다. 그림과 같이 시험편의 평행부의 길이는 30 mm이고, 직경은 10 mm이다.
Table 1 The chemical compositions (wt.%) Material C Si Mn P S Cr V Laddle 0.44 0.26 1.0 0.012 0.002 0.12 0.06 Product 0.43 0.24 1.04 0.016 0.004 0.14 0.06
본 연구에 사용된 실험장비는 용량 100 kN의 유압 전기식 피로시험기인 MTS Model 370을 사 용하였다. 피로실험 조건은 모두 상온에서 정현 파형 , 응력비 –1의 완전 양진 축하중 제어 일정 진폭 피로 실험을 15 Hz로 수행하였다. 본 연구 에서 수행한 피로실험 조건의 상세를 Table 2에 나타내었다. 또한 각 응력 레벨에서 시험편수는 7개이다.
참고적으로 본 연구에 사용된 시험편 재료의 미세조직을 Fig. 2에 나타낸다. 그 미세조직은 전 형적인 페라이트와 펄라이트 조직으로 나타났으 며, 결정입경의 크기는 약 250 μm로 ASTM 기준 G. No. 9로 나타났다. 또한 본 재료의 평균 인장 강도는 708MPa로 나타났다.
Fig. 1 Shape and dimensions of fatigue specimen
Table 2 Fatigue testing conditions for this work Testing condition
Frequency (Hz) 15 Environment Room Temp. Air Test start direction Tension Mean stress (MPa) 0
Stress ratio, R -1 Stress amplitude (MPa) 323, 343, 363
Fig. 2 Microstructure of S34MnV forged steel
3. 결과 및 고찰
3.1 피로수명의 시험편간 변동
일례로 Fig. 3 및 Fig. 4에 각각 응력 레벨 363MPa 및 323MPa에서의 시험편간 피로수명의 변동을 나타낸 것이다. 그림에서 알 수 있듯이 동 일 응력 레벨에서 피로수명이 시험편간 산포를 나타내고 있으며, 그 통계적 성질이 각각의 응력 레벨에서 다르게 나타나고 있음을 알 수 있다. 이 는 피로수명이 본질적으로 확률적 특성을 나타낸 다고 하는 것과 잘 부합된다.
2)Fig. 3 및 Fig. 4에서 알 수 있듯이 시험편간 피 로수명의 변동성은 응력 레벨이 낮게 되면 그 변 동성은 크게 나타나는 결과를 보였다.
363-1 363-2 363-3 363-4 363-5 363-6 363-7 0.0
2.0x10
34.0x10
36.0x10
38.0x10
31.0x10
41.2x10
41.4x10
41.6x10
4F atigue Life t o F ract ure (C ycles)
Serial Specimen Number Fatigue Life
max= 363 MPa
mean= 0 MPa R = -1
Specimen to Specimen Variation
Fig. 3 Specimen-to-specimen variation of the fatigue life at stress level of 363 MPa
323-1 323-2 323-3 323-4 323-5 323-6 323-7 0.0
5.0x10
41.0x10
51.5x10
52.0x10
52.5x10
5F atig u e Life t o Fra ctur e (Cy cl es)
Serial Specimen Number Fatigue Life
max= 323 MPa
mean= 0 MPa R = -1
Specimen to Specimen Variation
Fig. 4 Specimen-to-specimen variation of the fatigue life at stress level of 323 MPa
3.2 피로수명의 확률분포
피로수명의 확률분포를 결정하기 위하여, 먼저 실험에서 구한 응력 레벨별 피로수명을 대수정규 확률지에 플롯트한 것을 Fig. 5에 나타내었다. 또 한 대수정규확률지에 의하여 추정한 평균과 표준 편차를 Table 3에 나타내었다.
10
310
410
510
60.1 1 10 40 70 95
99.5 Lognormal Probability Plot of 363 MPa
shape = 9.17195 scale = 0.10293Lo gn ormal Percenti les (% )
Fatigue life, N (cycles) Percentiles Reference Line
(a) Stress level of 363 MPa
10
310
410
510
60.1 1 10 40 70 95
99.5 Lognormal Probability Plot of 343 MPa
shape = 10.62395 scale = 0.21676L og n orm al Percentil es(% )
Fatigue life, N (cycles) Percentiles Reference Line
(b) Stress level of 343 MPa
10
310
410
510
60.1 1 10 40 70 95
99.5 Lognormal Probability Plot of 323 MPa
shape = 11.42878 scale = 0.56946L ognorm al P erce nti les (% )
Fatigue life, N (cycles) Percentiles Reference Line
(c) Stress level of 323 MPa
Fig. 5 Log-normal distributions of the fatigue life
대수정규확률지상에서 알 수 있듯이 응력 레벨 이 증가하면 평균 피로수명은 감소하고, 직선의 기울기 값이 증가함을 알 수 있다. 즉 피로수명의 변동성은 응력 레벨이 감소하면 증가하는 것을 의미한다.
한편, 응력 레벨별 피로수명을 종합화하여 와이 블 확률지에 플롯트한 것을 Fig. 6에 나타내었다.
본 그림에서 알 수 있듯이 각 응력 레벨에서 피로 수명은 직선으로 잘 표현됨을 알 수 있으며, 확률 지상의 상관계수와 왜도 해석 등의 관계로부터 비교적 2-파라미터 와이블 확률분포에 적합함을 알 수 있다. 본 실험 결과의 2-파라미터 와이블 확 률분포함수의 파라미터의 추정치를 Table 4에 나 타내었다.
Table 3 Results of the log-normal distribution for each stress level
Stress level (MPa)
Mean,
μStandard Deviation,
σFatigue Life with p=50%
363 9.17195 0.10293 9623 343 10.62395 0.21676 41108 323 11.42878 0.56946 91930
Fig. 6 2-parameter Weibull plots of the fatigue life
Table 4 Results of the 2-parameter Weibull distribution for each stress level
Stress level (MPa)
Shape parameter,
α
Scale parameter,
β
Fatigue Life with p=50%
363 12.09 10037 9621 343 5.04 45474 41772 323 1.93 119630 106124
Fig. 6과 Table 4에서 잘 알 수 있듯이 피로수명 의 2-파라미터 와이블 분포의 형상 파라미터는 응 력 레벨이 감소할수록 감소하는 결과를 나타내었 으며, 척도 파라미터는 응력 레벨이 감소할수록 증가하는 결과를 보였다.
이상의 결과로부터 본 연구에서 수행한 크랭크 스로 단조강의 피로수명의 확률분포는 대수정규 분포 혹은 2-파라미터 와이블 분포로 적합할 수 있음을 알았다.
3.3 확률론적 설계피로강도의 결정
앞 절에서와 같이, 본 연구에서 수행한 크랭크 스로 단조강의 피로수명은 대수정규분포 혹은 와 이블 분포에 적합함을 알았다. 본 절에서는 크랭 크스로의 피로수명이 와이블 분포에 따른다고 가 정하여 조건부 확률밀도함수를 모델링한다.
S-N 선도에서 피로수명을 하나의 확률변수로 취급하면, 어떤 주어진 응력 레벨에서 확률밀도함 수를 얻는 것이 가능하다. 실제로 이것은 Zhai 등 이 주장하는 바와 같이 하나의 조건부 확률밀도 함수이다.
13)즉, 다음과 같이 표현할 수 있다.
(1)
여기서, N은 피로수명으로 하나의 확률변수이 고, S는 응력 레벨을 나타낸다. 식 (1)은 어떤 응 력 레벨
S=S*의 조건에서 확률변수 N의 조건부확률밀도함수이다. 응력 레벨이 변화하면 확률밀 도함수도 변화한다.
식 (1)에서 만일 주어진 응력 레벨에서 피로수
명이 2-파라미터 와이블 분포에 따른다고 하면,
이에 상응하는 조건부 확률밀도함수는 다음과 같
이 표현된다.
exp
(2)
여기서,
α및
β는 각각 어떤 응력 레벨 S*에서 와이블 분포의 형상 파라미터와 척도 파라미터를 나타낸다.
식 (2)에서 두 가지 파라미터,
α및
β는 응력 레벨 S의 함수가 된다. 즉, 응력 레벨 S가 변화하 면 다음과 같이 표현할 수 있다.
(3)
(4)
따라서 주어진 각 응력 레벨에서의 확률변수 N 의 확률밀도함수는 다음과 같다.
exp
(5)
조건부 확률밀도함수의 개념도를 Fig. 7에 나타 내었다. 각 응력 레벨에서의 50% 확률의 점을 취 하여 연결하면 전통적인 S-N 곡선이 된다. 또한 각각의 응력 레벨에서 상응하는 확률의 값을 취 하여 연결하면 P-S-N 선도를 구할 수 있다.
Fig. 8은 본 연구에서 수행한 각 응력 레벨에서 의 피로수명과 저자 등의 staircase 법에 의하여 구
Fig. 7 A schematic diagram of the conditional probability density function
한 피로수명 데이터
5)를 포함하여 나타낸 것이다.
그림에서 알 수 있듯이 피로수명의 확률밀도함수 는 각각의 응력 레벨에서 다르다는 것을 알 수 있 다. 따라서 식 (3)과 식 (4)의 관계식을 구하기 위 하여 응력과 각 파라미터와의 관계를 Fig. 9 및 Fig. 10에 나타내었다.
10
310
410
510
610
7250 275 300 325 350 375 400
363 MPa 343 MPa 323 MPa 303 MPa 283 MPa
Stress leve l, S (MP a)
Fatigue life, N (cycles) Life data
5
Fig. 8 Relation between stress level and fatigue life
300 320 340 360 380 400
1 10 100
Shape parameter
Relationship between and stress amplitude
Sh ape parame ter,
Stress amplitude,
a Equation y = a + b*x Weight No Weighting Residual Sum of Squares 3.09629E-5 Pearson's r 0.99995 Adj. R-Square 0.99981Value Standard Error
B Intercept -39.15359 0.39336
B Slope 15.71868 0.15518
Fig. 9 Relationship between α and stress level
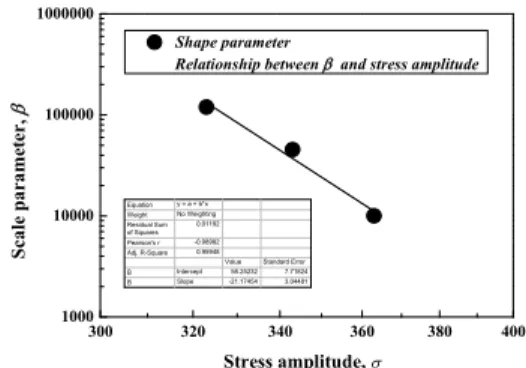
300 320 340 360 380 400
1000 10000 100000 1000000
Shape parameter
Relationship between and stress amplitude
S ca le pa ra m ete r,
Stress amplitude,
a Equation y = a + b*xWeight No Weighting Residual Sum
of Squares 0.01192
Pearson's r -0.98982 Adj. R-Square 0.95948
Value Standard Error
B Intercept 58.25232 7.71824
B Slope -21.17454 3.04481
Fig. 10 Relationship between β and stress level
그림에서 보는 것처럼
α및
β는 응력 레벨과 좋은 상관관계가 성립함을 알 수 있으며, 그 상관 관계식은 다음과 같다.
log log (6)
log log (7)
본 수식들을 이용하여 임의의 응력 레벨에 대 한 파괴확률 50%의 피로수명을 다음과 같이 구할 수 있다.
∞
(8)
일례로 363, 343, 323, 303 및 283 MPa에서 구 한 평균 피로수명을 이용하여 S-N 선도를 Fig. 11 에 나타내었다. 그림에서 추정한 200만 사이클에 서의 본 재료의 설계피로강도는 305MPa로 나타났 다. 이는 저자 등
5)의 Staircase 법에 의하여 구한 296MPa 값보다는 9MPa 정도 높게 예측되었으나, 오차를 고려하면 본 연구의 접근 방법을 이용하 여 크랭크스로 단조강의 설계피로강도를 확률론 적으로 추정하는 것이 가능함을 알았다. 일례로 본 접근 방법을 이용하여 식 (6) 및 식 (7)의 관계 식으로부터 크랭크스로 단조강의 B10 수명을 추 정한 결과 그 설계피로강도는 250MPa를 얻었다.
10
310
410
510
610
710
8200 250 300 350 400 450 500
Sm
= 305 MPa at 2 x 10
6cycles
S = 447.71 N -0.02634