https://doi.org/10.5468/ogs.2018.61.3.404 pISSN 2287-8572 · eISSN 2287-8580
Introduction
Overactive bladder (OAB) is a symptom complex defined by the International Urogynecological Association/International Continence Society as urgency, with or without urgency uri- nary incontinence, usually seen with urinary frequency and nocturia [1]. The prevalence of OAB is diversely reported de- pending on the characteristics of the subject group such as age, ethnicity, and socioeconomic status, or how to define OAB from as low as 2% to as high as 53% [2-5]. In 2009, the prevalence of OAB was reported as 10% in man and 14.3%
in women among 2000 healthy adults in Korea [6].
Risk factors and factors affecting the severity of
overactive bladder symptoms in Korean women who use public health centers
Jungsoo Chae
1, Eun-Hee Yoo
1, Yeonseong Jeong
1, Seungyeon Pyeon
2, Donguk Kim
31Department of Obstetrics and Gynecology, Kyung Hee University Hospital at Gangdong, College of Medicine, Kyung Hee University, Seoul;
2Department of Gynecology, Namyangju Yang Hospital, Namyangju; 3Department of Statistics, Sungkyunkwan University, Seoul, Korea
Objective
To investigate the prevalence, risk factors of overactive bladder (OAB) and the factors affecting the severity of OAB symptoms.
Methods
A total 822 interviews with women aged 18–80 years who visited public health centers were conducted between April 2014 and April 2015. The questionnaire was composed of 16 questions about urinary symptoms, 14 questions about self-treatment and the use of complementary and alternative medicine, and 21 questions about socio-demographic characteristics. The diagnostic criterion for OAB is a total OAB symptom score of 3 and more, with an urgency score of 2 or more. To know the risk factors and factors affecting the severity of OAB, the multivariate logistic regression analysis was performed.
Results
One hundred fifty-seven participants (19.3%) were diagnosed with OAB, of whom 10.7%, 8.1%, and 0.7% had mild, moderate, and severe OAB symptoms, respectively. In addition, the prevalence of OAB increased with age. Among all the participants, 39.1% had stress incontinence, among them 32.7% had OAB as well. The significant risk factors of OAB were identified as age, current smoking, hyperlipidemia, cardiovascular and renal disease, whereas, the factors affecting the severity of OAB were age, current smoking, and hyperlipidemia.
Conclusion
Those who have risk factors and factors affecting severity of OAB should be educated to increase OAB awareness and act of urinary health promotion.
Keywords: Urinary bladder, overactive; Epidemiology; Risk factors
Received: 2017.06.07. Revised: 2017.09.20. Accepted: 2017.09.25.
Corresponding author: Eun-Hee Yoo
Department of Obstetrics and Gynecology, Kyung Hee University Hospital at Gangdong, College of Medicine, Kyung Hee University, 892 Dongnam-ro, Gangdong-gu, Seoul 05278, Korea
E-mail: [email protected]
https://orcid.org/0000-0001-6126-3582
Articles published in Obstet Gynecol Sci are open-access, distributed under the terms of the Creative Commons Attribution Non-Commercial License (http://creativecommons.
org/licenses/by-nc/3.0/) which permits unrestricted non-commercial use, distribution, and reproduction in any medium, provided the original work is properly cited.
Copyright © 2018 Korean Society of Obstetrics and Gynecology
The quality of life can be significantly affected by various lower urinary tract symptoms, including major symptoms of OAB such as urgency, frequency, and nocturia. The OAB symptoms have broad effects on the quality of life, including social, mental, occupational, physical, and sexual aspects [7].
This becomes a factor in increasing the socioeconomic burden [8,9]. Therefore, a more detailed understanding on this sub- ject is necessary. The purpose of this study is to investigate the prevalence, risk factors of OAB and the factors affecting the severity of OAB symptoms.
Materials and methods
A population-based cross-sectional study based on a ques- tionnaire was conducted from April 2014 to April 2015 after getting Institutional Review Board (IRB) approval (IRB No. HYI- 14-0007-1). Five public health centers located at Gyeonggi province and Seoul were chosen for this purpose. A total of 812 women aged 18–80 years responded to the survey study, which yielded a response rate of 81.5% (812/996).
The questionnaire consisted of 16 questions about urinary symptoms, 14 questions about self-treatment and the use of complementary and alternative medicine, and 21 questions about socio-demographic characteristics. The questionnaire also had 4 questions (number of urination episodes while awake, urination after awakening from sleep, urgency, and urge incontinence) to calculate the OAB symptom score (OABSS). The OAB symptoms were determined from the fre- quency of urination, with at least 8 episodes from morning to night; nocturia, with at least one episode of urination during sleep; urgency experienced at least once a week, consisting of a difficult time due to an urgent urination desire; urge in- continence, namely, losing control of urine along with urinary urgency symptoms. The OABSS developed by Homma et al.
[10], in 2006 was used for the diagnosis of OAB. We used a Korean version of the OABSS that was developed and vali- dated in 2011 [11]. Each symptom was scored between 0–2 for frequency, 0–2 for nocturia, 0–5 for urgency, and 0–5 for urge incontinence, depending on the severity. The diagnostic criteria for OAB are a total OABSS of 3 and more with an urgency score of 2 or more. The total score of 5 or less is de- fined as mild, a score of 6 to 11 as moderate, and a score of 12 or more as severe OAB.
The section of the questionnaire, regarding the self-treat-
ment and the use of complementary and alternative health care, contained questions on the access to the information about self-treatment, whether the treatment was performed or not, and an oriental and folk remedy was used. Likewise, it also contained medical care costs and the intention for par- ticipation in public institutions for these treatment methods.
The socio-demographic characteristics included age, height, weight, waist circumference, marital status, number of births (divided into vaginal delivery and cesarean delivery), socio- economic characteristics (religion, education, place of birth, occupation, and income level), status of alcohol drinking and smoking, amount of exercise, menopausal status, and the presence or absence of chronic diseases and surgical history.
Although it was impossible to accurately diagnose metabolic syndrome based only on the questionnaire, participants with at least 2 characteristics (32 inches or above waist circumfer- ence, hypertension, diabetes, or hyperlipidemia) were catego- rized into the metabolic syndrome risk group.
After gathering data though the structured questionnaire, a coded book was prepared for the various responses ob- tained. Thereafter, the data were converted into the mode that could pick the necessary information based on the re- search problem. After checking for data completeness and consistency, it was analyzed using statistical tools. Data entry was done in excel and analyzed using the SAS statistical soft- ware (SAS Institute, Cary, NC, USA) and R (version 2.2.0; R Foundation, Vienna, Austria). The research data instruments were checked and cleaned for their completeness and error in data entering.
The prevalence of OAB was calculated by dividing the par- ticipants into an OAB group and a non-OAB group. Then, variables showing differences between the 2 groups were identified, and the risk factors of each group were investigat- ed. Next, to identify risk factors affecting the severity of OAB, the non-OAB group and mild OAB group were combined into one group while the moderate and severe OAB groups were merged into another group. Variables showing differences between these 2 groups were investigated.
The χ2 test and t-test were used for analyses of categorical variables and continuous variables, respectively. To identify risk factors of OAB, variables that showed significant differences between the 2 groups were first identified using univariate logistic regression analysis, and the related variables were identified by using the backward elimination method that removes least significant variables from the model one by one
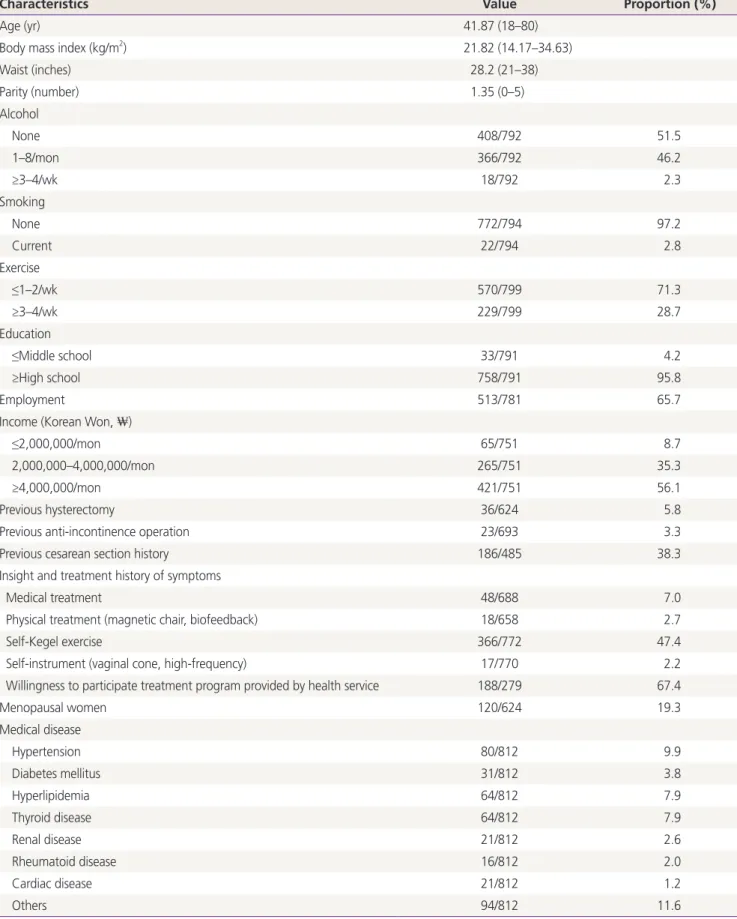
Table 1. Demographics of patients
Characteristics Value Proportion (%)
Age (yr) 41.87 (18–80)
Body mass index (kg/m2) 21.82 (14.17–34.63)
Waist (inches) 28.2 (21–38)
Parity (number) 1.35 (0–5)
Alcohol
None 408/792 51.5
1–8/mon 366/792 46.2
≥3–4/wk 18/792 2.3
Smoking
None 772/794 97.2
Current 22/794 2.8
Exercise
≤1–2/wk 570/799 71.3
≥3–4/wk 229/799 28.7
Education
≤Middle school 33/791 4.2
≥High school 758/791 95.8
Employment 513/781 65.7
Income (Korean Won, ₩)
≤2,000,000/mon 65/751 8.7
2,000,000–4,000,000/mon 265/751 35.3
≥4,000,000/mon 421/751 56.1
Previous hysterectomy 36/624 5.8
Previous anti-incontinence operation 23/693 3.3
Previous cesarean section history 186/485 38.3
Insight and treatment history of symptoms
Medical treatment 48/688 7.0
Physical treatment (magnetic chair, biofeedback) 18/658 2.7
Self-Kegel exercise 366/772 47.4
Self-instrument (vaginal cone, high-frequency) 17/770 2.2
Willingness to participate treatment program provided by health service 188/279 67.4
Menopausal women 120/624 19.3
Medical disease
Hypertension 80/812 9.9
Diabetes mellitus 31/812 3.8
Hyperlipidemia 64/812 7.9
Thyroid disease 64/812 7.9
Renal disease 21/812 2.6
Rheumatoid disease 16/812 2.0
Cardiac disease 21/812 1.2
Others 94/812 11.6
through a multivariate logistic regression analysis. In univariate regression analysis, a P-value of 0.25 or less was selected as candidate variables. Moreover, when a P-value was less than 0.05, it was considered statistically significant in multivariate regression analysis.
Results
Table 1 shows the demographics of the participants. Age of the participants ranged from 18 to 80 years with the mean age of 41.8 years. Of the total participants, 21.1% were less than 30 years of age, 19.7% were in their 30’s, 28.3% were in their 40’s, 20.1% were in their 50’s, 9.2% were in their 60’s, and 1.6% were in their 70’s.
The prevalence of OAB was 19.3% (157/812). Of whom 55.4% (87/157), 40.8% (64/157), and 3.8% (6/157) had mild, moderate, and severe OAB symptoms, respectively. And 39.2% (318/812) complained stress incontinence and 12.8%
(104/812) experienced both stress and OAB symptoms.
Fig. 1 presents a graph showing distributions of OAB by age. The prevalence of OAB by age is as follows: 8.4% were aged less than 30 years, 10.3% were in their 30’s, 21.9%
were in their 40’s, 22.1% were in their 50’s, 38.4% were in their 60’s, and 69.2% were more than 70 years, showing that the frequency of OAB increased with age. A similar pattern was observed in the severity of OAB. Mild OAB was observed in 9.2% of patients less than 30 years of age, 8.3% in their 30’s, 12.1% in their 40’s, 11.3% in their 50’s, 19.2% in their 60’s, and 0% in patients greater than 70 years. In the case of
moderate OAB, the corresponding proportion of participants by age was 1.2%, 1.9%, 8.9%, 10.1%, 17.8%, and 46.2%, respectively. The same pattern was seen in severe OAB: 0%, 0.9%, 0.6%, 1.4%, and 23.1%, respectively.
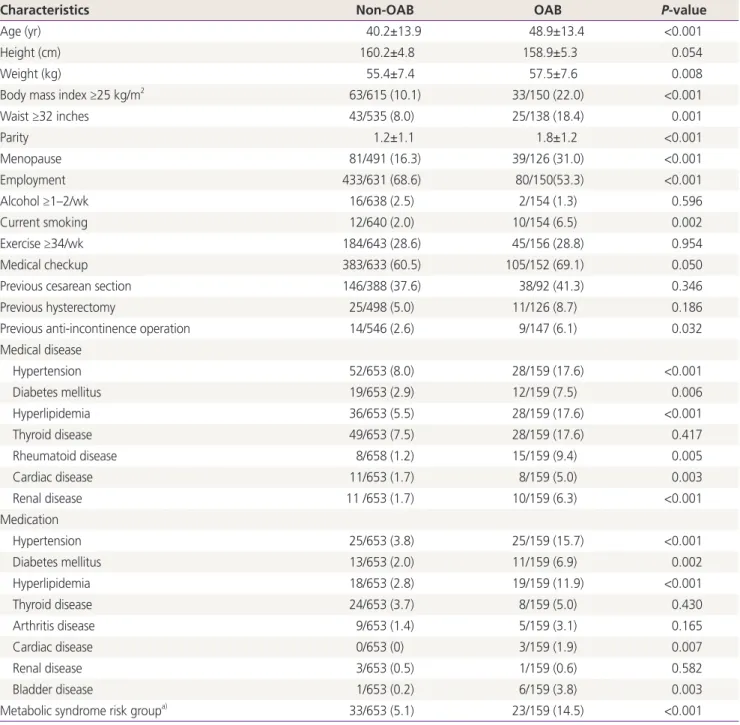
In order to identify factors affecting the occurrence of OAB, variables that showed differences between the OAB group and the non-OAB group were identified by univariate regression analysis (Table 2). The identified variables show- ing statistically significant differences included age, weight, waist circumference, menopause, current employment, cur- rent smoker, history of incontinence surgery, and diagnosis of hypertension, diabetes, and hyperlipidemia. In addition, participants who were taking medications for hypertension, diabetes, hyperlipidemia, or bladder disease showed statisti- cally significant differences. Variables defined as the meta- bolic syndrome risk group also showed differences between 2 groups.
Multivariate logistic regression analysis was performed using
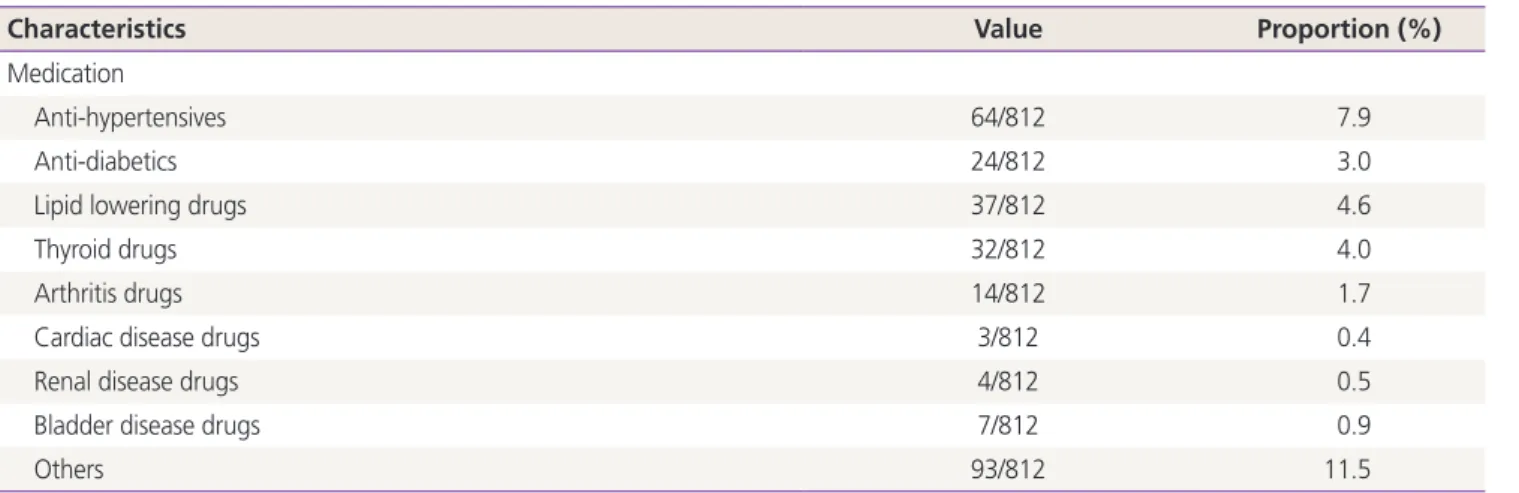
Characteristics Value Proportion (%)
Medication
Anti-hypertensives 64/812 7.9
Anti-diabetics 24/812 3.0
Lipid lowering drugs 37/812 4.6
Thyroid drugs 32/812 4.0
Arthritis drugs 14/812 1.7
Cardiac disease drugs 3/812 0.4
Renal disease drugs 4/812 0.5
Bladder disease drugs 7/812 0.9
Others 93/812 11.5
Values are presented as mean (range) or number/total number.
Table 1. Continued
Fig. 1. Prevalence rates according to age. OAB, overactive bladder.
80.0 60.0 40.0 20.0
0.0
Age (yr) <30 30-39 40-49 50-59 60-69 >70
OAB Mild Moderate Severe
Table 2. Risk factors of overactive bladder in univariate regression analysis
Characteristics Non-OAB OAB P-value
Age (yr) 40.2±13.9 48.9±13.4 <0.001
Height (cm) 160.2±4.8 158.9±5.3 0.054
Weight (kg) 55.4±7.4 57.5±7.6 0.008
Body mass index ≥25 kg/m2 63/615 (10.1) 33/150 (22.0) <0.001
Waist ≥32 inches 43/535 (8.0) 25/138 (18.4) 0.001
Parity 1.2±1.1 1.8±1.2 <0.001
Menopause 81/491 (16.3) 39/126 (31.0) <0.001
Employment 433/631 (68.6) 80/150(53.3) <0.001
Alcohol ≥1–2/wk 16/638 (2.5) 2/154 (1.3) 0.596
Current smoking 12/640 (2.0) 10/154 (6.5) 0.002
Exercise ≥34/wk 184/643 (28.6) 45/156 (28.8) 0.954
Medical checkup 383/633 (60.5) 105/152 (69.1) 0.050
Previous cesarean section 146/388 (37.6) 38/92 (41.3) 0.346
Previous hysterectomy 25/498 (5.0) 11/126 (8.7) 0.186
Previous anti-incontinence operation 14/546 (2.6) 9/147 (6.1) 0.032
Medical disease
Hypertension 52/653 (8.0) 28/159 (17.6) <0.001
Diabetes mellitus 19/653 (2.9) 12/159 (7.5) 0.006
Hyperlipidemia 36/653 (5.5) 28/159 (17.6) <0.001
Thyroid disease 49/653 (7.5) 28/159 (17.6) 0.417
Rheumatoid disease 8/658 (1.2) 15/159 (9.4) 0.005
Cardiac disease 11/653 (1.7) 8/159 (5.0) 0.003
Renal disease 11 /653 (1.7) 10/159 (6.3) <0.001
Medication
Hypertension 25/653 (3.8) 25/159 (15.7) <0.001
Diabetes mellitus 13/653 (2.0) 11/159 (6.9) 0.002
Hyperlipidemia 18/653 (2.8) 19/159 (11.9) <0.001
Thyroid disease 24/653 (3.7) 8/159 (5.0) 0.430
Arthritis disease 9/653 (1.4) 5/159 (3.1) 0.165
Cardiac disease 0/653 (0) 3/159 (1.9) 0.007
Renal disease 3/653 (0.5) 1/159 (0.6) 0.582
Bladder disease 1/653 (0.2) 6/159 (3.8) 0.003
Metabolic syndrome risk groupa) 33/653 (5.1) 23/159 (14.5) <0.001
Values are presented as mean±standard deviation or number (%).
OAB, overactive bladder.
a)Metabolic syndrome risk group: participants with at least 2 characteristics (waist ≥32 inches, hypertension, diabetes, and hyperlipidemia).
Table 3. Risk factors of overactive bladder in multivariate regression analysis
Characteristics Odds ratio 95% CI P-value
Age (yr) 1.044 1.026–1.062 <0.001
Current smoker 8.017 2.788–23.051 <0.001
Hyperlipidemia 2.196 1.155–4.178 0.016
Cardiovascular and renal disease 3.925 1.151–13.381 0.028
CI, confidence interval.
the variables that were suspected to be related based on the results of univariate regression analysis. As a result, partici- pants who are elderly, current smokers, and those hyperlip- idemia, cardiovascular, and renal disease showed statistically significant higher risk group for OAB (Table 3).
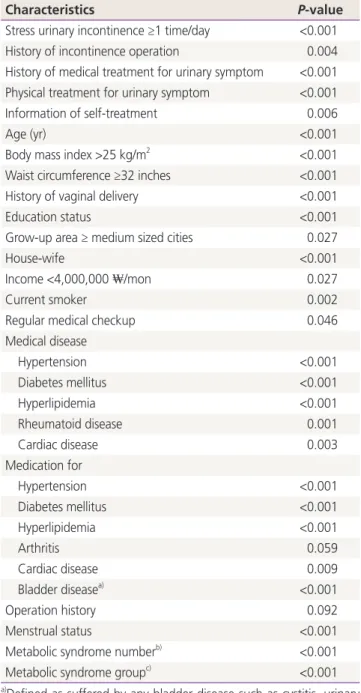
Risk factors affecting the severity of OAB were investigated by comparing 2 groups, one including the combined non- OAB and mild-OAB groups, and the other including the moderate-OAB and severe-OAB groups. Table 4 represents the results of univariate regression analysis. The identified variables showing statistically significant differences included stress urinary incontinence, incontinence operation history, medical or physical treatment for urinary symptom, age, body mass index (BMI), waist circumference, vaginal delivery history, educational status, job, menstrual status, diagnosis with hypertension, diabetes, hyperlipidemia and rheumatoid disease and medication for hypertension, diabetes, hyper- lipidemia, bladder disease. The resulting variables suspected to affect the severity of OAB were subject to multivariate regression analysis, which resulted in age, current smoker and hyperlipidemia being correlated with the severity of OAB (Table 5).
Discussion
This study targeted women who have used public health centers with a concern for health promotion. The OAB preva- lence rate was found to be 19.3%. This rate might be under- estimated because the study population could not reflect the actual distribution of age of census. Several studies for Ko- rean OAB have been reported. Choo et al. [12] conducted an epidemiologic investigation of OAB in 200 men and women through a telephone survey. As a result, it was found that the prevalence of OAB in women without urge incontinence was 16.3%, and 15% with urge incontinence. Lee et al. [6] con- ducted a telephone survey of 2000 Korean men and women, and consequently the prevalence of OAB among women was Table 4. Factors affecting the severity of overactive bladder in
univariate regression analysis
Characteristics P-value
Stress urinary incontinence ≥1 time/day <0.001 History of incontinence operation 0.004 History of medical treatment for urinary symptom <0.001 Physical treatment for urinary symptom <0.001
Information of self-treatment 0.006
Age (yr) <0.001
Body mass index >25 kg/m2 <0.001 Waist circumference ≥32 inches <0.001
History of vaginal delivery <0.001
Education status <0.001
Grow-up area ≥ medium sized cities 0.027
House-wife <0.001
Income <4,000,000 ₩/mon 0.027
Current smoker 0.002
Regular medical checkup 0.046
Medical disease
Hypertension <0.001
Diabetes mellitus <0.001
Hyperlipidemia <0.001
Rheumatoid disease 0.001
Cardiac disease 0.003
Medication for
Hypertension <0.001
Diabetes mellitus <0.001
Hyperlipidemia <0.001
Arthritis 0.059
Cardiac disease 0.009
Bladder diseasea) <0.001
Operation history 0.092
Menstrual status <0.001
Metabolic syndrome numberb) <0.001
Metabolic syndrome groupc) <0.001
a)Defined as suffered by any bladder disease such as cystitis, urinary stone; b)Counting the number among waist circumference ≥32 inches, hypertension, diabetes mellitus, and hyperlipidemia; c)Defined as 2 or more among waist circumference ≥32 inches, hypertension, diabetes mellitus, and hyperlipidemia.
Table 5. Factors affecting the severity of overactive bladder in multivariate regression analysis
Characteristics Odds ratio 95% CI P-value
Age (yr) 1.048 1.030–1.066 <0.001
Current smoker 7.879 3.043–20.404 <0.001
Hyperlipidemia 2.206 1.191–4.088 0.012
CI, confidence interval.
found to be 14.2%. In addition, it was also reported that the prevalence of OAB was 14.3% for 350 healthy menopausal women [13]. Contrary to these studies, we used a validated self-questionnaire of OABSS in which the scores of each uri- nary symptoms was used for diagnosis and severity of OAB and not a telephone survey for the lower urinary tract symp- toms. The differences in the type of question, for example, the respondents could be asked yes/no questions or for a detailed answer, and the Likert response scale might bring in different results. Also in the telephone survey, more time is required to complete the survey and the respondents might not participate if they were contacted at an inconvenient time and they may be less willing to open up regarding their prob- lem as compared to an internet or self-completion survey. In a questionnaire study, the method how to survey, design of questionnaire, and study population exert strong effects on the results. Thus, the prevalence shows variation.
Many studies have reported that the OAB prevalence rate increases with age [2,3,14,15]. Our study demonstrated that the prevalence of OAB tended to increase with age, while the severity of OAB worsened. The multivariate logistic regression analysis indicated that age was a risk factor for both the OAB and severity of OAB. In addition, the age-related changes in the detrusor muscle could affect OAB symptoms [16].
According to the results of this study, current smoking was also considered to be a risk factor, consistent with the results of several previous studies [15,17]. Koskimäki et al. [17] re- ported that a history of smoking increased the odds of oc- currence of lower urinary tract symptoms, and Tähtinen et al.
[18] reported that compared to non-smokers, smokers had an over 3 times higher frequency of urgency and frequent urina- tion [18]. Smoking can cause hormonal and nutrient imbal- ances affecting the bladder and collagen synthesis [19], and it has antiestrogenic effects in women [20].
Renal disease was also identified as a factor that increases OAB risk. According to a study by Chung et al. [21] nocturia increased in cases with chronic kidney disease (CKD). It is thought that this factor showed the same results with an in- crease of OAB in patients with renal disease.
The risk factors vary a little from study to study. Seim et al.
[15] from Hunt study suggested BMI, alcohol consumption, diabetes, history of stroke as risk factors in addition to age and smoking. de Boer et al. [22] reported that the risk factors of OAB were old age (over 75 years), overweight, menopause and smoking. Lugo et al. [4] reported the risk factors of OAB
were age over 50, obesity, menopause and parity. However, Al-Shaiji et al. [23] found that no significant connection ex- isted between the OAB prevalence and BMI.
Recently the study for correlation between metabolic syn- drome and OAB has been actively done [24-27]. Although pathophysiology is not fully known, in animal studies using the fructose-fed rats (FFRs), a common model used for the metabolic syndrome, premicturition, unstable bladder con- tractions suggestive of detrusor overactivity were noted in 62.5% of the FFRs as compared with none in the controls [28].
Moreover, an increased expression of the muscarinic M2-M3 receptor of mRNA and protein levels in the urothelium and muscle layer of the bladder with unstable bladder contrac- tions in experimental FFRs supports the relationship of meta- bolic syndrome-induced detrusor and autonomous nervous system overactivity [29]. In our study, the data were insuffi- cient to diagnose metabolic syndrome to the minute. Instead, we tried to determine the relationship between OAB and metabolic syndrome risk group where the participants had at least 2 or more risk factors among waist circumference ≥32 inches, hypertension, diabetes mellitus and hyperlipidemia.
As shown in Table 5, our defined metabolic risk group was found as a significant risk factor for OAB in univariate regres- sion analysis, however statistical significance was no longer observed on multiple regression analysis.
In this study, there was an additional question for the par- ticipants of the OAB group who have tried self-treatment, complementary and alternative treatment. Even though a small percentage of the OAB group had tried self and com- plementary treatment, 5.3% and 16.7%, respectively; data is not shown in the table, most of the OAB group (75.3%) expressed their intention to participate if the public institu- tion would provide treatment programs. Women with urinary symptom typically do self-treatment, take non-prescription drugs, or restrict water intake. It seems that people feel a little ashamed to go to the doctor or receive treatment for urinary symptoms, whereas there is an intention to participate in treatment programs offered by public institution reflects interest and expectation for diagnosis and treatment of uri- nary symptoms. Thus, it is of great importance to raise OAB awareness and organize a program for the prevention and treatment of OAB. In addition, the public health program for OAB by a multidisciplinary team could not only improve QoL of the affected women but could also reduce the social health expenditure burden in the super-aging society.
In conclusion, age, current smoking, hyperlipidemia, car- diovascular and renal disease were revealed as significant risk factors for OAB or severity of OAB.
Conflict of interest
No potential conflict of interest relevant to this article was re- ported.
References
1. Abrams P, Cardozo L, Fall M, Griffiths D, Rosier P, Ulm- sten U, et al. The standardisation of terminology of low- er urinary tract function: report from the Standardisation Sub-committee of the International Continence Society.
Neurourol Urodyn 2002;21:167-78.
2. Stewart WF, Van Rooyen JB, Cundiff GW, Abrams P, Herzog AR, Corey R, et al. Prevalence and burden of overactive bladder in the United States. World J Urol 2003;20:327-36.
3. Irwin DE, Milsom I, Hunskaar S, Reilly K, Kopp Z, Her- schorn S, et al. Population-based survey of urinary in- continence, overactive bladder, and other lower urinary tract symptoms in five countries: results of the EPIC study. Eur Urol 2006;50:1306-14.
4. Lugo Salcedo F, Sánchez Borrego R, G.U.I.A.S Group.
Assessment of female prevalence of overactive bladder (OAB) in Barcelona using a self-administered screen- ing questionnaire: the Cuestionario de Autoevaluación del Control de la Vejiga (CACV). Int Urogynecol J 2013;24:1559-66.
5. Kogan MI, Zachoval R, Ozyurt C, Schafer T, Christensen N. Epidemiology and impact of urinary incontinence, overactive bladder, and other lower urinary tract symp- toms: results of the EPIC survey in Russia, Czech Repub- lic, and Turkey. Curr Med Res Opin 2014;30:2119-30.
6. Lee YS, Lee KS, Jung JH, Han DH, Oh SJ, Seo JT, et al.
Prevalence of overactive bladder, urinary incontinence, and lower urinary tract symptoms: results of Korean EPIC study. World J Urol 2011;29:185-90.
7. Mauseth SA, Skurtveit S, Spigset O. Adherence, persis- tence and switch rates for anticholinergic drugs used for overactive bladder in women: data from the Norwe-
gian Prescription Database. Acta Obstet Gynecol Scand 2013;92:1208-15.
8. Michel MC, Schneider T, Krege S, Goepel M. Does gen- der or age affect the efficacy and safety of tolterodine?
J Urol 2002;168:1027-31.
9. Richter HE, Burgio KL, Chai TC, Kraus SR, Xu Y, Nyberg L, et al. Predictors of outcomes in the treatment of urge urinary incontinence in women. Int Urogynecol J Pelvic Floor Dysfunct 2009;20:489-97.
10. Homma Y, Yoshida M, Seki N, Yokoyama O, Kakizaki H, Gotoh M, et al. Symptom assessment tool for overactive bladder syndrome--overactive bladder symptom score.
Urology 2006;68:318-23.
11. Jeong SJ, Homma Y, Oh SJ. Korean version of the over- active bladder symptom score questionnaire: translation and linguistic validation. Int Neurourol J 2011;15:135- 42.
12. Choo MS, Ku JH, Lee JB, Lee DH, Kim JC, Kim HJ, et al.
Cross-cultural differences for adapting overactive blad- der symptoms: results of an epidemiologic survey in Ko- rea. World J Urol 2007;25:505-11.
13. Sang JH, Park HM. Survey on the prevalence of overac- tive bladder in healthy Korean postmenopausal women.
J Korean Soc Menopause 2012;18:60-6.
14. Coyne KS, Sexton CC, Bell JA. The prevalence of lower urinary tract symptoms (LUTS) and overactive bladder (OAB) by racial/ethnic group and age: results from OAB- POLL. Neurourol Urodyn 2013;32:230-7.
15. Seim A, Hoyo C, Ostbye T, Vatten L. The prevalence and correlates of urinary tract symptoms in Norwegian men:
the HUNT study. BJU Int 2005;96:88-92.
16. Yoshida M, Miyamae K, Iwashita H, Otani M, Inadome A. Management of detrusor dysfunction in the elderly:
changes in acetylcholine and adenosine triphosphate release during aging. Urology 2004;63:17-23.
17. Koskimäki J, Hakama M, Huhtala H, Tammela TL. Asso- ciation of smoking with lower urinary tract symptoms. J Urol 1998;159:1580-2.
18. Tähtinen RM, Auvinen A, Cartwright R, Johnson TM 2nd, Tammela TL, Tikkinen KA. Smoking and bladder symptoms in women. Obstet Gynecol 2011;118:643-8.
19. Knuutinen A, Kokkonen N, Risteli J, Vähäkangas K, Kal- lioinen M, Salo T, et al. Smoking affects collagen synthe- sis and extracellular matrix turnover in human skin. Br J Dermatol 2002;146:588-94.
20. Baron JA, La Vecchia C, Levi F. The antiestrogenic effect of cigarette smoking in women. Am J Obstet Gynecol 1990;162:502-14.
21. Chung MS, Chuang YC, Lee JJ, Lee WC, Chancellor MB, Liu RT. Prevalence and associated risk factors of nocturia and subsequent mortality in 1,301 patients with type 2 diabetes. Int Urol Nephrol 2014;46:1269-75.
22. de Boer TA, Slieker-ten Hove MC, Burger CW, Vierhout ME. The prevalence and risk factors of overactive blad- der symptoms and its relation to pelvic organ prolapse symptoms in a general female population. Int Urogyne- col J 2011;22:569-75.
23. Al-Shaiji TF, Radomski SB. Relationship between body mass index and overactive bladder in women and cor- relations with urodynamic evaluation. Int Neurourol J 2012;16:126-31.
24. Ohgaki K, Horiuchi K, Kondo Y. Association between metabolic syndrome and male overactive bladder in a
Japanese population based on three different sets of cri- teria for metabolic syndrome and the overactive bladder symptom score. Urology 2012;79:1372-8.
25. Kupelian V, McVary KT, Kaplan SA, Hall SA, Link CL, Ai- yer LP, et al. Association of lower urinary tract symptoms and the metabolic syndrome: results from the Boston area community health survey. J Urol 2013;189:S107-14.
26. Uzun H, Yilmaz A, Kemik A, Zorba OU, Kalkan M. As- sociation of insulin resistance with overactive bladder in female patients. Int Neurourol J 2012;16:181-6.
27. Uzun H, Zorba OU. Metabolic syndrome in female pa- tients with overactive bladder. Urology 2012;79:72-5.
28. Lee WC, Chien CT, Yu HJ, Lee SW. Bladder dysfunction in rats with metabolic syndrome induced by long-term fructose feeding. J Urol 2008;179:2470-6.
29. Tong YC, Cheng JT. Alteration of M2, 3-muscarinic re- ceptor protein and mRNA expression in the bladder of the fructose fed obese rat. J Urol 2007;178:1537-42.