• 검색 결과가 없습니다.

Erratum: Significance of Differential Characteristics in Infantile Kawasaki Disease

N/A
N/A
Protected

Academic year: 2022

Share "Erratum: Significance of Differential Characteristics in Infantile Kawasaki Disease"

Copied!
3
0
0

로드 중.... (전체 텍스트 보기)

전체 글

(1)

641 https://e-kcj.org

In the article, “Significance of differential characteristics in infantile Kawasaki disease” in volume 49(8), page 755-765,

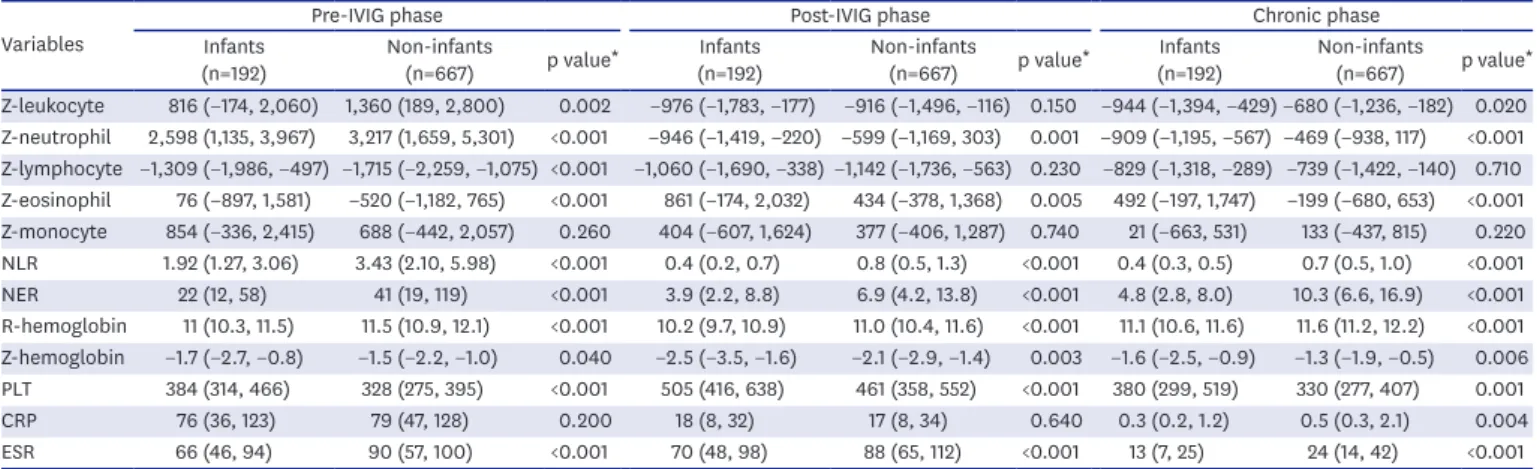
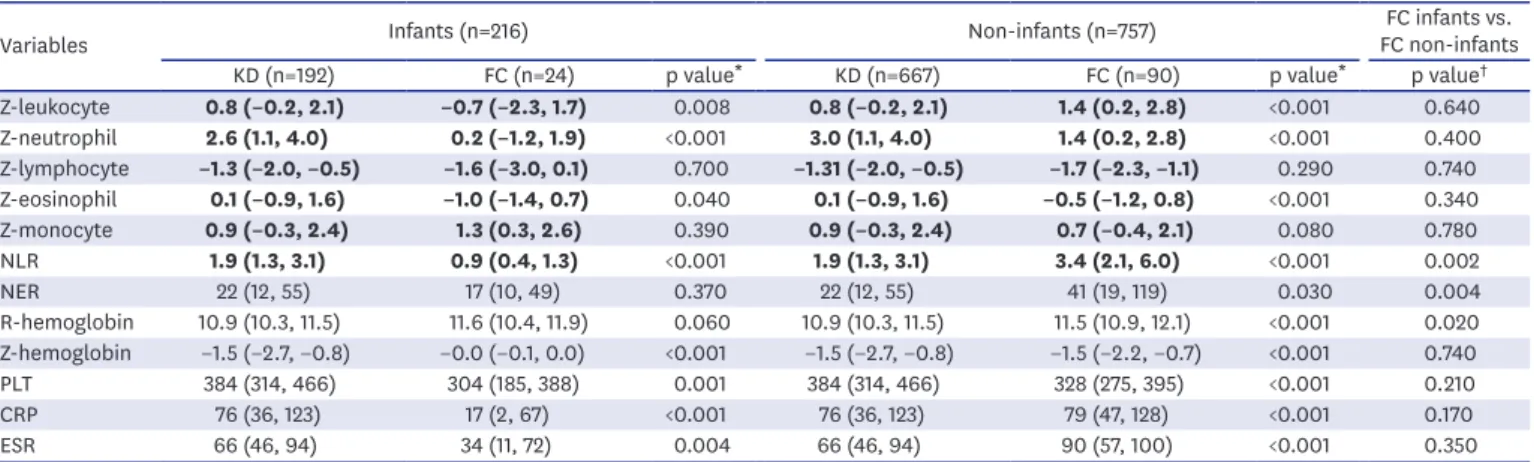
In the process of inputting standard deviation (SD) in Table 1, each 1,000 omitted. The units were entered incorrectly without checking the footnote of Table A1.20 in the reference article 9. The true Z value = (measured value − mean value) / original incorrect SD × 1,000 and therefore, the Z-values should be changed to 1/1,000 of the original incorrect SD, respectively in Tables 6 and 7. The original p values do not need to correct since all groups were compared with simultaneously 1,000 multiplied values.

Korean Circ J. 2020 Jul;50(7):641-643 https://doi.org/10.4070/kcj.2020.0999 pISSN 1738-5520·eISSN 1738-5555

Erratum

Copyright © 2020. The Korean Society of Cardiology

This is an Open Access article distributed under the terms of the Creative Commons Attribution Non-Commercial License (https://

creativecommons.org/licenses/by-nc/4.0) which permits unrestricted noncommercial use, distribution, and reproduction in any medium, provided the original work is properly cited.

ORCID iDs Ji Hee Kwak

https://orcid.org/0000-0001-6376-0427 JungHwa Lee

https://orcid.org/0000-0002-6592-3653 Kee Soo Ha

https://orcid.org/0000-0001-6753-5411

Ji Hee Kwak , MD 1 , JungHwa Lee , MD, PhD 2 , and Kee Soo Ha , MD, PhD 2

1

Department of Pediatrics, Kangbuk Samsung Hospital, Sungkyunkwan University School of Medicine, Seoul, Korea

2

Department of Pediatrics, Korea University Guro Hospital, Korea University College of Medicine, Seoul, Korea

Erratum: Significance of Differential Characteristics in Infantile Kawasaki Disease

This corrects the article “Significance of Differential Characteristics in Infantile Kawasaki

Disease” in volume 49 on page 755.

(2)

We deeply apologize for any inconvenience it may have caused.

642 https://e-kcj.org https://doi.org/10.4070/kcj.2020.0999

Erratum: Z-values in Infantile Kawasaki Disease

Table 6. Usefulness and comparison of Z in infants and non-infants with KD compared with FC groups in pre-IVIG phase

Variables Infants (n=216) Non-infants (n=757) FC infants vs.

FC non-infants

KD (n=192) FC (n=24) p value * KD (n=667) FC (n=90) p value * p value

Z-leukocyte 815 (−174, 2,060) −734 (−2,257, 1,710) 0.008 815 (−174, 2,060) 1,360 (182, 2,800) <0.001 0.640 Z-neutrophil 2,597 (1,135, 3,967) 224 (−1,201, 1,944) <0.001 2,597 (1,135, 3,967) 1,360 (182, 2,800) <0.001 0.400 Z-lymphocyte −1,309 (−1,986, −497) −1,623 (−2,498, 76) 0.700 −1,309 (−1,986, −497) −1,718 (−2,263, −1,077) 0.290 0.740 Z-eosinophil 76 (−896, 1,581) −999 (−1,404, 736) 0.040 76 (−896, 1,581) −520 (−1,193, 750) <0.001 0.340 Z-monocyte 854 (−336, 2,415) 1,319 (282, 2,574) 0.390 854 (−336, 2,415) 688 (−442, 2,054) 0.080 0.780 NLR 1.92 (1.27, 3.06) 0.91 (0.41, 1.31) <0.001 1.92 (1.27, 3.06) 3.43 (2.10, 5.98) <0.001 0.002

NER 22 (12, 55) 17 (10, 49) 0.370 22 (12, 55) 41 (19, 119) 0.030 0.004

R-hemoglobin 10.9 (10.3, 11.5) 11.6 (10.4, 11.9) 0.060 10.9 (10.3, 11.5) 11.5 (10.9, 12.1) <0.001 0.020 Z-hemoglobin −1.5 (−2.7, −0.8) −0.0 (−0.1, 0.0) <0.001 −1.5 (−2.7, −0.8) −1.5 (−2.2, −0.7) <0.001 0.740

PLT 384 (314, 466) 304 (185, 388) 0.001 384 (314, 466) 328 (275, 395) <0.001 0.210

CRP 76 (36, 123) 17 (2, 67) <0.001 76 (36, 123) 79 (47, 128) <0.001 0.170

ESR 66 (46, 94) 34 (11, 72) 0.004 66 (46, 94) 90 (57, 100) <0.001 0.350

Table 7. Laboratory characteristics of KD infants compared with KD non-infants in pre-IVIG, post-IVIG, and chronic phases

Variables Pre-IVIG phase Post-IVIG phase Chronic phase

Infants

(n=192) Non-infants

(n=667) p value * Infants

(n=192) Non-infants

(n=667) p value * Infants

(n=192) Non-infants

(n=667) p value * Z-leukocyte 816 (−174, 2,060) 1,360 (189, 2,800) 0.002 −976 (−1,783, −177) −916 (−1,496, −116) 0.150 −944 (−1,394, −429) −680 (−1,236, −182) 0.020 Z-neutrophil 2,598 (1,135, 3,967) 3,217 (1,659, 5,301) <0.001 −946 (−1,419, −220) −599 (−1,169, 303) 0.001 −909 (−1,195, −567) −469 (−938, 117) <0.001 Z-lymphocyte −1,309 (−1,986, −497) −1,715 (−2,259, −1,075) <0.001 −1,060 (−1,690, −338) −1,142 (−1,736, −563) 0.230 −829 (−1,318, −289) −739 (−1,422, −140) 0.710 Z-eosinophil 76 (−897, 1,581) −520 (−1,182, 765) <0.001 861 (−174, 2,032) 434 (−378, 1,368) 0.005 492 (−197, 1,747) −199 (−680, 653) <0.001 Z-monocyte 854 (−336, 2,415) 688 (−442, 2,057) 0.260 404 (−607, 1,624) 377 (−406, 1,287) 0.740 21 (−663, 531) 133 (−437, 815) 0.220 NLR 1.92 (1.27, 3.06) 3.43 (2.10, 5.98) <0.001 0.4 (0.2, 0.7) 0.8 (0.5, 1.3) <0.001 0.4 (0.3, 0.5) 0.7 (0.5, 1.0) <0.001 NER 22 (12, 58) 41 (19, 119) <0.001 3.9 (2.2, 8.8) 6.9 (4.2, 13.8) <0.001 4.8 (2.8, 8.0) 10.3 (6.6, 16.9) <0.001 R-hemoglobin 11 (10.3, 11.5) 11.5 (10.9, 12.1) <0.001 10.2 (9.7, 10.9) 11.0 (10.4, 11.6) <0.001 11.1 (10.6, 11.6) 11.6 (11.2, 12.2) <0.001 Z-hemoglobin −1.7 (−2.7, −0.8) −1.5 (−2.2, −1.0) 0.040 −2.5 (−3.5, −1.6) −2.1 (−2.9, −1.4) 0.003 −1.6 (−2.5, −0.9) −1.3 (−1.9, −0.5) 0.006 PLT 384 (314, 466) 328 (275, 395) <0.001 505 (416, 638) 461 (358, 552) <0.001 380 (299, 519) 330 (277, 407) 0.001

CRP 76 (36, 123) 79 (47, 128) 0.200 18 (8, 32) 17 (8, 34) 0.640 0.3 (0.2, 1.2) 0.5 (0.3, 2.1) 0.004

ESR 66 (46, 94) 90 (57, 100) <0.001 70 (48, 98) 88 (65, 112) <0.001 13 (7, 25) 24 (14, 42) <0.001

Table 1. Means and SDs of white cell counts with differential and red cell counts according to ages

Ages White cells (/µL)

Ages Sex Red cells (g/dL)

Total leukocytes Neutrophils Lymphocytes Monocytes Eosinophils Hemoglobins

Mean±SD Mean±SD Mean±SD Mean±SD Mean±SD Mean±SD

1–3 months 10,800±3.63 3,800±2.00 6,000±3.50 700±0.23 300±0.2 1–2 months - 14±2

4–8 months 11,900±2.88 3,800±1.88 7,300±2.34 600±0.23 300±0.2 3–6 months - 11.5±1

9–17 months 11,400±2.88 3,500±1.75 7,000±1.63 600±0.28 300±0.14 6–59 months - 12.5±0.75

18–35 months 10,600±2.75 3,500±1.75 6,300±1.63 500±0.20 300±0.14 60–95 months - 13±0.75

36–59 months 9,100±2.50 3,800±1.75 4,500±1.50 500±0.20 300±0.23 96–143 months - 13.5±0.75

60–83 months 8,500±2.34 4,300±1.63 3,500±1.38 400±0.19 200±0.21 12–14 years M 14±0.75

84–107 months 8,300±2.25 4,400±1.63 3,300±1.33 400±0.21 200±0.25 12–14 years F 13.5±0.75

108–156 months 8,100±2.25 4,400±1.55 3,100±1.25 400±0.22 200±0.24 15–17 years M 15±1

157–221 months 7,800±2.13 4,400±1.55 2,800±1.00 400±0.14 200±0.12 15–17 years F 14±1

≥222 months 7,400±1.63 4,400±1.48 2,500±0.95 400±0.17 200±0.07 - - -

Before correction

(3)

643 https://e-kcj.org https://doi.org/10.4070/kcj.2020.0999

Erratum: Z-values in Infantile Kawasaki Disease

Table 6. Usefulness and comparison of Z in infants and non-infants with KD compared with FC groups in pre-IVIG phase

Variables Infants (n=216) Non-infants (n=757) FC infants vs.

FC non-infants

KD (n=192) FC (n=24) p value * KD (n=667) FC (n=90) p value * p value

Z-leukocyte 0.8 (−0.2, 2.1) −0.7 (−2.3, 1.7) 0.008 0.8 (−0.2, 2.1) 1.4 (0.2, 2.8) <0.001 0.640

Z-neutrophil 2.6 (1.1, 4.0) 0.2 (−1.2, 1.9) <0.001 3.0 (1.1, 4.0) 1.4 (0.2, 2.8) <0.001 0.400 Z-lymphocyte −1.3 (−2.0, −0.5) −1.6 (−3.0, 0.1) 0.700 −1.31 (−2.0, −0.5) −1.7 (−2.3, −1.1) 0.290 0.740 Z-eosinophil 0.1 (−0.9, 1.6) −1.0 (−1.4, 0.7) 0.040 0.1 (−0.9, 1.6) −0.5 (−1.2, 0.8) <0.001 0.340

Z-monocyte 0.9 (−0.3, 2.4) 1.3 (0.3, 2.6) 0.390 0.9 (−0.3, 2.4) 0.7 (−0.4, 2.1) 0.080 0.780

NLR 1.9 (1.3, 3.1) 0.9 (0.4, 1.3) <0.001 1.9 (1.3, 3.1) 3.4 (2.1, 6.0) <0.001 0.002

NER 22 (12, 55) 17 (10, 49) 0.370 22 (12, 55) 41 (19, 119) 0.030 0.004

R-hemoglobin 10.9 (10.3, 11.5) 11.6 (10.4, 11.9) 0.060 10.9 (10.3, 11.5) 11.5 (10.9, 12.1) <0.001 0.020 Z-hemoglobin −1.5 (−2.7, −0.8) −0.0 (−0.1, 0.0) <0.001 −1.5 (−2.7, −0.8) −1.5 (−2.2, −0.7) <0.001 0.740

PLT 384 (314, 466) 304 (185, 388) 0.001 384 (314, 466) 328 (275, 395) <0.001 0.210

CRP 76 (36, 123) 17 (2, 67) <0.001 76 (36, 123) 79 (47, 128) <0.001 0.170

ESR 66 (46, 94) 34 (11, 72) 0.004 66 (46, 94) 90 (57, 100) <0.001 0.350

Table 7. Laboratory characteristics of KD infants compared with KD non-infants in pre-IVIG, post-IVIG, and chronic phases

Variables Pre-IVIG phase Post-IVIG phase Chronic phase

Infants

(n=192) Non-infants

(n=667) p value * Infants

(n=192) Non-infants

(n=667) p value * Infants

(n=192) Non-infants

(n=667) p value * Z-leukocyte 0.8 (−0.2, 2.1) 1.4 (0.2, 2.8) 0.002 −1.0 (−1.8, −0.2) −0.9 (−1.5, −0.1) 0.150 −0.9 (−1.4, −0.4) −0.7 (−1.2, −0.2) 0.020 Z-neutrophil 2.6 (1.1, 4.0) 3.2 (1.7, 5.3) <0.001 −1.0 (−1.4, −0.2) −0.6 (−1.2, 0.3) 0.001 −0.9 (−1.2, −0.6) −0.5 (−0.9, 0.1) <0.001 Z-lymphocyte −1.3 (−2.0, −0.5) −1.7 (−2.3, −1.1) <0.001 −1.1 (−1.7, −0.3) −1.1 (−1.7, −0.6) 0.230 −0.8 (−1.3, −0.3) −0.7 (−1.4, −0.1) 0.710 Z-eosinophil 0.1 (−0.9, 1.6) −0.5 (−1.2, 0.8) <0.001 0.9 (−0.2, 2.0) 0.4 (−0.4, 1.4) 0.005 0.5 (−0.2, 1.7) −0.2 (−0.7, 0.7) <0.001 Z-monocyte 0.9 (−0.3, 2.4) 0.7 (−0.4, 2.1) 0.260 0.4 (−0.6, 1.6) 0.4 (−0.4, 1.3) 0.740 0.0 (−0.7, 0.5) 0.1 (−0.4, 0.8) 0.220 NLR 1.9 (1.3, 3.1) 3.4 (2.1, 6.0) <0.001 0.4 (0.2, 0.7) 0.8 (0.5, 1.3) <0.001 0.4 (0.3, 0.5) 0.7 (0.5, 1.0) <0.001 NER 22 (12, 58) 41 (19, 119) <0.001 3.9 (2.2, 8.8) 6.9 (4.2, 13.8) <0.001 4.8 (2.8, 8.0) 10.3 (6.6, 16.9) <0.001 R-hemoglobin 11 (10.3, 11.5) 11.5 (10.9, 12.1) <0.001 10.2 (9.7, 10.9) 11.0 (10.4, 11.6) <0.001 11.1 (10.6, 11.6) 11.6 (11.2, 12.2) <0.001 Z-hemoglobin −1.7 (−2.7, −0.8) −1.5 (−2.2, −1.0) 0.040 −2.5 (−3.5, −1.6) −2.1 (−2.9, −1.4) 0.003 −1.6 (−2.5, −0.9) −1.3 (−1.9, −0.5) 0.006 PLT 384 (314, 466) 328 (275, 395) <0.001 505 (416, 638) 461 (358, 552) <0.001 380 (299, 519) 330 (277, 407) 0.001

CRP 76 (36, 123) 79 (47, 128) 0.200 18 (8, 32) 17 (8, 34) 0.640 0.3 (0.2, 1.2) 0.5 (0.3, 2.1) 0.004

ESR 66 (46, 94) 90 (57, 100) <0.001 70 (48, 98) 88 (65, 112) <0.001 13 (7, 25) 24 (14, 42) <0.001 Table 1. Means and SDs of white cell counts with differential and red cell counts according to ages

Ages White cells (/µL)

Ages Sex Red cells (g/dL)

Total leukocytes Neutrophils Lymphocytes Monocytes Eosinophils Hemoglobins

Mean±SD Mean±SD Mean±SD Mean±SD Mean±SD Mean±SD

1–3 months 10,800±3,630 3,800±2,000 6,000±3,500 700±230 300±200 1–2 months - 14±2

4–8 months 11,900±2,880 3,800±1,880 7,300±2,340 600±230 300±200 3–6 months - 11.5±1

9–17 months 11,400±2,880 3,500±1,750 7,000±1,630 600±280 300±140 6–59 months - 12.5±0.75

18–35 months 10,600±2,750 3,500±1,750 6,300±1,630 500±200 300±140 60–95 months - 13±0.75

36–59 months 9,100±2,500 3,800±1,750 4,500±1,500 500±200 300±230 96–143 months - 13.5±0.75

60–83 months 8,500±2,340 4,300±1,630 3,500±1,380 400±190 200±210 12–14 years M 14±0.75

84–107 months 8,300±2,250 4,400±1,630 3,300±1,330 400±210 200±250 12–14 years F 13.5±0.75

108–156 months 8,100±2,250 4,400±1,550 3,100±1,250 400±220 200±240 15–17 years M 15±1

157–221 months 7,800±2,130 4,400±1,550 2,800±1,000 400±140 200±120 15–17 years F 14±1

≥222 months 7,400±1,630 4,400±1,480 2,500±950 400±170 200±70 - - -

After correction

수치

Table 1. Means and SDs of white cell counts with differential and red cell counts according to ages
Table 7. Laboratory characteristics of KD infants compared with KD non-infants in pre-IVIG, post-IVIG, and chronic phases

참조

관련 문서

Department of Internal Medicine, Kangbuk Samsung Hospital, Sungkyunkwan University School of Medicine, Seoul, Korea Article: Risk Factors of Delayed Bleeding after

Department of Internal Medicine, Kangbuk Samsung Hospital, Sungkyunkwan University School of Medicine, Seoul, Korea Article: Helicobacter pylori Therapy for the Prevention

2 Department of Dermatology, Kangbuk Samsung Hospital, Sungkyunkwan University School of Medicine, Seoul, Korea. 3 Department of Orthopedic Surgery, Asan Medical Center,

Division of Hematology-Oncology, Department of Internal Medicine, Kangbuk Samsung Hospital, Sungkyunkwan University School of Medicine, 29 Saemunan-ro, Jongno-gu, Seoul 03181,

Department of Psychiatry 6 , Kangbuk Samsung Hospital, College of Medicine, Sungkyunkwan University School of Korea, Seoul,.. Department of Psychiatry 7 , CHA Bundang Medical

8 Department of Neurology, Kangbuk Samsung Hospital, Sungkyunkwan University School of Medicine, Seoul, Korea.. Electrodiagnostic studies such as nerve conduction studies (NCS)

Department of Laboratory Medicine and Genetics 1 , Samsung Medical Center, Sungkyunkwan University School of Medicine, Seoul; Department of Pediatrics 2 , Seoul National

Department of Laboratory Medicine 1 , Kangbuk Samsung Hospital, Sungkyunkwan University School of Medicine, Seoul; Department of Laboratory Medicine and Genetics 2 , Samsung