KJTCVS
The Korean Journal of Thoracic and Cardiovascular SurgeryClinical Research Impact of Sarcopenia on Early Postoperative Complications in Early-Stage Non–Small-Cell Lung Cancer
Jiyun Lee, M.D.
1, Seok Whan Moon, M.D., Ph.D.
1, Jung Suk Choi, M.D.
1, Kwanyong Hyun, M.D.
1, Young Kyu Moon, M.D., Ph.D.
2, Mi Hyoung Moon, M.D., Ph.D.
11
Department of Thoracic and Cardiovascular Surgery, Seoul St. Mary’s Hospital, College of Medicine, The Catholic University of Korea;
2Department of Thoracic and Cardiovascular Surgery, Eunpyeong St. Mary’s Hospital, College of Medicine, The Catholic University of Korea, Seoul, Korea
ARTICLE INFO Received July 10, 2019 Accepted October 30, 2019 Corresponding author Mi Hyoung Moon Tel 82-2-2258-2858 Fax 82-2-594-8644
E-mail [email protected] ORCID
https://orcid.org/0000-0003-2799-4570
Background: Risk assessment for pulmonary resection in patients with early-stage non–
small-cell lung cancer (NSCLC) is important for minimizing postoperative morbidity. De- pletion of skeletal muscle mass is closely associated with impaired nutritional status and limited physical ability. We evaluated the relationship between skeletal muscle depletion and early postoperative complications in patients with early-stage NSCLC.
Methods: Patients who underwent curative lung resection between 2016 and 2018 and who were diagnosed with pathological stage I/II NSCLC were included, and their records were retrospectively analyzed. The psoas volume index (PVI, cm
3/m
3) was calculated based on computed tomography images from routine preoperative positron emission tomogra- phy-computed tomography. Early postoperative complications, defined as those occur- ring within 90 days of surgery, were compared between the lowest sex-specific quartile for PVI and the remaining quartiles.
Results: A strong correlation was found between the volume and the cross-sectional area of the psoas muscle (R
2=0.816). The overall rate of complications was 57.6% among patients with a low PVI and 32.8% among those with a normal-to-high PVI. The most common complication was prolonged air leak (low PVI, 16.9%; normal-to-high PVI, 9.6%), followed by pneumonia (low PVI, 13.6%; normal-to-high PVI, 7.9%) and recurrent pleural effusion (low PVI, 11.9%; normal-to-high PVI, 6.8%). The predictors of overall complications were low PVI (odds ratio [OR], 2.18; 95% confidence interval [CI], 1.07–4.09; p=0.03), low hemoglobin level (OR, 0.686; 95% CI, 0.54–0.87; p=0.002), and smoking history (OR, 3.93;
95% CI, 2.03–7.58; p<0.001).
Conclusion: Low PVI was associated with a higher rate of early postoperative complica- tions in patients with early-stage NSCLC.
Keywords: Sarcopenia, Non–small-cell lung carcinoma, Postoperative complications
Copyright © The Korean Society for Thoracic and Cardiovascular Surgery. 2020. All right reserved.
This is an Open Access article distributed under the terms of the Creative Commons Attribution Non-Commercial License (http://creativecommons.org/licenses/
Introduction
Lung cancer is the most common cause of death from cancer worldwide. In 2013, the estimated global incidence of lung cancer was 1.8 million, and the estimated number of fatalities was 1.6 million [1]. Mortality from lung cancer has slightly decreased in Korea since 2002, but lung cancer remains the leading cause of death from cancer and a ma- jor health threat in Korea. The overall 5-year relative sur- vival rate of lung cancer has improved from 11.2% for men and 14.7% for women among patients diagnosed between
1993 and 1997 to 19.3% for men and 28.2% for women among patients diagnosed between 2008 and 2012 [2,3].
The standard treatment for patients with stage I non–
small-cell lung cancer (NSCLC) is anatomical surgical re- section and appropriate mediastinal lymph node dissec- tion; this treatment renders a chance of cure, with overall documented 5-year survival of up to 75% after surgery [4,5]. Perioperative management has improved over the past decades, but postoperative morbidity still occurs as the patient population ages and the complexity of the pro- cedure increases alongside the more prevalent use of neo-
https://doi.org/10.5090/kjtcs.2020.53.3.93 pISSN: 2233-601X eISSN: 2093-6516
Korean J Thorac Cardiovasc Surg. 2020;53(3):93-103
https://doi.org/10.5090/kjtcs.2020.53.3.93
KJTCVS
adjuvant therapies. Common respiratory complications af- ter lobectomy include prolonged air leak, reported in 15%
to 18% of cases, and pneumonia, reported in up to 6% [6].
Sarcopenia is a recently-defined geriatric syndrome that is characterized by an age-related decline in skeletal muscle mass combined with diminished muscle strength or re- duced physical performance [7]. Sarcopenia is recognized as a predictor of poor surgical outcomes because it is asso- ciated with poor nutritional status and limited physical ac- tivity. Sarcopenia has been found to be associated with prolonged hospitalization and greater requirements of postoperative transfusion in elderly patients with femur fractures [8]. Studies in the field of thoracic surgery have also been performed, and while the effect of body mass in- dex (BMI) as a predictor of surgical outcome remains un- clear, Weig et al. [9] demonstrated that lean muscle mass was a more accurate predictor of postoperative outcome than BMI and that the lean psoas muscle area was a reli- able predictor of surgical outcomes after lung transplanta- tion. The psoas muscle area at the level of the third lumbar vertebra (L3) is commonly measured to assess sarcopenia [10-12]. Assessment of the psoas muscle in patients with lung cancer is hindered since routine preoperative chest computed tomography (CT) usually does not include the lower lumbar area. Additionally, the area of the psoas mus- cle at L3 is not representative of the actual volume of the psoas muscle in every patient.
The purpose of this study was to assess the relationship between the area and the volume of the psoas muscle at L3 and to assess the feasibility of a psoas muscle volume index as a predictor of early postoperative complications after curative resection of early-stage NSCLC.
Methods
Patient cohort
Patients who underwent curative surgery for stage I/II NSCLC between January 2016 and December 2018 were retrospectively enrolled from our institution’s batabase (Seoul St. Mary’s Hospital, Seoul, Republic of Korea) of electronic medical records. We excluded patients who had undergone neoadjuvant therapy, who had pathologic stage III/IV cancer, who had undergone prior surgery for meta- chronous lung cancer, or for whom imaging studies were unavailable. The baseline clinical characteristics and pre- operative bloodwork, including a carcinoembryonic anti- gen assay, as well as pulmonary function tests and imaging studies performed within 30 days prior to surgery were re-
viewed. Early postoperative complications, defined as mor- bidity occurring within 90 days of surgery, were analyzed together as overall complications. Additionally, respiratory complications, including prolonged (>5-day) air leak, re- current pleural effusion, pneumonia, and bronchopleural fistula were analyzed.
This study was approved by the Institutional Review Board of Seoul St. Mary’s Hospital (approval no., KC19RE- SI0452). The requirement of informed consent from indi- vidual patients was waived because the study was a retro- spective database review.
Image analysis
The psoas muscle area was measured at the region of L3 where the transverse process was most well-visualized on axial CT images taken from routine preoperative positron emission tomography-CT (PET-CT) scans. The psoas mus- cle volume was calculated semi-automatically from the lev- el of the diaphragm to the symphysis pubis using image analysis software (Fujifilm SYNAPSE VINCENT; Fujifilm Medical, Tokyo, Japan). Subcutaneous and visceral fat tis- sues were identified, and the psoas muscle mass was calcu- lated based on programmed Hounsfield units with an esti- mated threshold from –200 to –50 and exclusion of the fatty tissues (Fig. 1).
Since muscle mass can vary according to height and body weight, the calculated measurements must be nor- malized. Although there is no consistent method for the normalization of psoas muscle volume, we chose to use the cube of the height. In studies of human dynamics and physics, normalizing volume by the cube of height is the most widely accepted option of the various possible nor- malization methods [13]. Thus, to normalize the cross-sec- tional area, we defined the psoas area index (PAI) as the psoas muscle area at L3 divided by the square of height (m
2), and to normalize the volume, we defined the psoas volume index (PVI) as the psoas muscle volume divided by the cube of height (m
3).
Low-psoas volume index versus normal-to-high psoas volume index groups
Another key determinant of muscle mass is sex. We
stratified the study cohort by sex for the analysis and iden-
tified low-PVI (PVI values in the lowest quartile) and nor-
mal-to-high–PVI (PVI values in the remaining quartiles)
groups for each sex. We chose the lowest quartile as a sep-
arator because there is as yet no well-known threshold for
Jiyun Lee, et al. Sarcopenia in NSCLC KJTCVS
defining sarcopenia by the psoas muscle volume.
Statistical analysis
The primary endpoint of this study was the relationship between PVI and all early (within 90 days of surgery) post-
operative complications and between PVI and respiratory complications. As the secondary endpoint, we explored the relationship between PVI and preoperative pulmonary function, immunological status (neutrophil-to-lymphocyte ratio), and nutritional status via the Geriatric Nutritional Risk Index (GNRI). The GNRI was calculated using serum
Fig. 1. (A–D) Semi-automatic measurement of psoas muscle area and volume using image analysis software (Fujifilm SYNAPSE VIN- CENT; Fujifilm Medical, Tokyo, Japan).
A
C D
B 250
200 150 100 50
400
Area (cm )
2Slide position (slice)
250 300 350
Visceral fat Subcutaneous fat Psoas major muscle Distribution of visceral/subcutancous fat
All visceral fat: 3345.84 cm All subcutaneous fat: 6407.62 cm
3 3
3 3 Body fat percentage: 40.37%
Visceral fat percentage: 32.68%
Psoas major muscle: 416,97cm Part of psoas major muscle: 144.84 cm
0
Belly position
Current position
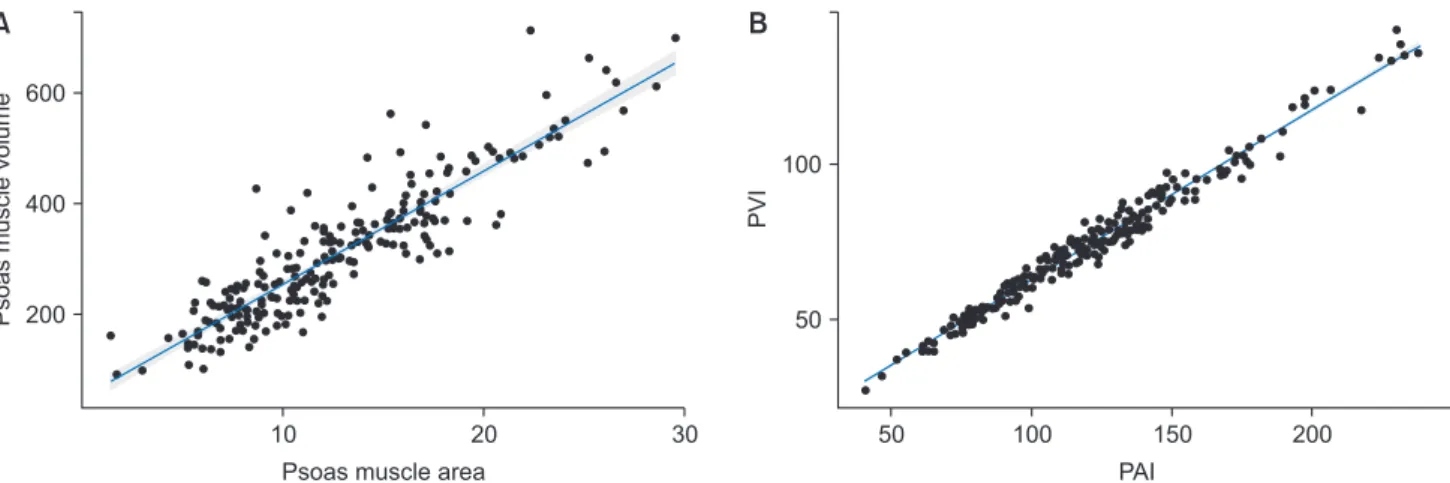
Fig. 2. Scatter plots. (A) The psoas muscle area and volume in the total cohort (R
2=0.816) and (B) the PAI and PVI (R
2=0.743) were pos- itively correlated. PAI, psoas area index; PVI, psoas volume index.
600
400
200
30
Psoas muscle volume
Psoas muscle area 20 10
100
50
200
PVI
PAI 150 100
50
A B
https://doi.org/10.5090/kjtcs.2020.53.3.93
KJTCVS
albumin concentration and body weight as 14.87×serum albumin concentration (g/dL)+41.7×(preoperative weight/
ideal weight [kg]); ideal body weight was calculated as 22×the square of height (m
2) [14,15]. The baseline charac-
teristics were summarized using standard statistical meth- ods, with data presented as mean±standard deviation for continuous variables and as frequencies with percentages for categorial variables. Distributions of continuous vari- ables were compared using the Student t-test or the Mann- Whitney U-test depending on the result of the test of nor- mality. Categorial variables were compared using the chi- square or Fisher exact test. The relationships between the PVI and PAI were assessed using Pearson correlation coef- ficients. The risk factors for overall complications and re- spiratory complications were analyzed using univariate and multivariate logistic regression. Statistical significance was indicated by a 2-sided p-value of <0.05, and variables determined to have statistical significance in the univariate analysis were incorporated into a multivariate model. All statistical analyses were performed with IBM SPSS Statis- tics for Windows ver. 24.0 (IBM Corp., Armonk, NY, USA), and the graphics were constructed using R ver. 3.4.1 (R Project for Statistical Computing, Vienna, Austria).
0.03
0.02
0.01
0.00
150
Density
Psoas muscle volume index
Female Male Sex
100 50
Fig. 3. Distribution of the psoas volume index (volume/height cubed, cm
3/m
3) by sex.
100
50
80
PVI
Age (yr)
50 60 70
40
100
50
6
PVI
FVC (L)
5 3
2
A B
30 4
100
50
PVI
D
LCO(L) 50
0
D
100 100
50
PVI
FEV1 (L)
5 3
2
C
4 1
Fig. 4. Relationship between the PVI and (A) age (R
2=–0.368, p<0.001); (B) FVC (L) (R
2=0.588, p<0.001); (C) FEV1 (L) (R
2=0.619,
p<0.001); and (D) D
LCO(L) (R
2=0.435, p<0.001). PVI, psoas volume index; FVC, forced vital capacity; FEV1, forced expiratory volume
in 1 second; D
LCO, diffusing capacity of carbon monoxide.
Jiyun Lee, et al. Sarcopenia in NSCLC KJTCVS
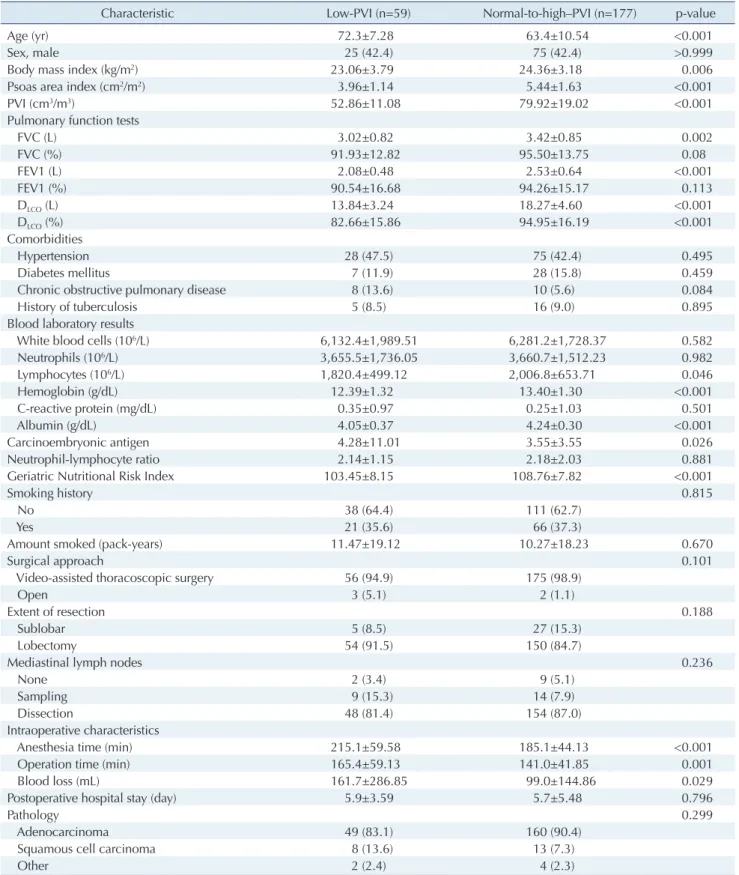
Table 1. Basic characteristics in the low-PVI and normal-to-high–PVI groups
Characteristic Low-PVI (n=59) Normal-to-high–PVI (n=177) p-value
Age (yr) 72.3±7.28 63.4±10.54 <0.001
Sex, male 25 (42.4) 75 (42.4) >0.999
Body mass index (kg/m
2) 23.06±3.79 24.36±3.18 0.006
Psoas area index (cm
2/m
2) 3.96±1.14 5.44±1.63 <0.001
PVI (cm
3/m
3) 52.86±11.08 79.92±19.02 <0.001
Pulmonary function tests
FVC (L) 3.02±0.82 3.42±0.85 0.002
FVC (%) 91.93±12.82 95.50±13.75 0.08
FEV1 (L) 2.08±0.48 2.53±0.64 <0.001
FEV1 (%) 90.54±16.68 94.26±15.17 0.113
D
LCO(L) 13.84±3.24 18.27±4.60 <0.001
D
LCO(%) 82.66±15.86 94.95±16.19 <0.001
Comorbidities
Hypertension 28 (47.5) 75 (42.4) 0.495
Diabetes mellitus 7 (11.9) 28 (15.8) 0.459
Chronic obstructive pulmonary disease 8 (13.6) 10 (5.6) 0.084
History of tuberculosis 5 (8.5) 16 (9.0) 0.895
Blood laboratory results
White blood cells (10
6/L) 6,132.4±1,989.51 6,281.2±1,728.37 0.582
Neutrophils (10
6/L) 3,655.5±1,736.05 3,660.7±1,512.23 0.982
Lymphocytes (10
6/L) 1,820.4±499.12 2,006.8±653.71 0.046
Hemoglobin (g/dL) 12.39±1.32 13.40±1.30 <0.001
C-reactive protein (mg/dL) 0.35±0.97 0.25±1.03 0.501
Albumin (g/dL) 4.05±0.37 4.24±0.30 <0.001
Carcinoembryonic antigen 4.28±11.01 3.55±3.55 0.026
Neutrophil-lymphocyte ratio 2.14±1.15 2.18±2.03 0.881
Geriatric Nutritional Risk Index 103.45±8.15 108.76±7.82 <0.001
Smoking history 0.815
No 38 (64.4) 111 (62.7)
Yes 21 (35.6) 66 (37.3)
Amount smoked (pack-years) 11.47±19.12 10.27±18.23 0.670
Surgical approach 0.101
Video-assisted thoracoscopic surgery 56 (94.9) 175 (98.9)
Open 3 (5.1) 2 (1.1)
Extent of resection 0.188
Sublobar 5 (8.5) 27 (15.3)
Lobectomy 54 (91.5) 150 (84.7)
Mediastinal lymph nodes 0.236
None 2 (3.4) 9 (5.1)
Sampling 9 (15.3) 14 (7.9)
Dissection 48 (81.4) 154 (87.0)
Intraoperative characteristics
Anesthesia time (min) 215.1±59.58 185.1±44.13 <0.001
Operation time (min) 165.4±59.13 141.0±41.85 0.001
Blood loss (mL) 161.7±286.85 99.0±144.86 0.029
Postoperative hospital stay (day) 5.9±3.59 5.7±5.48 0.796
Pathology 0.299
Adenocarcinoma 49 (83.1) 160 (90.4)
Squamous cell carcinoma 8 (13.6) 13 (7.3)
Other 2 (2.4) 4 (2.3)
(Continued on next page)
https://doi.org/10.5090/kjtcs.2020.53.3.93
KJTCVS
Results
General characteristics of patients and psoas muscle profile
A total of 236 patients with pathologic stage I/II NSCLC who underwent curative pulmonary resection during the study period were eligible. Video-assisted thoracoscopic surgery was the predominant surgical approach (n=231, 97.9%). Common characteristics of the patients included adenocarcinoma (n=175, 74.2%), pathologic stage IA1-3 ac- cording to the 8th edition of tumor-node-metastasis stag- ing system (n=151, 64.0%), pathologic stage N0 according to the same system (n=223, 94.5%), and lobectomy (n=204, 86.4%).
We assessed the relationship between psoas muscle area and volume based on the semi-automatic CT measure- ments of the psoas muscle area and volume at L3 (Fig. 2). A
strong correlation between the 2 parameters (R
2=0.816, p<0.001) was found and persisted after normalization (R
2=0.743; p<0.001 for PAI and PVI).
Characteristics of the low- and normal-to-high–
psoas volume index groups
The distribution of PVI by sex is shown in Fig. 3. We di- vided the cohort into 2 groups, according to the threshold separating the lowest quartile for sex-specific PVI (men, 71.37; women, 51.87) from the higher quartiles. The age at operation showed a weakly negative correlation with the PVI (R
2=–0.368, p<0.001) (Fig. 4A). The 2 groups are com- pared in Table 1. The PAI (cm
2/m
2) was 3.96±1.14 in the low-PVI group and 5.44±1.63 in the normal-to-high–PVI group. The PVI (cm
3/m
3) was 52.86±11.08 in the low-PVI group and 79.92±19.02 in the normal-to-high–PVI group.
In the low-PVI group, the patients were older (p<0.001) Table 1. Continued
Characteristic Low-PVI (n=59) Normal-to-high–PVI (n=177) p-value
Grade 0.581
Well 19 (34.5) 61 (36.5)
Moderately 26 (47.3) 85 (50.9)
Poorly 10 (18.2) 21 (12.6)
Lymphatic invasion 23 (39.0) 53 (30.1) 0.208
Vascular invasion 7 (11.9) 16 (9.1) 0.535
TNM staging (AJCC 8th edition) 0.826
Stage 0 1 (1.7) 2 (1.1)
Stage IA1 10 (16.9) 26 (14.7)
Stage IA2 14 (23.7) 59 (33.3)
Stage IA3 10 (16.9) 32 (18.1)
Stage IB 12 (20.3) 32 (18.1)
Stage IIA 2 (3.4) 3 (1.7)
Stage IIB 7 (11.9) 19 (10.7)
Stage IIIA 3 (5.1) 4 (2.3)
T stage (AJCC 8th edition) 0.840
Tis, T1 (mi) 5 (8.5) 15 (8.5)
T1a 6 (10.2) 13 (7.3)
T1b 15 (25.4) 60 (33.9)
T1c 11 (18.6) 35 (19.8)
T2a 13 (22.0) 34 (19.2)
T2b 3 (5.1) 4 (2.3)
T3 4 (6.8) 13 (7.3)
T4 2 (3.4) 3 (1.7)
N stage (AJCC 8th edition) 0.249
N0 54 (91.5) 169 (95.5)
N1 5 (8.5) 8 (4.5)
Adjuvant chemotherapy 4 (6.8) 23 (13.0) 0.194
Values are presented as mean±standard deviation or number (%).
PVI, psoas volume index; FVC, forced vital capacity; FEV1, forced expiratory volume in 1 second; D
LCO, diffusing capacity for carbon monoxide;
TNM, tumor-node-metastasis; AJCC, American Joint Committee on Cancer.
Jiyun Lee, et al. Sarcopenia in NSCLC KJTCVS
and had a lower BMI (p=0.006), lower hemoglobin and al- bumin levels (p<0.001 for both), and poorer nutritional status, as reflected by a lower GNRI (p<0.001), than the pa- tients in the normal-to-high group. Patients in the low-PVI group also had lower forced vital capacity (p=0.002), lower forced expiratory volume in 1 second (FEV1, p<0.001), and lower diffusing capacity for carbon monoxide (D
LCO, p<0.001) than those in the normal-to-high–PVI group (Fig.
4). There were no significant differences in the distribution of sex, history of tuberculosis or malignancy, type of oper- ation, pathologic profile or stage of tumor, or length of postoperative hospital stay.
Early postoperative complications
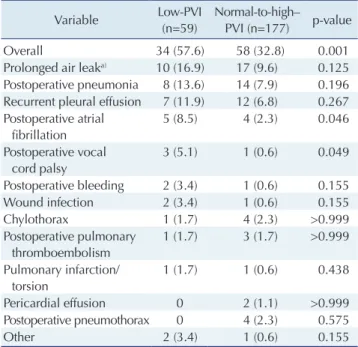
The rate of all complications for the entire cohort was 39%, and the rate of respiratory complications was 27.1%.
More complications were present in the low-PVI group (p=0.001) (Table 2), and postoperative atrial fibrillation (p=0.046) and vocal cord palsy (p=0.049) were significant- ly more frequent among patients with low PVI. Although statistically insignificant, prolonged air leaks, postopera- tive pneumonia, recurrent pleural effusion, and wound in- fection were also more frequently observed in the low-PVI group.
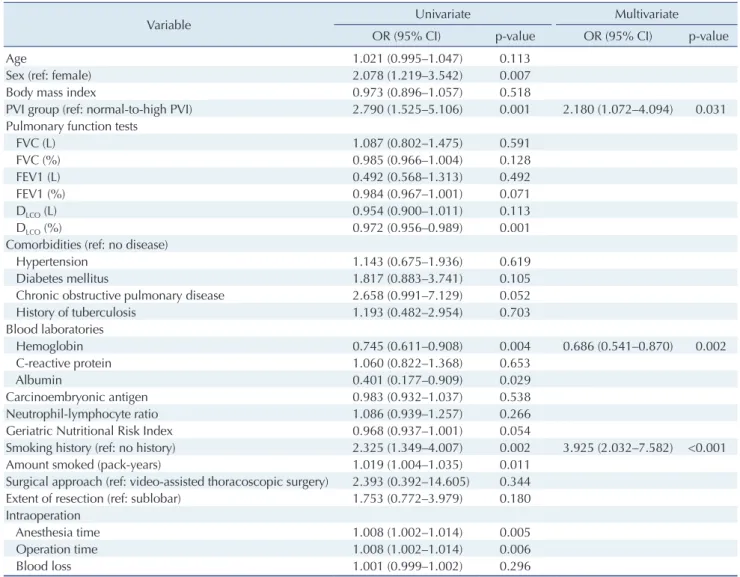
Risk factors for overall and respiratory complications
Univariate and multivariate logistic regression analyses were performed to identify potential risk factors for overall complications and for respiratory complications. On the univariate analysis for overall complications, male sex (OR, 2.078; p=0.007), low PVI (OR, 2.79; p=0.001), smoking his- tory (OR, 1.019; p=0.002), and longer operation time (OR, 1.008; p=0.006) were associated with increased risk of complications, while high hemoglobin level (OR, 0.745;
p=0.004), high albumin level (OR, 0.401; p=0.538), and high D
LCO(OR, 0.972; p=0.001) were associated with de- creased risk (Table 3). Multivariate analysis found that low PVI (OR, 2.180; p=0.031) and preoperative hemoglobin level (OR, 0.686; p=0.002) were the strongest predictors of early postoperative complications.
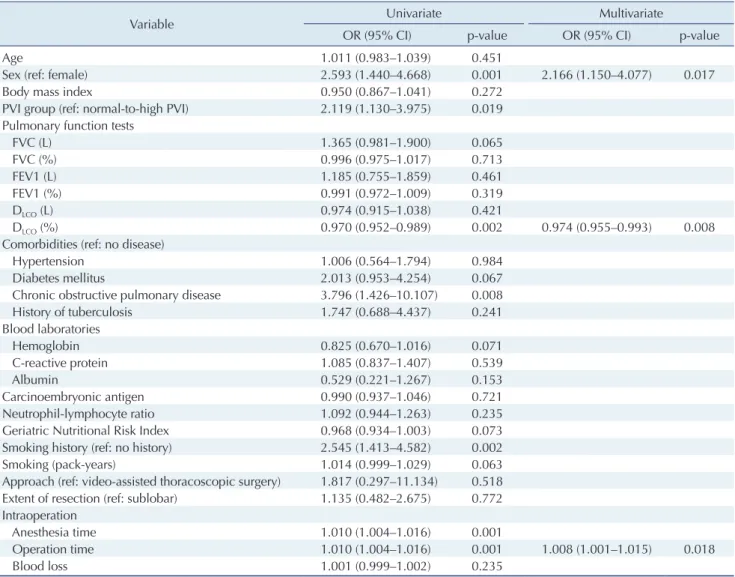
We performed the same analyses focusing on only respi- ratory complications (Table 4). Univariate analysis showed an association between complication risk and male sex (OR, 2.593; p=0.001), low PVI (OR, 2.119; p=0.019), chron- ic obstructive pulmonary disease (OR, 3.796; p=0.008), smoking history (OR, 2.545; p=0.002), and longer opera-
tion time (OR, 1.010; p=0.001). High D
LCO(OR, 0.970; p=
0.002) was associated with a lower risk of respiratory mor- bidities. On multivariate analysis, only male sex (OR, 2.166;
p=0.017) and a longer operation time (OR, 1.008; p=0.018) were associated with increased risk, and high D
LCO(OR, 0.974; p=0.008) remained associated with a decreased risk of respiratory morbidities in the early postoperative period.
Discussion
Outcomes after lung cancer surgery and predictors thereof have been extensively reported [16], and several well-known predictors have been identified, namely age, male sex, pneumonectomy, low FEV1, and pre-existing co- morbidities [17-19]. With the changing profiles of patient populations, efforts to define preoperative risk factors have been increasingly focused on patient characteristics, main- ly cardiac and respiratory reserve. As the population ages, much interest has been placed in assessing frailty and its relation to surgical outcomes. Frailty is characterized by decreased reserve and resistance to stressors resulting from cumulative declines across multiple physiological systems, causing vulnerability to adverse outcomes [20]. Decreased muscle mass is a result of frailty, and it is also a clinical marker in the assessment of frailty [21].
Table 2. Distribution of early postoperative complications within 90 days after surgery
Variable Low-PVI
(n=59)
Normal-to-high–
PVI (n=177) p-value
Overall 34 (57.6) 58 (32.8) 0.001
Prolonged air leak
a)10 (16.9) 17 (9.6) 0.125 Postoperative pneumonia 8 (13.6) 14 (7.9) 0.196 Recurrent pleural effusion 7 (11.9) 12 (6.8) 0.267 Postoperative atrial
fibrillation
5 (8.5) 4 (2.3) 0.046
Postoperative vocal cord palsy
3 (5.1) 1 (0.6) 0.049
Postoperative bleeding 2 (3.4) 1 (0.6) 0.155
Wound infection 2 (3.4) 1 (0.6) 0.155
Chylothorax 1 (1.7) 4 (2.3) >0.999
Postoperative pulmonary thromboembolism
1 (1.7) 3 (1.7) >0.999 Pulmonary infarction/
torsion
1 (1.7) 1 (0.6) 0.438
Pericardial effusion 0 2 (1.1) >0.999
Postoperative pneumothorax 0 4 (2.3) 0.575
Other 2 (3.4) 1 (0.6) 0.155
Values are presented as number (%).
PVI, psoas volume index.
a)