ISSN 2234-3806 • eISSN 2234-3814
https://doi.org/10.3343/alm.2020.40.3.245
Reporting Quality of Diagnostic Accuracy Studies in Laboratory Medicine: Adherence to Standards for Reporting of Diagnostic Accuracy Studies (STARD) 2015
Mi-Ae Jang , M.D., Ph.D.1,*, Bohyun Kim , M.D., Ph.D.2,*, and You Kyoung Lee , M.D., Ph.D.1
1Department of Laboratory Medicine and Genetics, Soonchunhyang University Bucheon Hospital, Soonchunhyang University College of Medicine, Bucheon, Korea; 2Department of Laboratory Medicine, Soonchunhyang University Cheonan Hospital, Soonchunhyang University College of Medicine, Cheonan, Korea
Background: Poor reporting quality in diagnostic accuracy studies hampers an adequate judgment of the validity of the study. The Standards for Reporting of Diagnostic Accuracy Studies (STARD) statement was published to improve the reporting quality of diagnostic accuracy studies. This study aimed to evaluate the adherence of diagnostic accuracy stud- ies published in Annals of Laboratory Medicine (ALM) to STARD 2015 and to identify di- rections for improvement in the reporting quality of these studies.
Methods: Two independent authors assessed articles published in ALM between 2012–
2018 for compliance with 30 STARD 2015 checklist items to identify all eligible diagnostic accuracy studies published during this period. We included 66 diagnostic accuracy stud- ies. A total of the fulfilled STARD items were calculated, and adherence was analyzed on an individual-item basis.
Results: The overall mean±SD number of STARD items reported for the included studies was 11.2±2.7. Only five (7.6%) studies adhered to more than 50% of the 30 items. No study satisfied more than 80% of the items. Large variability in adherence to reporting standards was detected across items, ranging from 0% to 100%.
Conclusions: Adherence to STARD 2015 is suboptimal among diagnostic accuracy stud- ies published in ALM. Our study emphasizes the necessity of adherence to STARD to im- prove the reporting quality of future diagnostic accuracy studies to be published in ALM.
Key Words: Adherence, Annals of Laboratory Medicine, Diagnostic test, Laboratory, Stan- dards for reporting of diagnostic accuracy
Received: May 19, 2019
Revision received: August 23, 2019 Accepted: November 22, 2019 Corresponding author:
You Kyoung Lee, M.D., Ph.D.
Department of Laboratory Medicine and Genetics, Soonchunhyang University Bucheon Hospital, Soonchunhyang University College of Medicine, 170 Jomaru-ro, Wonmi-gu, Bucheon 14587, Korea Tel: +82-32-621-5941
Fax: +82-032-621-5944.
E-mail: [email protected]
* These authors contributed equally to this study.
© Korean Society for Laboratory Medicine This is an Open Access article distributed under the terms of the Creative Commons Attribution Non-Commercial License (http://creativecom- mons.org/licenses/by-nc/4.0) which permits unrestricted non-commercial use, distribution, and reproduction in any medium, provided the original work is properly cited.
INTRODUCTION
Diagnostic tests are indispensable in clinical practice as they in- form clinicians about the likelihood that a patient has the sus- pected target disease or condition and guide subsequent deci- sions on further testing or treatment [1]. Accuracy is an impor- tant feature of any diagnostic testing, and diagnostic accuracy is
evaluated by comparing results of the test of interest (index test) with those of a reference standard in a series of patients sus- pected of having a target condition. The results are typically ex- pressed in measures, such as sensitivity and specificity, positive and negative predictive values, likelihood ratios, and area under the receiver operating characteristic (ROC) curve [2-4]. Diag- nostic accuracy studies are at risk of several types of bias, which
2017-03-16 https://crossmark-cdn.crossref.org/widget/v2.0/logos/CROSSMARK_Color_square.svg
is a systematic difference in an observed measurement from the true value [5]. Major sources of bias in diagnostic accuracy studies include methodological deficiencies in participant selec- tion and applicability, data collection, test execution and inter- pretation, and data analysis [5, 6]. In addition, diagnostic accu- racy studies are often not reported completely [7], which hin- ders a reader’s ability to evaluate the risk of bias and to deter- mine the generalizability of the study findings, and limits repro- ducibility.
In 2003, Standards for Reporting of Diagnostic Accuracy (STARD), composed of a list of 25 essential items that should be reported in every study report, were published to increase the transparency and completeness of reporting diagnostic ac- curacy studies [8, 9]. STARD are general guidelines designed to be applied to all types of diagnostic accuracy studies rather than focusing on specific issues or categories of medical tests [2-4].
This includes prognostic studies that could classify patients based on future events, monitoring studies that require testing to detect or predict an adverse event or lack of response, and studies that assess treatment selection markers [2-4]. The STARD initiative has been adopted by more than 200 journals, spanning basic research to medicine [5]. In 2015, the STARD guidelines were updated [2-4], and the essential items were in- creased to 30. The new standard covers the title (item 1), ab- stract (item 2), introduction (items 3 and 4), methods (items 5–18), results (items 19–25), and discussion (items 26 and 27), and requires additional information (items 28–30) about the study protocol and funding sources [2-4]. Since the publication of STARD, several evaluations have shown modest improvements in reporting diagnostic accuracy research [10-12].
Annals of Laboratory Medicine (ALM; ISSN 2234-3806) is the official journal of Korean Society for Laboratory Medicine and is indexed both in Medline and PubMed [13]. Since its name was changed from Korean Journal of Laboratory Medicine (ISSN 1598-6535) to ALM in 2012, it has consistently published nu- merous articles in various fields, including diagnostic hematol- ogy, clinical chemistry, clinical microbiology, diagnostic immu- nology, transfusion medicine, diagnostic genetics, laboratory in- formatics, and general laboratory medicine [13]. However, STARD have not been included in the instructions for authors by ALM.
The level of adherence of laboratory diagnostic accuracy stud- ies to STARD 2015 is unknown in Korea. Assessing the basic status of adherence to STARD is critical and would enable us to determine and improve existing deficiencies. Thus, this study aimed to evaluate adherence of diagnostic accuracy studies pub- lished in ALM from inception in 2012 to 2018 to STARD 2015.
MATERIALS AND METHODS
Study selectionThis was a cross-sectional study that evaluated all research pa- pers published in ALM between 2012 and 2018 without distin- guishing publication before or after STARD 2015 announce- ment. Studies for assessing the adherence to STARD 2015 were selected if they met the following inclusion criteria: (1) the diag- nostic accuracy of one or more laboratory index tests was evalu- ated against a reference standard in human subjects and (2) at least one estimate of diagnostic accuracy, such as sensitivity, specificity, positive and negative predictive values, and ROC curve, was reported. We excluded studies, in which the index test or reference standard test was not clear, studies that com- pared index tests, studies that verified analytical performance, multivariable prediction model study, and letters. Two authors (M.A.J. and B.K.) independently screened the titles and abstracts of all the retrieved studies to evaluate their potential relevance.
The full texts of all potentially relevant studies were assessed in duplicate. If an article was considered potentially eligible by at least one author, the full text was assessed independently by both authors against the inclusion criteria. Disagreements were discussed and resolved in consensus meetings.
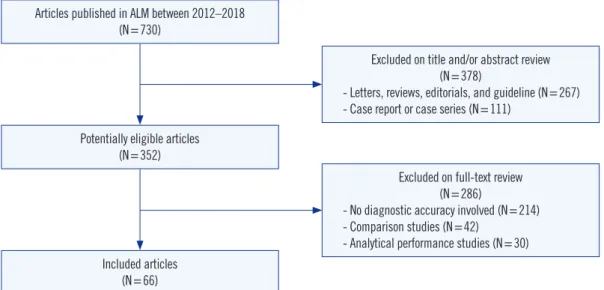
Seven hundred thirty studies were published in ALM between 2012 and 2018, of which 352 were deemed potentially eligible after screening (Fig. 1). The excluded articles were letters (N=
232), case reports or series (N=111), review articles (N=29), editorials (N =5), or guidelines (N =1). After reviewing the full texts, 66 (9.0%, 66/730) diagnostic accuracy studies were in- cluded in the final analysis (Supplemental Data Table S1). The selection process is illustrated in Fig. 1.
Adherence to STARD 2015
The STARD 2015 list consists of 30 essential items grouped in six sections: title and abstract, introduction, methods, results, discussion, and other information [2-4]. Several STARD 2015 items have more than one sub-item. For example, item 2 (struc- tured abstract) is divided into 10 sub-items (2a, identification as a diagnostic accuracy study; 2b, study objectives; 2c, data col- lection; 2d, eligibility criteria; 2e, selection of participants; 2f, description of the index test and reference standard; 2g, num- bers of participants with and without the target condition; 2h, estimates of diagnostic accuracy and precision; 2i, general in- terpretation of the results; and 2j, implications for practice) [14]
that are scored independently. Items 10, 12, and 13 on the meth- ods section comprise two sub-items applicable to the index test
(10a, 12a, and 13a) and to the reference standard (10b, 12b, and 13b). Among them, sub-items 12a and 12b on test result cut-off or category are further subdivided into more specific items for definition and rationale (12a, definition; 12a, rationale; 12b, definition; and 12b, rationale). In addition to the above items, we identified potentially relevant contents in an item that might be helpful when analyzed in detail. For example, item 3 (scien- tific and clinical background in the introduction) was divided into two sub-items (3a for intended use and 3b for clinical role of index test) for more detailed analysis.
Fulfillment of an item was recorded as 1 point. Items with multiple sub-items were scored with fractional points for each sub-item, adding up to a maximum total of 1 point. For exam- ple, the 10 sub-items of item 2 were recorded as 0.1 point each.
Thus, the total maximum score was 30 points (i.e. it ranged from 0 – none of the items sufficiently reported, to 30 – all items suf- ficiently reported). Data analysis and the scoring method largely followed practices established in similar previous studies [10, 15, 16]. Detailed descriptions of compliance with STARD 2015 are given in Supplemental Data Table S2.
Each study was evaluated by two independent authors (M.A.J.
and B.K.). To ensure high agreement among authors on each item, they first received an educational session on reviewing STARD 2015 and related literature. We referred to a document providing an explanation and elaboration of STARD 2015 for a detailed rationale behind the rating of each item [17]. Before STARD scoring, we conducted pilot scoring on three diagnostic accuracy studies, and refined the description of each item and
prepared a final data extraction form based on several discus- sions. Discrepancies between the two authors were resolved through discussions in consensus meetings and during a final review by a third expert (Y.K.L).
Statistical analysis
The overall mean number of STARD items reported were deter- mined. The two authors’ (M.A.J. and B.K.) agreement on com- pliance with the assessment for STARD 2015 was evaluated based on Cohen’s kappa coefficient as follows: <0.00, poor;
0.00–0.20, slight; 0.21–0.40, fair; 0.41–0.60, moderate; 0.61–
0.80, substantial; and 0.81–1.00, almost perfect [18]. One-way analysis of variance was used to compare fulfilled STARD items of the diagnostic accuracy studies published in ALM by year.
Statistical analysis was conducted using SPSS Statistics for Win- dows version 25.0 (IBM Corp., Armonk, NY, USA). A two-sided P <0.05 was considered statistically significant.
RESULTS
Overall adherence to STARD 2015
Characteristics of the articles included for final analysis are sum- marized in Table 1. The overall mean (SD) number of STARD item for the 66 diagnostic accuracy studies in ALM was 11.2±2.7 (Table 1). Inter-author agreement in compliance assessment for STARD 2015 was almost perfect, with a kappa value of 0.9. Only five (7.6%) studies reported more than 50% of the 30 items (to- tal fulfilled STARD items>15). No study satisfied more than 80%
Fig. 1. Flow chart showing the selection procedure for diagnostic accuracy study reports published in Annals of Laboratory Medicine (ALM) between 2012 and 2018 in this study.
Articles published in ALM between 2012–2018 (N=730)
Potentially eligible articles (N=352)
Included articles (N=66)
Excluded on title and/or abstract review (N=378)
- Letters, reviews, editorials, and guideline (N=267) - Case report or case series (N=111)
Excluded on full-text review (N=286)
- No diagnostic accuracy involved (N=214) - Comparison studies (N=42)
- Analytical performance studies (N=30)
of the items (total fulfilled STARD items>24). The fulfilled num- ber of STARD items were not significantly different from year to year.
Item-specific adherence to STARD 2015
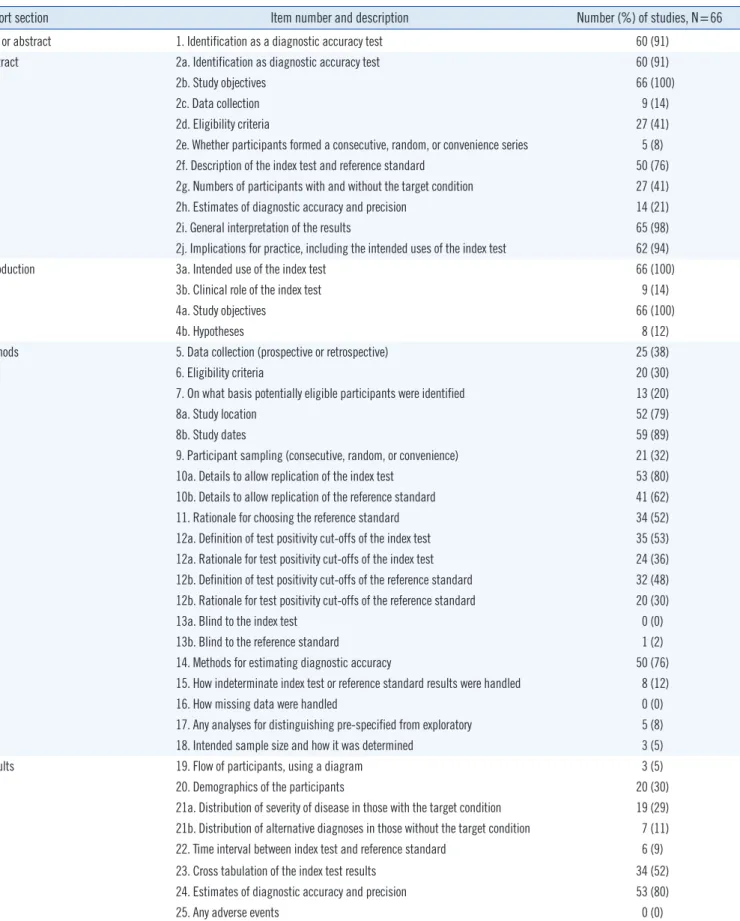
Item-by-item adherence of the 66 diagnostic accuracy studies in ALM to the STARD 2015 is summarized in Table 2. Overall, adherence to STARD 2015 for each item varied widely, ranging from 0% to 100%. Eleven items or sub-items were reported in more than 80% of the studies: title or abstract (item 1), abstract (items 2a, 2b, 2i, and 2j), introduction (items 3a and 4a), meth- ods (items 8b and 10a), results (item 24), and discussion (item 27a). Three of these items were reported in all studies (items 2b, 3a, and 4a).
Conversely, 23 STARD items or sub-items were adhered to
<30% of the studies: abstract (items 2c, 2e, and 2h), introduc- tion (items 3b and 4b), methods (items 6, 7, 12b, 13a, 13b, 15, 16, 17, and 18), results (items 19, 20, 21a, 21b, 22, and 25), discussion (item 27b), and other information (items 28 and 29).
None of the studies showed adherence to items 13a, 16, or 25.
DISCUSSION
We investigated the adherence of diagnostic accuracy studies published in ALM between 2012 and 2018 to STARD 2015. The reporting quality of diagnostic accuracy studies was suboptimal, with an overall STARD adherence of only 37.3% (11.2/30 items) and high variability across items.
In comparison with previous assessments of adherence to STARD 2015, the average number of STARD items reported in the current study is low. In 2017, Michelessi, et al. [19] reported an adherence of 54.1% (16.8/31 items) in studies on glaucoma.
In 2018, Hong, et al. [20] reported a higher adherence in their evaluation of imaging studies assessing accuracy (55.3%, 16.6/30 items) [20]. A systematic review of 90 laboratory diagnostic ac- curacy studies on tuberculosis, malaria, and HIV revealed an overall STARD adherence of 54.4% (13.6/25 items) [11, 21].
Another study of imaging and laboratory diagnostic accuracy studies revealed a high adherence rate of 61.2% (15.3/25 items) [10]. Choi, et al. [16] identified a substantially higher adherence among 63 imaging studies (74%, 20/27 items). Therefore, we believe that differences in research fields do not explain differ- ences in adherence to STARD. Rather, we hypothesize that the fact that ALM does not require authors to adhere to STARD ac- counts for the low adherence observed in the current study. Pre- vious studies have shown that the numbers of reported STARD items are higher in STARD-adopting than those in non-adopting journals [10, 20].
Several STARD items have been infrequently reported and are in need of improvement. In the introduction of a scientific study, the authors should describe the intended use and clinical role of the index test under evaluation (items 3a and 3b), and study objectives and testable hypotheses (items 4a and 4b). The clini- cal role of the index test refers to its anticipated position relative to other existing tests, such as a triage, add-on, or replacement [17]. Hypotheses are defined as acceptance criteria for a single test, such as the minimum level of sensitivity or specificity, which guide the calculation of the sample size required for the study [8]. Only 14% and 12% of the diagnostic accuracy studies in ALM properly reported the clinical role of the test and hypothe- sis, respectively (Table 2). In addition, several items related to participants, such as items 7, 9, 19, 20, 21, and 22, were poorly reported in more than two-thirds of the studies. This information is important because test performance is not fixed and may vary in different settings and among patients with different character- istics [5, 22].
Data analysis was also often poorly reported. For example, Table 1. Characteristics of diagnostic accuracy studies published in
ALM between 2012 and 2018 and adherence to STARD 2015 Characteristic Number (%) of
studies Mean STARD items reported (±SD)
Total 66 (100.0) 11.2±2.7
Discipline category
Clinical microbiology 37 (56.1) 10.1±2.3
Diagnostic immunology 11 (16.7) 12.2±2.2
Clinical chemistry 8 (12.1) 14.6±2.0
Diagnostic hematology 7 (10.6) 11.6±2.0
General laboratory medicine 2 (3.0) 13.0±2.1
Diagnostic genetics 1 (1.5) NA
Publication type
Original article 55 (83.3) 11.5±2.7
Brief communication 11 (16.7) 9.9±2.2
Publication year
2012 8 (12.1) 10.2±2.1
2013 10 (15.2) 11.3±2.3
2014 7 (10.6) 9.9±2.3
2015 12 (18.2) 10.2±2.4
2016 7 (10.6) 11.5±3.4
2017 10 (15.2) 11.6±2.4
2018 12 (18.2) 13.1±2.9
Abbreviations: ALM, Annals of Laboratory Medicine; NA, not applicable;
STARD, Standards for Reporting of Diagnostic Accuracy.
Table 2. Adherence to individual STARD 2015 items
Report section Item number and description Number (%) of studies, N=66
Title or abstract 1. Identification as a diagnostic accuracy test 60 (91)
Abstract 2a. Identification as diagnostic accuracy test 60 (91)
2b. Study objectives 66 (100)
2c. Data collection 9 (14)
2d. Eligibility criteria 27 (41)
2e. Whether participants formed a consecutive, random, or convenience series 5 (8)
2f. Description of the index test and reference standard 50 (76)
2g. Numbers of participants with and without the target condition 27 (41)
2h. Estimates of diagnostic accuracy and precision 14 (21)
2i. General interpretation of the results 65 (98)
2j. Implications for practice, including the intended uses of the index test 62 (94)
Introduction 3a. Intended use of the index test 66 (100)
3b. Clinical role of the index test 9 (14)
4a. Study objectives 66 (100)
4b. Hypotheses 8 (12)
Methods 5. Data collection (prospective or retrospective) 25 (38)
6. Eligibility criteria 20 (30)
7. On what basis potentially eligible participants were identified 13 (20)
8a. Study location 52 (79)
8b. Study dates 59 (89)
9. Participant sampling (consecutive, random, or convenience) 21 (32)
10a. Details to allow replication of the index test 53 (80)
10b. Details to allow replication of the reference standard 41 (62)
11. Rationale for choosing the reference standard 34 (52)
12a. Definition of test positivity cut-offs of the index test 35 (53) 12a. Rationale for test positivity cut-offs of the index test 24 (36) 12b. Definition of test positivity cut-offs of the reference standard 32 (48) 12b. Rationale for test positivity cut-offs of the reference standard 20 (30)
13a. Blind to the index test 0 (0)
13b. Blind to the reference standard 1 (2)
14. Methods for estimating diagnostic accuracy 50 (76)
15. How indeterminate index test or reference standard results were handled 8 (12)
16. How missing data were handled 0 (0)
17. Any analyses for distinguishing pre-specified from exploratory 5 (8)
18. Intended sample size and how it was determined 3 (5)
Results 19. Flow of participants, using a diagram 3 (5)
20. Demographics of the participants 20 (30)
21a. Distribution of severity of disease in those with the target condition 19 (29) 21b. Distribution of alternative diagnoses in those without the target condition 7 (11)
22. Time interval between index test and reference standard 6 (9)
23. Cross tabulation of the index test results 34 (52)
24. Estimates of diagnostic accuracy and precision 53 (80)
25. Any adverse events 0 (0)
(Continued to the next page)
handling of indeterminate (item 15) or missing (item 16) data was reported in 12% and 0% of the studies, respectively. Analy- ses of variability in diagnostic accuracy were reported in only 8%
of studies, and only 5% of the studies reported the intended sample size and how it was determined. Indeterminate or miss- ing data are common in all types of biomedical researches [17, 23, 24]. Missing data can occur in index or reference standard testing and pose a challenge when evaluating the performance of a diagnostic test [17]. The source of funding, including the role of the funder (item 30), was reported in 65% of the studies.
Frequently, authors did report the source of funding, but did not describe the role of the funder. Registration number and name of registry (item 28) as well as full study protocol details (item 29) were reported in only 5% of the studies.
Diagnostic accuracy studies are sensitive to a number of unique sources of bias [5, 25]. Bias can occur at several stages, includ- ing the study population, test protocol, reference standard and verification process, and interpretation and analysis [22, 25, 26].
We identified several common biases in the diagnostic accuracy reports in ALM. First, spectrum bias (related to STARD items 6–9), which arises from differences in demographic features or disease severity, and bias in patient selection occurred frequently [22, 25, 26]. In a study evaluating the performance of a hepati- tis C virus (HCV) rapid antibody test, the authors recruited 137 patients diagnosed as having HCV infection and 300 healthy blood donors, and reported a sensitivity of 97.8% and specificity of 100% [27]. We would expect the diagnostic accuracy to be greater in this study because it was conducted in patients with confirmed rather than suspected disease, as the former are en- countered more often in practice. Therefore, data obtained from studies in populations with significant differences in disease se- verity may not be comparable [5].
Second, partial verification bias (data for only a selected sam- ple of patients who underwent the index test are verified by the reference standard, related to STARD items 16 and 19) was
also common [22, 25]. For example, in one study, monoplex PCR was used as a reference test for some selected samples (17%, 74/426 samples) that showed discrepancies between two index multiplex PCR tests to detect 16 respiratory viruses [28], indicating partial verification bias. Such a bias might in- crease the probability of falsely elevated sensitivity and falsely decreased specificity [5]. Third, incorporation bias (the result of the index test is included as a criterion for the reference stan- dard, related to STARD item 11) can be observed at the inter- pretation stage [5, 25]. For example, in a study on molecular detection of human papillomavirus (HPV), the authors calcu- lated the sensitivity and specificity of each index test based on consensus HPV results between the three index tests [29]. One study reported higher sensitivity and lower specificity in the pres- ence of incorporation bias [30]. In the era of evidence-based medicine, researchers should recognize the importance of bi- ases and try to avoid their common sources. Furthermore, re- searchers should mention potential sources of bias in the dis- cussion section (related to STARD item 26) to inform the reader of the limitations of their study and to accurately present the re- sults and conclusions of the study [17].
The current study has several limitations: (1) we evaluated only 66 diagnostic accuracy studies, (2) since the articles evalu- ated were published in a single journal, findings cannot be gen- eralized to reports in other journals, (3) no further analysis was performed on specific features such as study purpose, test ar- eas, markers, instruments, or target conditions, and (4) several STARD 2015 items are open to interpretation and are rather subjective. We tried to minimize this limitation by defining each item in detail, performing pilot exercises, and conducting thor- ough discussions during consensus meetings. On the other hand, this study has the following strengths: (1) this is the first study to estimate the adherence of laboratory diagnostic accu- racy studies published in ALM to STARD 2015 and (2) we ana- lyzed STARD 2015 items in as much detail as possible. For ex-
Report section Item number and description Number (%) of studies, N=66
Discussion 26. Study limitations 40 (61)
27a. Intended use of the index test 65 (98)
27b. Clinical role of the index test 15 (23)
Other information 28. Registration number and name of registry 3 (5)
29. Where the full study protocol can be accessed 3 (5)
30. Sources of funding and other support; role of funders 43 (65)
Revised schema from STARD 2015 statement [2-4]. The STARD 2015 is released under the Creative Commons CC BY-NC license (http://creativecommons.
org/licenses/by-nc/4.0).
Table 2. Continued
ample, STARD for abstract (item 2) encompass a list of 11 es- sential sub-items [14]. Except for the last sub-item on study registration, the remaining 10 sub-items were analyzed individu- ally, allowing detailed evaluation of which sub-items were aptly adhered to (Table 2).
Taken together, our results show that adherence of diagnostic accuracy studies published in ALM to STARD 2015 is low, and more work and effort are needed to improve the reporting qual- ity of such studies. Our data emphasize the necessity of adopt- ing STARD to enhance the value of future diagnostic accuracy studies to be published in ALM.
AUTHOR CONTRIBUTIONS
Conceptualization: Mi-Ae Jang, Bohyun Kim, and You Kyoung Lee. Data curation & formal analysis: Mi-Ae Jang and Bohyun Kim. Project administration & supervision: You Kyoung Lee. Val- idation: Mi-Ae Jang, Bohyun Kim, and You Kyoung Lee. Writing–
original draft preparation: Mi-Ae Jang and Bohyun Kim. Writing–
review & editing: Mi-Ae Jang, Bohyun Kim, You Kyoung Lee. All authors read and approved the final manuscript.
CONFLICTS OF INTEREST
No potential conflicts of interest relevant to this article are re- ported.
RESEARCH FUNDING
This work was supported by the Soonchunhyang University Re- search Fund.
ORCID
Mi-Ae Jang https://orcid.org/0000-0002-6558-5236 Bohyun Kim https://orcid.org/0000-0003-4456-5612 You Kyoung Lee https://orcid.org/0000-0003-1835-2007
REFERENCES
1. Kosack CS, Page AL, Klatser PR. A guide to aid the selection of diag- nostic tests. Bull World Health Organ 2017;95:639-45.
2. Bossuyt PM, Reitsma JB, Bruns DE, Gatsonis CA, Glasziou PP, Irwig L, et al. STARD 2015: an updated list of essential items for reporting diag- nostic accuracy studies. BMJ 2015;351:h5527.
3. Bossuyt PM, Reitsma JB, Bruns DE, Gatsonis CA, Glasziou PP, Irwig L, et al. STARD 2015: An Updated List of Essential Items for Reporting Di- agnostic Accuracy Studies. Clin Chem 2015;61:1446-52.
4. Bossuyt PM, Reitsma JB, Bruns DE, Gatsonis CA, Glasziou PP, Irwig L, et al. STARD 2015: An Updated List of Essential Items for Reporting Di- agnostic Accuracy Studies. Radiology 2015;277:826-32.
5. Schmidt RL and Factor RE. Understanding sources of bias in diagnostic accuracy studies. Arch Pathol Lab Med 2013;137:558-65.
6. Reid MC, Lachs MS, Feinstein AR. Use of methodological standards in diagnostic test research. Getting better but still not good. JAMA 1995;
274:645-51.
7. Glasziou P, Altman DG, Bossuyt P, Boutron I, Clarke M, Julious S, et al.
Reducing waste from incomplete or unusable reports of biomedical re- search. Lancet 2014;383:267-76.
8. Bossuyt PM, Reitsma JB, Bruns DE, Gatsonis CA, Glasziou PP, Irwig LM, et al. The STARD statement for reporting studies of diagnostic ac- curacy: explanation and elaboration. Clin Chem 2003;49:7-18.
9. Bossuyt PM, Reitsma JB, Bruns DE, Gatsonis CA, Glasziou PP, Irwig LM, et al. Towards complete and accurate reporting of studies of diag- nostic accuracy: the STARD initiative. The Standards for Reporting of Diagnostic Accuracy Group. Croat Med J 2003;44:635-8.
10. Korevaar DA, Wang J, van Enst WA, Leeflang MM, Hooft L, Smidt N, et al. Reporting diagnostic accuracy studies: some improvements after 10 years of STARD. Radiology 2015;274:781-9.
11. Korevaar DA, van Enst WA, Spijker R, Bossuyt PM, Hooft L. Reporting quality of diagnostic accuracy studies: a systematic review and meta- analysis of investigations on adherence to STARD. Evid Based Med 2014;
19:47-54.
12. Smidt N, Rutjes AW, van der Windt DA, Ostelo RW, Bossuyt PM, Reits- ma JB, et al. The quality of diagnostic accuracy studies since the STARD statement: has it improved? Neurology 2006;67:792-7.
13. Kim JH. Editorial announcement regarding title change of the Korean Journal of Laboratory Medicine to Annals of Laboratory Medicine. Ann Lab Med 2012;32:1-2.
14. Cohen JF, Korevaar DA, Gatsonis CA, Glasziou PP, Hooft L, Moher D, et al. STARD for Abstracts: essential items for reporting diagnostic accura- cy studies in journal or conference abstracts. BMJ 2017;358:j3751.
15. Walther S, Schueler S, Tackmann R, Schuetz GM, Schlattmann P, Dew- ey M. Compliance with STARD checklist among studies of coronary CT angiography: systematic review. Radiology 2014;271:74-86.
16. Choi YJ, Chung MS, Koo HJ, Park JE, Yoon HM, Park SH. Does the re- porting quality of diagnostic test accuracy studies, as defined by STARD 2015, affect citation? Korean J Radiol 2016;17:706-14.
17. Cohen JF, Korevaar DA, Altman DG, Bruns DE, Gatsonis CA, Hooft L, et al. STARD 2015 guidelines for reporting diagnostic accuracy studies:
explanation and elaboration. BMJ Open 2016;6:e012799.
18. Landis JR and Koch GG. The measurement of observer agreement for categorical data. Biometrics 1977;33:159-74.
19. Michelessi M, Lucenteforte E, Miele A, Oddone F, Crescioli G, Fameli V, et al. Diagnostic accuracy research in glaucoma is still incompletely re- ported: an application of Standards for Reporting of Diagnostic Accura- cy Studies (STARD) 2015. PLoS One 2017;12:e0189716.
20. Hong PJ, Korevaar DA, McGrath TA, Ziai H, Frank R, Alabousi M, et al.
Reporting of imaging diagnostic accuracy studies with focus on MRI subgroup: adherence to STARD 2015. J Magn Reson Imaging 2018;47:
523-44.
21. Fontela PS, Pant Pai N, Schiller I, Dendukuri N, Ramsay A, Pai M. Qual- ity and reporting of diagnostic accuracy studies in TB, HIV and malaria:
evaluation using QUADAS and STARD standards. PLoS One 2009;4:
e7753.
22. Whiting PF, Rutjes AW, Westwood ME, Mallett S, QUADAS-2 Steering Group. A systematic review classifies sources of bias and variation in di- agnostic test accuracy studies. J Clin Epidemiol 2013;66:1093-104.
23. Shinkins B, Thompson M, Mallett S, Perera R. Diagnostic accuracy stud- ies: how to report and analyse inconclusive test results. BMJ 2013;346:
f2778.
24. Naaktgeboren CA, de Groot JA, Rutjes AW, Bossuyt PM, Reitsma JB, Moons KG. Anticipating missing reference standard data when planning diagnostic accuracy studies. BMJ 2016;352:i402.
25. Whiting PF, Rutjes AW, Westwood ME, Mallett S, Deeks JJ, Reitsma JB, et al. QUADAS-2: a revised tool for the quality assessment of diagnostic accuracy studies. Ann Intern Med 2011;155:529-36.
26. Sterne JA, Hernán MA, Reeves BC, Savović J, Berkman ND, Viswana- than M, et al. ROBINS-I: a tool for assessing risk of bias in non-randomised studies of interventions. BMJ 2016;355:i4919.
27. Cha YJ, Park Q, Kang ES, Yoo BC, Park KU, Kim JW, et al. Performance evaluation of the OraQuick hepatitis C virus rapid antibody test. Ann Lab
Med 2013;33:184-9.
28. Lee J, Lee HS, Cho YG, Choi SI, Kim DS. Evaluation of Allplex Respira- tory Panel 1/2/3 multiplex real-time PCR assays for the detection of re- spiratory viruses with influenza A virus subtyping. Ann Lab Med 2018;
38:46-50.
29. Hwang Y and Lee M. Comparison of the AdvanSure human papilloma- virus screening real-time PCR, the Abbott RealTime high risk human papillomavirus test, and the Hybrid Capture human papillomavirus DNA test for the detection of human papillomavirus. Ann Lab Med 2012;32:
201-5.
30. Gupta A and Roehrborn CG. Verification and incorporation biases in stud- ies assessing screening tests: prostate-specific antigen as an example.
Urology 2004;64:106-11.
Supplemental Data Table S1. Complete list of studies included in the current study and their overall STARD adherence Year Volume Page Type Specific
area Study title STARD
items 2012 32 23–30 OA CC Diagnostic utility of osteocalcin, undercarboxylated osteocalcin, and alkaline phosphatase for osteoporosis in
premenopausal and postmenopausal women.
12.0
2012 32 79–81 BC CM Evaluation of a new immunochromatographic assay kit for the rapid detection of norovirus in fecal specimens. 10.4 2012 32 133–138 OA CM Comparison of sputum and nasopharyngeal swab specimens for molecular diagnosis of Mycoplasma
pneumoniae, Chlamydophila pneumoniae, and Legionella pneumophila. 9.3
2012 32 201–205 OA CM Comparison of the AdvanSure human papillomavirus screening real-time PCR, the Abbott RealTime High Risk human papillomavirus test, and the Hybrid Capture human papillomavirus DNA test for the detection of human papillomavirus.
8.1
2012 32 257–263 OA CM Evaluation of peptide nucleic acid probe-based real-time PCR for detection of Mycobacterium tuberculosis complex and nontuberculous mycobacteria in respiratory specimens.
8.4 2012 32 331–338 OA DI Clinical usefulness of cell-based indirect immunofluorescence assay for the detection of aquaporin-4
antibodies in neuromyelitis optica spectrum disorder. 14.3
2012 32 355–358 BC CM Evaluation of the Xpert Clostridium difficile assay for the diagnosis of Clostridium difficile infection. 9.0 2012 32 407–412 OA CM Methicillin-resistant Staphylococcus aureus in nasal surveillance swabs at an intensive care unit: an
evaluation of the LightCycler MRSA advanced test.
10.1
2013 33 34–38 OA CC Point of care D-dimer testing in the emergency department: a bioequivalence study. 13.3 2013 33 39–44 OA CM Usefulness of a rapid real-time PCR assay in prenatal screening for group B streptococcus colonization. 9.8 2013 33 45–51 OA DI Association between elevated pleural interleukin-33 levels and tuberculous pleurisy. 12.8 2013 33 105–110 OA DH Role of the neutrophil-lymphocyte count ratio in the differential diagnosis between pulmonary tuberculosis and
bacterial community-acquired pneumonia. 14.0
2013 33 174–183 OA DI Flow cytometric human leukocyte antigen-B27 typing with stored samples for batch testing. 8.5 2013 33 184–189 OA DI Performance evaluation of the OraQuick hepatitis C virus rapid antibody test. 8.6 2013 33 255–260 OA CM Comparative evaluation of three chromogenic media combined with broth enrichment and the real-time PCR-
based Xpert MRSA assay for screening of methicillin-resistant Staphylococcus aureus in nasal swabs. 11.3 2013 33 326–330 OA CM Evaluation of vancomycin resistance 3 multiplexed PCR assay for detection of vancomycin-resistant
enterococci from rectal swabs. 8.6
2013 33 420–425 OA DI Reduction of the HIV seroconversion window period and false positive rate by using ADVIA Centaur HIV antigen/
antibody combo assay.
11.5 2013 33 449–454 OA GLM Procalcitonin and C-reactive protein in the diagnosis and prediction of spontaneous bacterial peritonitis
associated with chronic severe hepatitis B. 14.5
2014 34 51–55 BC CM Assessment of the quantitative ability of AdvanSure TB/NTM real-time PCR in respiratory specimens by comparison with phenotypic methods.
7.6 2014 34 85–91 OA DH Changes in plasma levels of natural anticoagulants in disseminated intravascular coagulation: high
prognostic value of antithrombin and protein C in patients with underlying sepsis or severe infection. 11.0 2014 34 127–133 OA DG Clinical validation of AdvanSure GenoBlot assay as primary screening and test of cure for human
papillomavirus infection.
7.1 2014 34 203–209 OA CM Evaluation of propidium monoazide real-time PCR for early detection of viable Mycobacterium tuberculosis in
clinical respiratory specimens. 12.1
2014 34 235–239 BC CM Evaluation of a rapid membrane enzyme immunoassay for the simultaneous detection of glutamate
dehydrogenase and toxin for the diagnosis of Clostridium difficile infection. 10.2 2014 34 354–359 OA CM Evaluation of the optimal neutrophil gelatinase-associated lipocalin value as a screening biomarker for urinary
tract infections in children. 8.5
2014 34 376–379 BC CM Performance of chromID Clostridium difficile agar compared with BBL C. difficile selective agar for detection of C. difficile in stool specimens.
13.1 2015 35 28–34 OA DH Flow cytometric white blood cell differential using CytoDiff is excellent for counting blasts. 8.6
(Continued to the next page)
Year Volume Page Type Specific
area Study title STARD
items 2015 35 35–40 OA DH A novel marker for screening paroxysmal nocturnal hemoglobinuria using routine complete blood count and cell
population data. 9.9
2015 35 50–56 OA CM Highly sensitive and novel point-of-care system, aQcare Chlamydia TRF kit for detecting Chlamydia trachomatis by using europium (Eu) (III) chelated nanoparticles.
10.6 2015 35 62–68 OA CM Evaluation of matrix-assisted laser desorption ionization-time of flight mass spectrometry-based VITEK MS
system for the identification of Acinetobacter species from blood cultures: comparison with VITEK 2 and MicroScan systems.
7.7
2015 35 76–81 OA CM Evaluation of the iNtRON VRE vanA/vanB real-time PCR assay for detection of vancomycin-resistant
enterococci. 14.2
2015 35 212–219 OA CM Combined use of the modified Hodge test and carbapenemase inhibition test for detection of carbapenemase- producing Enterobacteriaceae and metallo-β-lactamase-producing Pseudomonas spp. 7.4 2015 35 298–305 OA CM Further modification of the modified Hodge test for detecting metallo-β-Lactamase-producing carbapenem-
resistant Enterobacteriaceae. 11.5
2015 35 306–313 OA CM Multiplex teal-time PCR method for simultaneous identification and toxigenic type characterization of Clostridium difficile from stool samples.
13.7 2015 35 356–361 BC CM Comparison of AdvanSure TB/NTM PCR and COBAS TaqMan MTB PCR for detection of Mycobacterium
tuberculosis complex in routine clinical practice. 9.2
2015 35 454–457 BC CM Direct identification of Staphylococcus aureus and determination of methicillin susceptibility from positive blood-culture bottles in a Bact/ALERT system using Binax Now S. aureus and PBP2a tests.
13.1 2015 35 487–493 OA CM Detection of first-line anti-tuberculosis drug resistance mutations by allele-specific primer extension on a
microsphere-based platform. 7.6
2015 35 500–505 OA CM Evaluation of dual-color fluorescence in situ hybridization with peptide nucleic acid probes for the detection of Mycobacterium tuberculosis and non-tuberculous mycobacteria in clinical specimens.
9.6 2016 36 1–8 OA DH Immature platelet fraction in septic patients: clinical relevance of immature platelet fraction is limited to the
sensitive and accurate discrimination of septic patients from non-septic patients, not to the discrimination of sepsis severity.
13.5
2016 36 131–137 OA CM Evaluation of Xpert C. difficile, BD MAX Cdiff, IMDx C. difficile for Abbott m2000, and Illumigene C. difficile
assays for direct detection of toxigenic Clostridium difficile in stool specimens. 9.9 2016 36 291–299 OA DH Screening PCR versus Sanger sequencing: detection of CALR mutations in patients with thrombocytosis. 13.4 2016 36 405–412 OA CC Can a point-of-care troponin I assay be as good as a central laboratory assay? A MIDAS investigation 16.8 2016 36 434–440 OA CM Disk carbapenemase test for the rapid detection of KPC-, NDM-, and other metallo-β-lactamase-producing
gram-negative bacilli
6.8 2016 36 441–449 OA CM Analysis of the vaginal microbiome by next-generation sequencing and evaluation of its performance as a
clinical diagnostic tool in vaginitis 8.5
2016 36 542–549 OA DI Soluble ST2 levels and left ventricular structure and function in patients with metabolic syndrome 12.0 2017 37 28–33 OA CC Comparison of urine albumin-to-creatinine ratio (ACR) between ACR strip test and quantitative test in
prediabetes and diabetes
14.7 2017 37 39–44 OA CM Evaluation of BD MAX Staph SR assay for differentiating between Staphylococcus aureus and coagulase-
negative Staphylococci and determining methicillin resistance directly from positive blood cultures 10.1 2017 37 53–57 BC CM Fecal calprotectin level reflects the severity of Clostridium difficile infection 12.0 2017 37 240–247 OA DI Performance of an automated fluorescence antinuclear antibody image analyzer 11.9 2017 37 267–271 BC CM Comparison of luminex NxTAG respiratory pathogen panel and xTAG respiratory viral panel FAST version 2 for
the detection of respiratory viruses 7.2
2017 37 305–312 OA CM Evaluation of six phenotypic methods for the detection of carbapenemases in gram-negative bacteria with characterized resistance mechanisms
9.1 Supplemental Data Table S1. Continued
(Continued to the next page)
Year Volume Page Type Specific
area Study title STARD
items 2017 37 388–397 OA CC Proenkephalin, neutrophil gelatinase-associated lipocalin, and estimated glomerular filtration rates in patients
with sepsis 14.9
2017 37 484–493 OA DH Benefits of thromboelastography and thrombin generation assay for bleeding prediction in patients with thrombocytopenia or hematologic malignancies
11.1 2017 37 494–498 OA CM Performance evaluation of the PowerChek MERS (upE & ORF1a) real-time PCR kit for the detection of Middle
East respiratory syndrome coronavirus RNA 11.5
2017 37 499–504 OA CM Multicenter evaluation of an image analysis device (APAS): comparison between digital image and traditional plate reading using urine cultures
13.5
2018 38 39–45 OA GLM Urinary YKL-40 as a candidate biomarker for febrile urinary tract infection in young children 11.5 2018 38 46–50 BC CM Evaluation of Allplex respiratory panel 1/2/3 multiplex real-time PCR assays for the detection of respiratory
viruses with influenza A virus subtyping 6.8
2018 38 95–101 OA CC Evaluation of sFlt-1/PlGF ratio for predicting and improving clinical management of preeclampsia: experience in a specialized perinatal care center
15.4 2018 38 119–124 OA CM Comparative evaluation of the loop-mediated isothermal amplification assay for detecting pulmonary
tuberculosis 13.6
2018 38 155–159 BC CM Prevalence of blaZ gene and performance of phenotypic tests to detect penicillinase in Staphylococcus aureus isolates from Japan
10.0
2018 38 306–315 OA CC Galectin-3 reflects the echocardiographic grades of left ventricular diastolic dysfunction 17.6 2018 38 331–337 OA DI Usefulness of enhanced liver fibrosis, glycosylation isomer of Mac-2 binding protein, galectin-3, and soluble
suppression of tumorigenicity 2 for assessing liver fibrosis in chronic liver diseases 15.5 2018 38 348–354 OA DI Diagnosis of liver fibrosis with Wisteria floribunda agglutinin-positive Mac-2 binding protein (WFA-M2BP)
among chronic hepatitis B patients
12.3 2018 38 425–430 OA CC Plasma neutrophil gelatinase-associated lipocalin as a predictor of renal parenchymal involvement in infants
with febrile urinary tract infection: A preliminary study 12.3
2018 38 466–472 OA DI The role of the signal-to-cutoff ratio in automated anti-HCV chemiluminescent immunoassays by referring to the nucleic acid amplification test and the recombinant immunoblot assay
14.0 2018 38 569–577 OA CM Detection of rifampicin- and isoniazid-resistant Mycobacterium tuberculosis using the quantamatrix
multiplexed assay platform system 15.6
2018 38 578–584 OA DI Development of a rapid automated fluorescent lateral flow immunoassay to detect hepatitis B surface antigen (HBsAg), antibody to HBsAg, and antibody to Hepatitis C
13.0 Abbreviations: BC, Brief Communication; CC, Clinical Chemistry; CM, Clinical Microbiology; DG, Diagnostic Genetics; DH, Diagnostic Hematology; DI, Diag- nostic Immunology; GLM, General Laboratory Medicine; HCV, hepatitis C virus; MERS, Middle East respiratory syndrome coronavirus; MRSA, methicillin-re- sistant Staphylococcus aureus; MTB, Mycobacterium tuberculosis; OA, Original Article; sFlt-1/PIGF, soluble fms-like tyrosine kinase 1/placental growth fac- tor; STARD, Standards for Reporting of Diagnostic Accuracy; TB/NTM, tuberculosis/non-tuberculous mycobacterium; TRF, time-resolved fluorescence; VRE, vancomycin-resistant enterococci.
Supplemental Data Table S1. Continued
Supplemental Data Table S2. Lists of STARD 2015 items with associated criteria for determining adherence SectionItem Criteria for yes/no Title or abstract 1. Identification as a study of diagnostic accuracy using at least one measure of accuracy (such as sensitivity, specificity, predictive values, or AUC).Yes: accuracy, sensitivity, specificity, predictive values, or AUC is mentioned in the title or abstract No: not reported Abstract 2a. Identification as diagnostic accuracy testYes: accuracy, sensitivity, specificity, predictive values or AUC is mentioned in the abstract. No: not reported 2b. Study objectivesYes: as explained No: not reported 2c. Data collection whether this was a prospective or retrospective studyYes: prospective or retrospective is mentioned No: not reported 2d. Eligibility criteria for participants and settings where the data were collectedYes: inclusion criteria for participants and the place where the study was conducted are reported No: not reported 2e. Whether participants formed a consecutive, random, or convenience seriesYes: consecutive, random, or convenience series is mentioned No: not reported 2f. Description of the index test and reference standardYes: as explained No: not reported 2g. Numbers of participants with and without the target conditionYes: as explained No: not reported 2h. Estimates of diagnostic accuracy and their precision (such as 95% confidence intervals)Yes: 95% confidence intervals are reported No: not reported 2i. General interpretation of the results Yes: as explained No: not reported 2j. Implications for practice, including the intended uses of the index testYes: as explained No: not reported 2k. Registration number and name of registryNot considered in this study Introduction 3a. Scientific and clinical background - intended use of index testYes: diagnosis, screening, staging, monitoring, surveillance, prognosis, treatment selection, or other purpose is reported No: not reported 3b. Scientific and clinical background - clinical role of index testYes: replacement, triage, or add-on or other clinical role is reported No: not reported 4a. Study objectivesYes: as explained No: not reported 4b. Study hypothesesYes: statistical acceptability criteria reported quantitatively or the statistical equality or non-inferiority among two or more index tests is mentioned No: not reported (Continued to the next page)
SectionItem Criteria for yes/no Methods 5.
Whether data collection was planned before the index test and reference standard were performed (prospective study) or after (retrospective study) Yes: prospective or retrospective is mentioned No: not reported
6. Eligibility criteriaYes: detailed diagnostic criteria of target disease or condition for, including participants, setting, and location of data collection, are reported No: neither or either reported 7.
On what basis potentially eligible participants were identified (such as symptoms, results from previous tests, inclusion in registry).
Yes:
methods for identifying eligible participants, such as clinical examination, results from previous tests, or inclusion in registry of hospital database, are reported
No: not reported 8a. Where potentially eligible participants were identified
Yes: as explained No: not reported
8b. When potentially eligible participants were identified
Yes: as explained No: not reported
9. Whether participants formed a consecutive, random or convenience series
Yes: as explained No: not reported
10a. Index test, in sufficient detail to allow replicationYes:
detailed methods for index and reference tests, including pre-analytical, analytical and post-analytical phase, are reported
No: not reported 10b. Reference standard, in sufficient detail to allow replication 11. Rationale for choosing the reference standard
Yes: reason or reference for choosing the reference standard is reported No: not reported
12a. Definition of test positivity cut-offs or result categories of the index test
Yes: as explained No: not reported
12a. Rationale for test positivity cut-offs or result categories of the index testYes:
rationale, such as previous studies, cut-offs used in clinical practice, thresholds recommended by clinical practice guidelines or thresholds recommended by manufacturer
, is reported No: not reported 12b.
Definition of test positivity cut-offs or result categories of the reference standard Yes: as explained No: not reported
12b.
Rationale for test positivity cut-offs or result categories of the reference standard
Yes:
rationale, such as previous studies, cut-offs used in clinical practice, thresholds recommended by clinical practice guidelines or thresholds recommended by manufacturer
, is reported No: not reported 13a.
Whether clinical information and reference standard results were available to the performers or readers of the index test Yes: information about blinding or masking is reported No: not reported
13b.
Whether clinical information and index test results were available to the assessors of the reference standard
14. Methods for estimating or comparing measures of diagnostic accuracy
Yes: as explained No: not reported
15. How indeterminate index test or reference standard results were handled
Yes: as explained No: not reported
Supplemental Data Table S2. Continued (Continued to the next page)
SectionItem Criteria for yes/no 16. How missing data on the index test and reference standard were handled Yes: as explained No: not reported
17.
Any analyses of variability in diagnostic accuracy distinguishing prespecified from exploratory Yes: differences in accuracy across subgroups of participants, readers or centers are reported No: not reported
18. Intended sample size and how it was determined
Yes: as explained No: not reported
Results19. Flow of participants, using a diagram
Yes: as explained No: not reported
20. Baseline demographic and clinical characteristics of participants
Yes: as explained No: not reported
21a. Distribution of severity of disease in those with the target condition
Yes: severity of target disease or condition based on any classification system is reported No: not reported
21b. Distribution of alternative diagnoses in those without the target condition
Yes: type, spectrum, and frequency of alternative diagnoses in those without the target condition are reported No: not reported
22.
Time interval and any clinical interventions between index test and reference standard Yes: as explained No: not reported
23.
Cross tabulation of the index test results (or their distribution) by the results of the reference standard Yes: cross tabulation is reported No: not reported
24. Estimates of diagnostic accuracy and their precision (such as 95% CIs)
Yes: 95% confidence intervals are reported No: not reported
25. Any adverse events from performing the index test or the reference standard
Yes: as explained No: not reported
Discussion26.
Study limitations, including sources of potential bias, statistical uncertainty and generalizability Yes: one or more limitations are reported No: not reported
27a. Implications for practice - intended use of the index test
Yes: diagnostic purposes, for susceptibility, screening, risk stratification, staging, prediction, prognosis, treatment selection, monitoring, surveillance or other purpose is mentioned. No: not reported
27b. Implications for practice - clinical role of the index test
Yes: index test’s positioning relative to existing tests for the same purpose, within the same clinical setting (triage, add-on, or replacement) is mentioned No: not reported Other information28. Registration number and name of registry
Yes: as explained No: not reported
29. Where the full study protocol can be accessed
Yes: as explained No: not reported
30. Sources of funding and other support; role of funders
Yes: acknowledgement is present No: not reported
Revised schema from STARD 2015 statement [2-4]. The STARD 2015 is released under the Creative Commons CC BY-NC license (http://creativecommons.org/licenses/by-nc/4.0). Abbreviation: AUC, area under the receiver operating characteristic curve.
Supplemental Data Table S2. Continued