ISSN 2234-3806 • eISSN 2234-3814
http://dx.doi.org/10.3343/alm.2015.35.4.436
Red Blood Cell Transfusion in Patients With
Autoantibodies: Is It Effective and Safe Without Increasing Hemolysis Risk?
Sang Hyuk Park, M.D.1,2, Won-Ho Choe, M.D.3, and Seog-Woon Kwon, M.D.4
Department of Laboratory Medicine1, Pusan National University School of Medicine, Pusan National University Hospital, Busan; Biomedical Research Institute2, Pusan National University Hospital, Busan; Department of Laboratory Medicine3, Eulji Medical Center, Eulji University School of Medicine, Seoul;
Department of Laboratory Medicine4, University of Ulsan College of Medicine and Asan Medical Center, Seoul, Korea
Background: The therapeutic efficacy of red blood cell (RBC) transfusions in patients with autoimmune hemolytic anemia (AIHA) is highly debated because of speculations on the increased risk of transfusion reactions; yet it is a suggested adjuvant therapy in anemic patients with life-threatening hypoxemia. In this study, we evaluated the safety and effi- cacy of RBC transfusions in AIHA patients.
Methods: Daily changes in hemoglobin, total bilirubin, and lactate dehydrogenase (LDH) were assessed in 161 AIHA patients without bleeding history who were transfused once with 1-5 units of the least-incompatible RBCs and monitored over a seven-day period.
Post-transfusion patients positive for alloantibodies only or those without RBC-specific an- tibodies were considered as control groups (N=100 for both groups).
Results: The three groups revealed similar increases in hemoglobin of 1.40-1.70 g/dL (autoantibodies), 1.20-1.60 g/dL (alloantibodies only), and 1.40-1.55 g/dL (no antibodies) for seven days following transfusion of 10 mL RBCs/kg. During follow-up, no significant changes in total bilirubin or LDH levels were detected in the AIHA group compared with controls. Influences due to autoantibody type, direct antiglobulin test (DAT) specificity and strength, and steroid therapy status on transfusion reactions were not evident in AIHA pa- tients. In addition, changes in hemoglobin levels were significantly higher (P <0.001) in severe anemia (<5 g/dL) than in other patients.
Conclusions: Transfusion of the least-incompatible RBCs in AIHA patients is effective and safe without any associated increase in hemolysis risk when compared with post-transfu- sion patients positive for alloantibodies or those lacking RBC-specific antibodies.
Key Words: Autoantibodies, Effectiveness, Hemolysis, Red blood cell, Safety, Transfusion
Received: November 4, 2014 Revision received: January 16, 2015 Accepted: April 23, 2015
Corresponding author: Seog-Woon Kwon Department of Laboratory Medicine, University of Ulsan College of Medicine and Asan Medical Center, 88 Olympic-ro 43-gil, Songpa-gu, Seoul 138-736, Korea Tel: +82-2-3010-4504
Fax: +82-2-478-0884 E-mail: [email protected]
© The Korean Society for Laboratory Medicine This is an Open Access article distributed under the terms of the Creative Commons Attribution Non-Commercial License (http://creativecom- mons.org/licenses/by-nc/3.0) which permits unrestricted non-commercial use, distribution, and reproduction in any medium, provided the original work is properly cited.
INTRODUCTION
The diagnosis of autoimmune hemolytic anemia (AIHA) is made on the basis of positive direct antiglobulin test (DAT) and a sero- logic evaluation demonstrating the presence of autoantibodies specific to the patient’s red blood cells (RBCs) [1-5]. The feasi- bility of blood transfusion in AIHA patients is heavily debated because of difficulties in crossmatching and the increased risk of transfusion reactions, since transfused RBCs may be de-
stroyed more rapidly in patients with active hemolysis, which can result in hemoglobinemia, hemoglobinuria, and subsequent disseminated intravascular coagulopathy. Therefore, clinicians must exercise extreme caution when deciding transfusion in AIHA patients, and then should use only the smallest volume of blood necessary to alleviate life-threatening conditions [6, 7].
Conversely, RBC transfusion has been suggested as an ad- junctive therapeutic option in patients with autoantibodies de- spite the risk of hemolysis [8]. This is based on the belief that
the increased oxygen-carrying capacity provided by the trans- fused RBCs may satisfy a patient’s need until other treatment options become effective, particularly in those with symptomatic cardiovascular diseases for which sufficient oxygen supply is important [1, 4, 9]. However, data weighing the safety and effi- cacy of transfusions in patients with AIHA is scarce and should be further investigated. In this study, we aimed to evaluate whether transfusion of the least-incompatible blood was suffi- cient to increase hemoglobin levels without causing a significant increase in risk of hemolysis in patients with AIHA.
METHODS
1. Selection and exclusion criteria of patient and two control groups
Total 161 anemic patients with positive DAT and autologous control panel antibody identification tests that received one transfusion of 1-5 units (320 mL or 400 mL) of the least-incom- patible packed RBCs and monitored over a period of seven days from January 2006 to March 2011 at Asan Medical Center were initially selected as a patient group.
DATs were performed by using the gel-based Diamed-ID sys- tem (Bio-Rad Laboratories, Hercules, CA, USA). Antibody iden- tification testing was performed with Diamed-ID-Card LISS/
Coombs+Enzyme Test (Bio-Rad Laboratories). Autoantibodies were classified into three groups (warm-reactive only, cold-reac- tive with wide thermal range, and cold-reactive only). Subse- quently, an adsorption procedure using ZZAP-treated allogenic RBCs was performed to determine alloantibody type as de- scribed [10]. The least-incompatible blood was selected by test- ing the reactivity of the patient’s serum against >10 ABO-com- patible units and choosing those which were best matched. All 161 patients were transfused with RBCs that were the least-in- compatible and lacked antigen against any detected alloanti- bodies.
In addition, 100 anemic patients who were negative in both DAT and autologous control panel, but showed positivity in spe- cific panels on the antibody identification test, and were trans- fused once with 1-5 units of packed RBCs lacking antigen(s) against the detected alloantibodies were classified as the first control group. In addition, 100 anemic patients who showed negative results in both DAT and antibody identification test, and were transfused once with 1-5 units of ABO-compatible packed RBCs were enrolled as the second control group. All patients with evident bleeding or multiple transfusions during follow-up were excluded. This study was approved by the insti-
tutional review board of Asan Medical Center, Seoul, Korea.
2. Comparison of clinical and laboratory findings among three patient groups
Both clinical and laboratory findings for each patient as well as history of fever (>37.3°C) or evidence of acute hemolytic trans- fusion reaction within 24 hours after transfusion were obtained by retrospective review of electronic medical records, and were compared among the three patient groups. These results are rep- resented in Table 1.
3. Comparison of hemoglobin, total bilirubin, and lactate dehydrogenase changes after RBCs transfusion among three patient groups
We investigated hemoglobin, total bilirubin, and lactate dehy- drogenase (LDH) data after RBC transfusion and calculated the changes compared with pre-transfusion levels. To adjust for the effect of transfused RBC volume and body weight of the patient on the transfusion, we applied the concept of “hemoglobin, total bilirubin, and LDH changes after transfusion of defined amount of 10 mL RBCs/kg body weight of each patient.” An example of the calculation is provided below:
(A) Absolute volume of transfused RBCs: 800 mL
(B) Hemoglobin changes: 1.6 g/dL (present level-pre-transfu- sion level)
(C) Body weight of patient: 60 kg
(D) Absolute volume of transfused RBCs/kg body weight of patient: (A)/(C)=13.3 mL/kg
(E) Hemoglobin changes after 10 mL/kg of transfused RBCs:
[(B)×10 mL/kg]/(D)=1.20 g/dL
Using this formula, both absolute levels of three items and their changes were enumerated and compared separately among the three patient groups. These results are summarized in Table 2 (hemoglobin), Table 3 (total bilirubin), and Table 4 (LDH).
Schematic illustrations representing their changes are shown in Supplemental Data Figure S1.
4. Assessment of the influences of the autoantibody type, DAT specificity, DAT strength, initial hemoglobin levels prior to transfusion, and steroid therapy status on the effect of RBC transfusion in the patients with autoantibodies
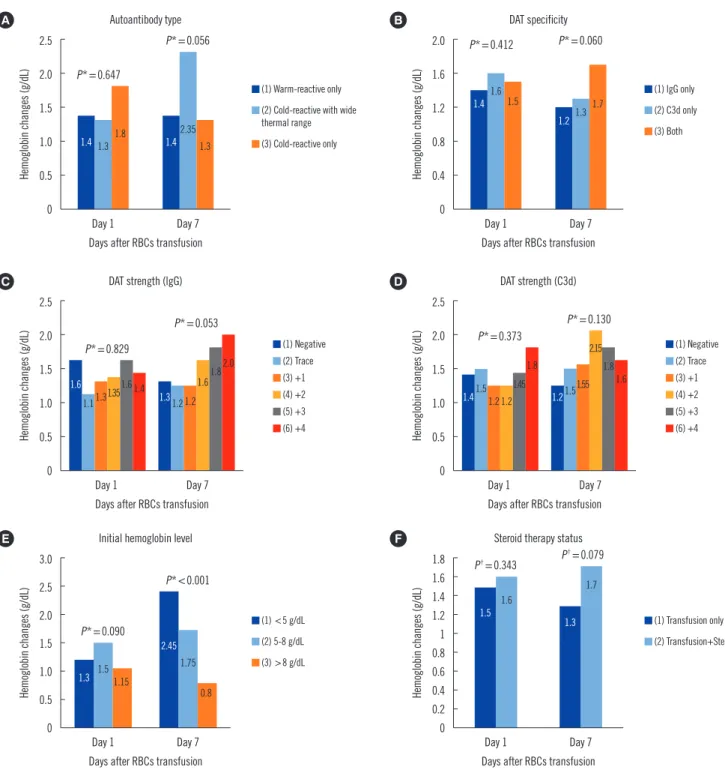
In this analysis, we focused on the hemoglobin changes at days 1 and 7 after RBC transfusion, and hemoglobin changes were compared among the patient groups categorized by each variable described previously. These results are illustrated in Fig. 1.
Table 1. Comparison of clinical and laboratory findings of total 361 patients among three patient groups categorized by detected type of antibodies
Clinical variables
Patient groups P value
(1) Autoantibodies±
alloantibodies (N=161)
(2) Alloantibodies only
(N=100) (3) No antibodies
(N=100) (1) vs. (2) (1) vs. (3) (2) vs. (3)
Sex (M : F) 78:83 55:45 63:37 0.303* 0.022* 0.295*
Age, median (range) 60.0 (4.0-89.0) 57.0 (13.0-82.0) 70.0 (27.0-91.0) 0.095† <0.001† <0.001† Unit of transfused RBCs, median (range) 2.0 (1.0-5.0) 2.0 (1.0-5.0) 2.0 (1.0-5.0) 0.213† 0.467† 0.737† Volume of transfused RBCs (mL), median (range) 800 (320-2,000) 800 (320-1,600) 640 (320-1,600) 0.257† 0.104† 0.096† Transfused RBCs (mL)/kg of patient, median (range) 13.33 (3.99-42.64) 12.60 (4.88-26.09) 11.03 (4.14-30.90) 0.075† 0.055† 0.565†
Underlying disease 0.348* 0.239* 0.546*
Hematologic malignancy 33 (20.5%) 8 (8.0%) 7 (7.0%)
Solid tumor 40 (24.8%) 17 (17.0%) 14 (14.0%)
Autoimmune disease 14 (8.7%) 4 (4.0%) 6 (6.0%)
Infection 9 (5.6%) 4 (4.0%) 3 (3.0%)
Liver disease 9 (5.6%) 10 (10.0%) 3 (3.0%)
Others 56 (34.8%) 57 (57.0%) 67 (67.0%)
DAT specificity <0.001* <0.001* NC
Both negative 0 (0.0%) 100 (100.0) 100 (100.0%)
IgG only 89 (55.3%) 0 (0.0%) 0 (0.0%)
C3d only 9 (5.6%) 0 (0.0%) 0 (0.0%)
Both IgG and C3d 63 (39.1%) 0 (0.0%) 0 (0.0%)
DAT strength (IgG) <0.001* <0.001* NC
Negative 9 (5.6%) 100 (100.0%) 100 (0.0%)
Trace 29 (18.0%) 0 (0.0%) 0 (0.0%)
1+ 35 (21.7%) 0 (0.0%) 0 (0.0%)
2+ 26 (16.1%) 0 (0.0%) 0 (0.0%)
3+ 31 (19.3%) 0 (0.0%) 0 (0.0%)
4+ 31 (19.3%) 0 (0.0%) 0 (0.0%)
DAT strength (C3d) <0.001* <0.001* NC
Negative 89 (55.3%) 100 (100.0%) 100 (100.0%)
Trace 17 (10.6%) 0 (0.0%) 0 (0.0%)
1+ 13 (8.1%) 0 (0.0%) 0 (0.0%)
2+ 12 (7.4%) 0 (0.0%) 0 (0.0%)
3+ 14 (8.7%) 0 (0.0%) 0 (0.0%)
4+ 16 (9.9%) 0 (0.0%) 0 (0.0%)
Existence of alloantibodies <0.001* <0.001* NC
Yes 87 (54.0%) 100 (100.0%) 0 (0.0%)
No 74 (46.0%) 0 (0.0%) 100 (100.0%)
Types of autoantibodies NC NC NC
Warm-reactive only 124 (77.0%) 0 (0.0%) 0 (0.0%)
Cold-reactive with wide thermal range 21 (13.1%) 0 (0.0%) 0 (0.0%)
Cold-reactive only 16 (9.9%) 0 (0.0%) 0 (0.0%)
History of steroid therapy 0.001* <0.001* <0.001*
Yes 73 (45.3%) 25 (25.0%) 0 (0.0%)
No 88 (54.7%) 75 (75.0%) 100 (100.0%)
History of immunosupressants 0.081* 0.008* 0.149*
Yes 11 (6.8%) 2 (2.0%) 0 (0.0%)
No 150 (93.2%) 98 (98.0%) 100 (100.0%)
Hemoglobin level prior to transfusion <0.001* <0.001* 0.104*
<5 g/dL 14 (8.7%) 1 (1.0%) 0 (0.0%)
5-8 g/dL 97 (60.2%) 47 (47.0%) 37 (37.0%)
>8 g/dL 50 (31.1%) 52 (52.0%) 63 (63.0%)
P values were obtained from Chi-square test* and Mann-Whitney U test†.
Abbreviations: M, male; F, female; RBC, red blood cell; DAT, direct antiglobulin test; NC, not calculated.
1.5 1.6
1.3 1.7
1.3
2.45
1.5 1.75
1.15 0.8
P*=0.090
P*<0.001
5. Comparison of hemoglobin changes in the patients with autoantibodies with respect to initial hemoglobin levels prior to RBC transfusion
In this analysis, we compared the total units and volume of
transfused RBCs, transfused RBCs/kg body weight of patient, absolute hemoglobin levels, and the hemoglobin changes at each follow-up day after transfusion of 10 mL RBCs/kg among the three patient groups. These results are summarized in Table 2.5
2.0 1.5
1.0
0.5
0
3.0 2.5 2.0 1.5 1.0 0.5 0 2.5 2.0
1.5
1.0 0.5
0
2.5 2.0
1.5
1.0 0.5
0 2.0
1.6 1.2
0.8
0.4
0
1.8 1.6 1.4 1.2 1 0.8 0.6 0.4 0.2 0 Day 1
Day 1
Day 1 Day 1
Day 1
Day 1 Day 7
Day 7
Day 7 Day 7
Day 7
Day 7 (1) Warm-reactive only
(2) Cold-reactive with wide thermal range (3) Cold-reactive only
(1) <5 g/dL (2) 5-8 g/dL (3) >8 g/dL
(1) Negative (2) Trace (3) +1 (4) +2 (5) +3 (6) +4
(1) Negative (2) Trace (3) +1 (4) +2 (5) +3 (6) +4 (1) lgG only (2) C3d only (3) Both
(1) Transfusion only (2) Transfusion+Sterold Days after RBCs transfusion
Days after RBCs transfusion
Days after RBCs transfusion Days after RBCs transfusion
Days after RBCs transfusion
Days after RBCs transfusion Autoantibody type
Initial hemoglobin level
DAT strength (lgG) DAT strength (C3d)
DAT specificity
Steroid therapy status
Hemoglobin changes (g/dL)Hemoglobin changes (g/dL)Hemoglobin changes (g/dL) Hemoglobin changes (g/dL)Hemoglobin changes (g/dL)Hemoglobin changes (g/dL)
A
E
C D
B
F 1.4
1.6
1.4
1.3 1.2
1.1
1.5 1.2
1.3 1.2 1.2 1.5
1.35 1.55
1.2 1.6
2.15
1.6 1.45
1.8 1.8
1.4
2.0 1.8
1.6 1.4
1.4
1.2 1.3
1.6
2.35
1.3
P*=0.056 P*=0.060
P*=0.647
P*=0.829 P*=0.053 P*=0.373 P*=0.130
P*=0.412
P†=0.343 P†=0.079 1.8
1.5
1.3
1.7
Fig. 1. Comparison of hemoglobin changes (medians) at days 1 and 7 after transfusion of 10 mL RBCs/kg in the patients with autoantibod- ies with respect to (A) autoantibody type, (B) DAT specificity, (C) DAT strength in IgG, (D) DAT strength in C3d, (E) initial hemoglobin level, and (F) steroid therapy status.
*P values were obtained from the Kruskal-Wallis test and †the Mann-Whitney U test.
Abbreviations: RBC, red blood cell; DAT, direct antiglobulin test.
5. Schematic illustrations representing the trends of hemoglobin changes are shown in Supplemental Data Figure S2.
6. Statistical analysis
Pearson chi-square tests were used to compare categorical vari- ables. The Mann-Whitney U test and Kruskal-Wallis test were used to compare median (range) value of continuous variables between two groups and more than two groups, respectively. All statistical analyses were performed using SPSS 13.0.1 for Win- dows (SPSS Inc, Chicago, IL, USA) and P values ≤0.05 were considered statistically significant.
RESULTS
1. Comparison of clinical and laboratory findings among the three patient groups
The AIHA patients showed significant female predominance (P =0.022) and were younger (P <0.001) than those with no antibodies; however, the total units and volume of transfused
RBCs were not different among the three patient groups. Many patients with autoantibodies had underlying diseases, including hematologic malignancy (20.5%), solid tumors (24.8%), auto- immune disease (8.7%), and infection (5.6%). Approximately a half of the patients with autoantibodies (54.0%) possessed un- derlying alloantibodies, including anti-E and -c (24.8%), anti-C and -e (4.3%), anti-E (3.1%), and anti-M (3.1%).
AIHA patients received significantly more steroid therapy (P =0.001) and tended towards more frequent immunosup- pressive therapy (P =0.081) than those with alloantibodies only.
Twenty-five alloantibody patients received steroids only when they were transfused, with underlying diseases that included solid tumor (10 patients), autoimmune disease (four patients), infection (three patients), osteoarthritis (two patients), and oth- ers such as chronic renal failure and epidural hemorrhage (six patients). The patients with autoantibodies showed significantly worse anemia than those with alloantibodies only (P <0.001) and those with no antibodies (P <0.001). Among patients with autoantibodies, three patients (1.9%) developed fever (37.9°C, Table 2. Comparison of hemoglobin levels and their changes at each follow-up day after transfusion among three patient groups catego- rized by detected type of antibodies
Clinical variables
Patient groups N of available samples in
each patient group P value*
(1) Autoantibodies±
alloantibodies (N=161)
(2) Alloantibodies only
(N=100) (3) No antibodies
(N=100) (1) (2) (3) (1) vs. (2) (1) vs. (3) (2) vs. (3) Hemoglobin (g/dL), median (range)
Pretransfusion 7.5 (2.1-12.5) 8.1 (4.4-11.6) 8.7 (5.7-13.4) 161 100 100 <0.001 <0.001 0.017
Day 1 9.4 (5.2-13.6) 10.2 (6.9-13.7) 10.8 (7.5-16.3) 161 100 100 <0.001 <0.001 0.002
Day 2 9.4 (5.1-3.6) 10.1 (6.8-15.3) 10.4 (7.9-15.7) 150 98 97 0.003 <0.001 0.007
Day 3 9.4 (6.1-13.9) 9.9 (6.8-15.4) 10.4 (7.3-15.6) 143 88 98 0.012 <0.001 0.028
Day 4 9.4 (5.5-14.5) 10.0 (6.9-15.3) 9.8 (5.5-15.4) 134 85 94 0.048 <0.001 0.012
Day 5 9.3 (5.3-14.4) 9.9 (6.5-15.5) 10.2 (8.1-14.8) 124 71 93 0.055 <0.001 0.027
Day 6 9.3 (6.1-14.5) 9.8 (6.3-11.3) 10.1 (8.2-14.5) 110 60 76 0.529 <0.001 0.006
Day 7 9.4 (5.6-13.6) 9.3 (6.0-11.8) 10.3 (7.2-15.1) 104 50 100 0.858 <0.001 0.001
Hemoglobin changes (g/dL) per transfused RBCs of 10 mL/kg, median (range)
Day 1 1.40 (-0.70-5.20) 1.60 (0.20-5.10) 1.50 (0.10-4.80) 161 100 100 0.051 0.055 0.500
Day 2 1.50 (-4.90-4.60) 1.50 (-1.00-6.20) 1.40 (-0.60-4.10) 150 98 97 0.453 0.558 0.179
Day 3 1.50 (-1.70-5.50) 1.40 (-0.30-7.20) 1.50 (-1.40-3.80) 143 88 98 0.531 0.195 0.439
Day 4 1.40 (-2.00-5.30) 1.60 (-0.60-7.10) 1.45 (-1.40-3.80) 134 85 94 0.757 0.616 0.980
Day 5 1.70 (-2.10-7.00) 1.50 (-0.90-7.30) 1.50 (-2.30-4.20) 124 71 93 0.478 0.317 0.763
Day 6 1.60 (-0.70-7.90) 1.50 (-0.90-3.40) 1.55 (-3.30-5.70) 110 60 76 0.248 0.669 0.517
Day 7 1.60 (-0.80-7.60) 1.20 (-1.40-2.90) 1.45 (-1.90-7.60) 104 50 100 0.037 0.492 0.125
*P values were obtained from Mann-Whitney U test.
Abbreviation: RBC, red blood cell.
38.1°C, and 37.7°C peak temperatures) within 24 hrs of trans- fusion; however, the patients had pneumonia and showed no evidence of hemolytic transfusion reaction (Table 1).
2. Comparison of changes in hemoglobin, total bilirubin, and lactate dehydrogenase after RBCs transfusion
The patients with autoantibodies showed significantly lower he- moglobin levels than those with alloantibodies only at pre-trans- fusion and from day 1 to day 4; however, no significant differ- ences were observed from day 5 to day 7, indicating a preferen- tial hemoglobin recovery in patients with autoantibodies at long term follow-up compared with those with alloantibodies only.
When compared with the normal control group (no antibodies), autoantibody patients exhibited significantly lower hemoglobin levels consistently.
Nonetheless, the three patient groups exhibited similar hemo- globin changes of 1.40-1.70 g/dL (autoantibodies), 1.20-1.60 g/
dL (alloantibodies only), and 1.40-1.55 g/dL (no antibodies) af-
ter transfusion of 10 mL RBCs/kg. The differences were not sig- nificant in all comparisons throughout the seven-day follow-up period, implying a similar benefit of RBC transfusion among the three patient groups (Table 2).
In addition, three patient groups also showed similar total bili- rubin changes after transfusion of 10 mL RBCs/kg. The differ- ences were not significant throughout the follow-up period. No- tably, patients in the autoantibody group showed no or negative total bilirubin changes consecutively after two days of RBCs transfusion, indicating the absence of hemolysis risk (Table 3).
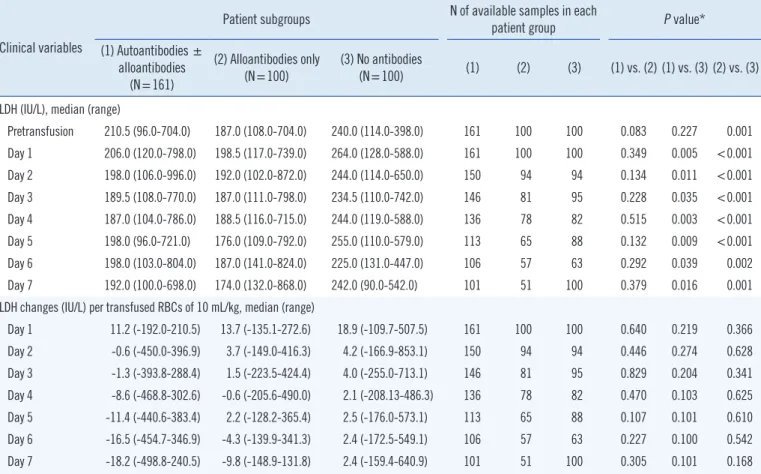
The comparison of LDH changes also showed identical results (Table 4).
3. Influences of autoantibody type, DAT specificity, DAT strength, initial hemoglobin levels prior to transfusion, and steroid therapy status on the efficacy of RBC transfusion in patients with autoantibodies
Associations between autoantibody type, DAT specificity, DAT Table 3. Comparison of serum total bilirubin levels and their changes at each follow-up day after transfusion among three patient groups categorized by detected type of antibodies
Clinical variables
Patient groups N of available samples in each
patient group P value*
(1) Autoantibodies±
alloantibodies (N=161)
(2) Alloantibodies only
(N=100) (3) No antibodies
(N=100) (1) (2) (3) (1) vs. (2) (1) vs. (3) (2) vs. (3) Total bilirubin (mg/dL), median (range)
Pretransfusion 1.45 (0.30-9.40) 0.95 (0.40-9.20) 0.67 (0.15-2.75) 161 100 100 0.011 <0.001 0.001
Day 1 1.60 (0.30-16.70) 1.10 (0.40-9.70) 0.98 (0.10-6.63) 161 100 100 0.047 <0.001 0.021
Day 2 1.60 (0.20-18.90) 1.00 (0.20-10.60) 0.77 (0.12-6.34) 150 94 94 0.024 <0.001 0.010
Day 3 1.40 (0.30-19.20) 0.90 (0.40-10.40) 0.73 (0.10-4.10) 146 81 95 0.023 <0.001 0.013
Day 4 1.30 (0.20-21.00) 1.00 (0.20-9.10) 0.71 (0.17-5.33) 136 78 82 0.101 <0.001 0.048
Day 5 1.50 (0.20-27.90) 0.90 (0.30-9.10) 0.64 (0.15-7.29) 113 65 88 0.035 <0.001 0.003
Day 6 1.50 (0.30-14.90) 0.90 (0.40-10.70) 0.66 (0.16-4.51) 106 57 63 0.066 <0.001 0.009
Day 7 1.40 (0.20-11.70) 1.00 (0.40-13.90) 0.62 (0.14-5.24) 101 51 100 0.087 <0.001 0.001
Total bilirubin changes (mg/dL) per transfused RBCs of 10 mL/kg, median (range)
Day 1 0.07 (-2.32-10.59) 0.18 (-1.07-4.72) 0.15 (-2.37-4.80) 161 100 100 0.187 0.196 0.964
Day 2 0.00 (-3.75-17.46) 0.06 (-1.34-5.99) 0.03 (-1.38-3.39) 150 94 94 0.405 0.576 0.777
Day 3 0.00 (-4.15-7.14) 0.05 (-2.38-4.10) 0.04 (-2.85-3.51) 146 81 95 0.517 0.383 0.809
Day 4 0.00 (-7.84-8.22) 0.02 (-2.24-5.13) 0.06 (-1.64-5.49) 136 78 82 0.429 0.075 0.386
Day 5 -0.03 (-8.12-12.36) 0.00 (-1.10-4.49) -0.02 (-2.02-4.56) 113 65 88 0.225 0.660 0.266
Day 6 0.00 (-8.84-4.56) 0.00 (-1.23-4.34) -0.07 (-2.13-3.62) 106 57 63 0.652 0.836 0.335
Day 7 -0.11 (-9.69-6.21) 0.00 (-1.23-6.21) -0.09 (-3.21-3.25) 101 51 100 0.248 0.683 0.219
*P values were obtained from Mann-Whitney U test.
Abbreviation: RBC, red blood cell.
strength, and steroid therapy status with hemoglobin changes at day 1 and day 7 after transfusion were not evident. However, patients with more severe pre-transfusion anemia showed sig- nificantly greater hemoglobin changes at day 7 after than those with mild anemia (P <0.001). This result may suggest an in- creased benefit of transfusion in patients with more severe auto- immune anemia compared with those with milder forms (Fig. 1).
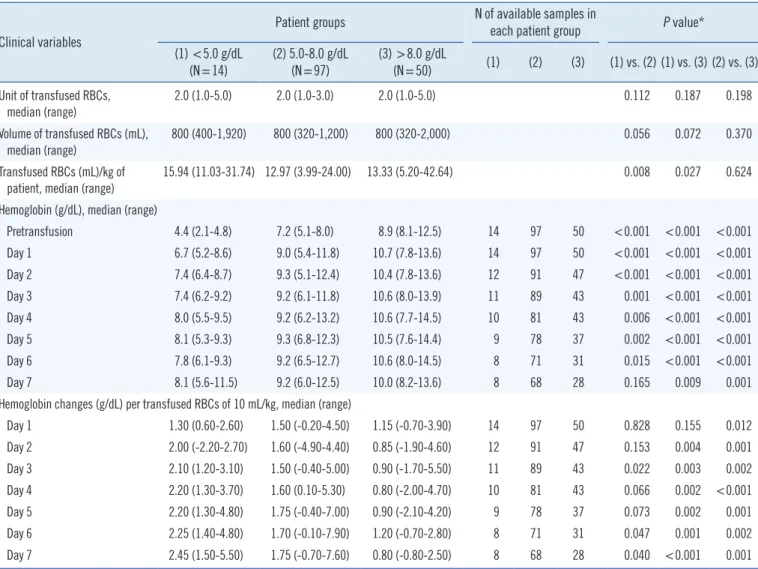
4. Comparison of hemoglobin changes in the patients with autoantibodies with respect to initial hemoglobin levels prior to RBCs transfusion
When the body weight of patient was normalized, patients with initial hemoglobin levels <5 g/dL received significantly higher amount of transfused RBCs per body weight of patient than those with initial levels 5-8 g/dL or >8 g/dL, denoting a higher absolute volume of transfused RBCs in patients with initial he- moglobin levels <5 g/dL. Furthermore, patients with initial he- moglobin levels <5 g/dL displayed significantly lower hemoglo-
bin levels than those at 5-8 g/dL from day 1 to day 6; however, the hemoglobin levels at post-transfusion day seven were not significantly different between two subgroups, indicating a more satisfactory hemoglobin recovery in patients with severe anemia at long term follow-up than those with moderate anemia. In con- trast, those with initial hemoglobin levels <5 g/dL showed signif- icantly lower hemoglobin levels consistently during all follow-up days compared with the patients with initial levels >8 g/dL.
In addition, patients with initial hemoglobin levels <5 g/dL re- vealed more hemoglobin changes from day two compared with other patient groups. The differences were statistically signifi- cant at day 3, day 6, and day 7 compared with the patients with initial hemoglobin levels 5-8 g/dL, and were consistently signifi- cant from days 2-7 compared with those with initial levels >8 g/
dL; it suggests that patients with severe anemia consistently ex- hibit a significantly greater degree of transfusion benefit com- pared with those with mild-moderate anemia (Table 5).
Table 4. Comparison of serum lactate dehydrogenase levels and their changes at each follow-up day after transfusion among three patient groups categorized by detected type of antibodies
Clinical variables
Patient subgroups N of available samples in each
patient group P value*
(1) Autoantibodies ± alloantibodies
(N=161)
(2) Alloantibodies only
(N=100) (3) No antibodies
(N=100) (1) (2) (3) (1) vs. (2) (1) vs. (3) (2) vs. (3) LDH (IU/L), median (range)
Pretransfusion 210.5 (96.0-704.0) 187.0 (108.0-704.0) 240.0 (114.0-398.0) 161 100 100 0.083 0.227 0.001 Day 1 206.0 (120.0-798.0) 198.5 (117.0-739.0) 264.0 (128.0-588.0) 161 100 100 0.349 0.005 <0.001 Day 2 198.0 (106.0-996.0) 192.0 (102.0-872.0) 244.0 (114.0-650.0) 150 94 94 0.134 0.011 <0.001 Day 3 189.5 (108.0-770.0) 187.0 (111.0-798.0) 234.5 (110.0-742.0) 146 81 95 0.228 0.035 <0.001 Day 4 187.0 (104.0-786.0) 188.5 (116.0-715.0) 244.0 (119.0-588.0) 136 78 82 0.515 0.003 <0.001
Day 5 198.0 (96.0-721.0) 176.0 (109.0-792.0) 255.0 (110.0-579.0) 113 65 88 0.132 0.009 <0.001
Day 6 198.0 (103.0-804.0) 187.0 (141.0-824.0) 225.0 (131.0-447.0) 106 57 63 0.292 0.039 0.002
Day 7 192.0 (100.0-698.0) 174.0 (132.0-868.0) 242.0 (90.0-542.0) 101 51 100 0.379 0.016 0.001
LDH changes (IU/L) per transfused RBCs of 10 mL/kg, median (range)
Day 1 11.2 (-192.0-210.5) 13.7 (-135.1-272.6) 18.9 (-109.7-507.5) 161 100 100 0.640 0.219 0.366
Day 2 -0.6 (-450.0-396.9) 3.7 (-149.0-416.3) 4.2 (-166.9-853.1) 150 94 94 0.446 0.274 0.628
Day 3 -1.3 (-393.8-288.4) 1.5 (-223.5-424.4) 4.0 (-255.0-713.1) 146 81 95 0.829 0.204 0.341
Day 4 -8.6 (-468.8-302.6) -0.6 (-205.6-490.0) 2.1 (-208.13-486.3) 136 78 82 0.470 0.103 0.625
Day 5 -11.4 (-440.6-383.4) 2.2 (-128.2-365.4) 2.5 (-176.0-573.1) 113 65 88 0.107 0.101 0.610
Day 6 -16.5 (-454.7-346.9) -4.3 (-139.9-341.3) 2.4 (-172.5-549.1) 106 57 63 0.227 0.100 0.542
Day 7 -18.2 (-498.8-240.5) -9.8 (-148.9-131.8) 2.4 (-159.4-640.9) 101 51 100 0.305 0.101 0.168
*P values were obtained from Mann-Whitney U test.
Abbreviations: LDH, lactate dehydrogenase; RBC, red blood cell.
DISCUSSION
RBC transfusion to patients with autoantibodies was classically regarded to be therapeutically non-beneficial owing to the diffi- culties of finding compatible blood donor and increased risk of transfusion reactions [4, 11]. A study on Jehovah’s Witness pa- tients with hemoglobin <5 g/dL showed inconsistent mortality rates related to severe anemia with transfusion refusal, demon- strating that a portion of severely anemic patients can survive without transfusion [12]. In contrast, recent reports propose that it may be more beneficial to transfuse incompatible RBCs than to refrain from treatment, especially in patients with cardiovas- cular disease or severely symptomatic patients in urgent need of additional oxygen-carrying capacity [1, 2, 4, 11]. To date, an
Table 5. Comparison of hemoglobin levels and their changes at each follow-up day after transfusion in the patients with autoantibodies with respect to their initial hemoglobin levels prior to RBCs transfusion
Clinical variables
Patient groups N of available samples in
each patient group P value*
(1) <5.0 g/dL
(N=14) (2) 5.0-8.0 g/dL
(N=97) (3) >8.0 g/dL
(N=50) (1) (2) (3) (1) vs. (2) (1) vs. (3) (2) vs. (3) Unit of transfused RBCs,
median (range)
2.0 (1.0-5.0) 2.0 (1.0-3.0) 2.0 (1.0-5.0) 0.112 0.187 0.198
Volume of transfused RBCs (mL),
median (range) 800 (400-1,920) 800 (320-1,200) 800 (320-2,000) 0.056 0.072 0.370
Transfused RBCs (mL)/kg of
patient, median (range) 15.94 (11.03-31.74) 12.97 (3.99-24.00) 13.33 (5.20-42.64) 0.008 0.027 0.624 Hemoglobin (g/dL), median (range)
Pretransfusion 4.4 (2.1-4.8) 7.2 (5.1-8.0) 8.9 (8.1-12.5) 14 97 50 <0.001 <0.001 <0.001
Day 1 6.7 (5.2-8.6) 9.0 (5.4-11.8) 10.7 (7.8-13.6) 14 97 50 <0.001 <0.001 <0.001
Day 2 7.4 (6.4-8.7) 9.3 (5.1-12.4) 10.4 (7.8-13.6) 12 91 47 <0.001 <0.001 <0.001
Day 3 7.4 (6.2-9.2) 9.2 (6.1-11.8) 10.6 (8.0-13.9) 11 89 43 0.001 <0.001 <0.001
Day 4 8.0 (5.5-9.5) 9.2 (6.2-13.2) 10.6 (7.7-14.5) 10 81 43 0.006 <0.001 <0.001
Day 5 8.1 (5.3-9.3) 9.3 (6.8-12.3) 10.5 (7.6-14.4) 9 78 37 0.002 <0.001 <0.001
Day 6 7.8 (6.1-9.3) 9.2 (6.5-12.7) 10.6 (8.0-14.5) 8 71 31 0.015 <0.001 <0.001
Day 7 8.1 (5.6-11.5) 9.2 (6.0-12.5) 10.0 (8.2-13.6) 8 68 28 0.165 0.009 0.001
Hemoglobin changes (g/dL) per transfused RBCs of 10 mL/kg, median (range)
Day 1 1.30 (0.60-2.60) 1.50 (-0.20-4.50) 1.15 (-0.70-3.90) 14 97 50 0.828 0.155 0.012
Day 2 2.00 (-2.20-2.70) 1.60 (-4.90-4.40) 0.85 (-1.90-4.60) 12 91 47 0.153 0.004 0.001
Day 3 2.10 (1.20-3.10) 1.50 (-0.40-5.00) 0.90 (-1.70-5.50) 11 89 43 0.022 0.003 0.002
Day 4 2.20 (1.30-3.70) 1.60 (0.10-5.30) 0.80 (-2.00-4.70) 10 81 43 0.066 0.002 <0.001
Day 5 2.20 (1.30-4.80) 1.75 (-0.40-7.00) 0.90 (-2.10-4.20) 9 78 37 0.073 0.002 0.001
Day 6 2.25 (1.40-4.80) 1.70 (-0.10-7.90) 1.20 (-0.70-2.80) 8 71 31 0.047 0.001 0.002
Day 7 2.45 (1.50-5.50) 1.75 (-0.70-7.60) 0.80 (-0.80-2.50) 8 68 28 0.040 <0.001 0.001
*P values were obtained from Mann-Whitney U test.
Abbreviation: RBC, red blood cell.
intensive clinical study focusing on the efficacy of transfusion in AIHA patients has not been performed.
In the present study, many AIHA patients had underlying dis- eases including hematologic malignancy, solid tumor, autoim- mune disease, and infection. This result is consistent with previ- ous studies [1, 2] and supports recent hypothesis that autoanti- bodies found in AIHA may be a result of immune reactions in response to foreign pathogen. Significantly, our study revealed that although initial hemoglobin levels prior to transfusion were lower in patients with autoantibodies than those with alloanti- bodies only, patients with autoantibodies recovered preferen- tially at long-term follow-up compared with those with alloanti- bodies only. We also found that transfusion efficacy in AIHA pa- tients is not inferior if appropriately transfused with the least-in-
compatible RBCs and found no evidence of acute hemolytic transfusion reaction within 24 hr of transfusion. Furthermore, transfusion-induced changes in both total bilirubin and LDH were not significantly different among three patient groups, with the AIHA patients showing an absence or negative total bilirubin and LDH changes consistently after post-transfusion day 2. Al- together, these results support the safety and efficacy of RBC transfusion in AIHA patients.
Theoretically, the strength of DAT positivity in AIHA patients would be positively correlated with the degree of RBC destruc- tion. Previous studies reported that 86% of patients with DAT positivity who experienced hemolysis had strength of ≥2+ [5], and that severe hemolysis is associated with stronger DAT posi- tivity [11]. However, it has also been shown that the strength of the antiglobulin reaction and RBCs destruction rates correlate poorly [13, 14]. Therefore, the effect of DAT strength on hemo- lysis is currently under debate [15]. Our study found no signifi- cant correlation between DAT strength and hemoglobin changes, and supports previous studies describing no signifi- cant influence on transfusion efficacy by either autoantibody type or DAT specificity [13, 14]. A possible hypothesis for this phenomenon is that RBC destruction rates are partially related to IgG autoantibody subclasses, as both affinity to the macro- phage Fc receptor and their complement-fixing activity differ among antibody subclasses [1].
Interestingly, although the absolute volumes of transfused RBCs were significantly greater in patients with severe anemia, the therapeutic effect of the transfusion was significantly greater for seven consecutive days after transfusion in the patients with severe anemia compared with those with mild-moderate ane- mia. This supports previous guidelines that considered transfu- sion in symptomatic patients with RBC autoantibodies [1, 2, 4, 8, 11]. Additionally, we found no significant correlation between steroid therapy status and transfusion efficacy. This result is op- posite to previous beliefs suggesting steroids as a therapeutic mainstay in AIHA. However, as we did not include the patients receiving steroid therapy alone as a comparable patient group, our result should be interpreted with caution and a further study should be performed for confirmation.
Our study has a limitation in the assessment of hemolysis risk, since only total bilirubin and LDH were used as hemolysis mark- ers, rather than serum haptoglobin and plasma hemoglobin lev- els. This limitation was from the retrospective study design, since analysis of these markers is not routinely performed in the clinic.
Thus, the results presented here should be interpreted with cau- tion until a further comprehensive study is completed.
In conclusion, the transfusion of the least-incompatible RBCs to the patients with autoantibodies yielded similar increases in hemoglobin levels without an associated risk of hemolysis com- pared with those patients with alloantibodies only or without an- tibodies. In addition, autoantibody type, DAT specificity, DAT strength, and steroid therapy status had no influence on trans- fusion efficacy. This suggests that RBC transfusion is expected to be an effective and safe method of therapy in AIHA patients, especially in those with severe anemia.
Authors’ Disclosures of Potential Conflicts of Interest
No potential conflicts of interest relevant to this article were re- ported.
REFERENCES
1. Packman CH. Hemolytic anemia due to warm autoantibodies. Blood Rev 2008;22:17-31.
2. Barros MM, Blajchman MA, Bordin JO. Warm autoimmune hemolytic anemia: recent progress in understanding the immunobiology and the treatment. Transfus Med Rev 2010;24:195-210.
3. Gehrs BC and Friedberg RC. Autoimmune hemolytic anemia. Am J He- matol 2002;69:258-71.
4. Reardon JE and Marques MB. Laboratory evaluation and transfusion support of patients with autoimmune hemolytic anemia. Am J Clin Pathol 2006;125(S):S71-7.
5. Wheeler CA, Calhoun L, Blackall DP. Warm reactive autoantibodies:
clinical and serologic correlations. Am J Clin Pathol 2004;122:680-5.
6. Roback JD, Combs MR, et al. eds. Technical manual. 16th ed. Bethes- da: American Association of Blood Banks, 2008:511.
7. Hillyer CD, Silberstein LE, et al. eds. Blood banking and transfusion medicine. 2nd ed. Philadelphia: Elsevier, 2007:560-1.
8. Salama A, Berghöfer H, Mueller-Eckhardt C. Red blood cell transfusion in warm-type autoimmune haemolytic anaemia. Lancet 1992;340:
1515-7.
9. Petz LD. A physician’s guide to transfusion in autoimmune haemolytic anaemia. Br J Haematol 2004;124:712-6.
10. Leger RM and Garratty G. Evaluation of methods for detecting alloanti- bodies underlying warm autoantibodies. Transfusion 1999;39:11-6.
11. King KE and Ness PM. Treatment of autoimmune hemolytic anemia.
Semin Hematol 2005;42:131-6.
12. Viele MK and Weiskopf RB. What can we learn about the need for transfusion from patients who refuse blood? The experience with Jeho- vah’s Witnesses. Transfusion 1994;34:396-401.
13. Wikman A, Axdorph U, Gryfelt G, Gustafsson L, Björkholm M, Lundahl J.
Characterization of red cell autoantibodies in consecutive DAT-positive patients with relation to in vivo haemolysis. Ann Hematol 2005;84:150-8.
14. Garratty G and Nance SJ. Correlation between in vivo hemolysis and the amount of red cell-bound IgG measured by flow cytometry. Transfusion 1990;30:617-21.
15. Garratty G. The James Blundell Award Lecture 2007: do we really un- derstand immune red cell destruction? Transfus Med 2008;18:321-34.