INTRODUCTION
Since the cancer has been the leading cause of deaths in Korea since the 1980s (1), estimating the cancer deaths for the upcoming years is necessary for the nationwide cancer con- trol, health resources planning, cancer surveillance, and qual- ity control for cancer registries (2). The aim of this study was to estimate the cancer deaths for the upcoming years using the vital statistics.
MATERIALS AND METHODS
The primary source of information about cancer deaths in Korea was the annual report on the cause of death statistics based on vital registration, which was compiled and published by Korea National Statistical Office (KNSO) (3). To estimate the number of cancer deaths expected to occur during the up- coming years, the mathematical modeling involved the actu- al number of cancer deaths reported by KNSO for each of the years 1983 through the most recent available year. The nota- tion used for cancer deaths involves ‘A’ for actual counts of
cancer deaths, ‘F’ for forecasted counts of cancer deaths, and
‘yy’ for the year. Thus ‘A_99’ refers to the actual number of cancer deaths in 1999 and ‘F_05’ refers to the forecasted counts of deaths in 2005.
We estimated the number of cancer deaths expected to occur in Korea for upcoming years using a two-step proce- dure (4). First, the actual number of cancer deaths (A_83, A_
84, ..., A_00) for each of the years 1983 through 2000 were fitted to a time series model in the SAS procedure PROC FORECAST (5) (Appendix). The model was then used to forecast an estimate of the number of cancer deaths expected to occur in Korea for the upcoming years (F_01, F_02, ..., F_
10) and to calculate the 95% confidence limits for the esti- mates. The options selected for the time series model includ- ed a linear or quadratic time trend, which incorporated long- term information into the model and an autoregressive com- ponent, which incorporated information about short-term fluctuations. To specify the degree of the time trend model was based on a comparison of the R-square statistics of obser- vation (6) (Table 1). Estimates of the number of cancer deaths in primary sites was calculated using the same modeling pro- cess that was used for all cancer deaths.
Jong-Myon Bae*�, Kyu-Won Jung*, Young-Joo Won*
Cancer Registration & Biostatistics Branch*, National Cancer Center, Goyang; Department of Preventive Medicine�, Cheju National University College of Medicine, Cheju, Korea
Address for correspondence Jong Myon Bae, M.D.
Cancer Registration & Biostatistics Branch, National Cancer Center, 809 Madu 1-dong, Ilsan-gu, Koyang 411-351, Korea
Tel : +82.31-920-2131, Fax : +82.31-920-2139 E-mail : [email protected]
*This work was supported by Research Grant N01E020 from the National Cancer Center, Korea.
611
Estimation of Cancer Deaths in Korea for the Upcoming Years
Since the cancer has been the leading cause of deaths in Korea, estimation of the cancer deaths for the upcoming years in the population using the vital statis- tics is considered to be necessary. The aim of this study was to estimate the num- ber and trends of cancer deaths in Korea. The expected numbers of cancer deaths were calculated by a time series model fitting the actual numbers of cancer deaths for each of the years 1983 through 2000 reported by Korea National Statistical Office. The options selected for the time series model included a quadratic time trend, which incorporated long-term information into the model and an autoregres- sive component which incorporated information about short-term fluctuations. The forecasting numbers of cancer deaths and their 95% confidence intervals were estimated for both genders and primary sites. The forecasting number of deaths from all cancers is increasing so that the cumulative number of expected cancer deaths between 2001 and 2005 would be about 309 thousand persons. Cancers of the lung, stomach, liver, and colorectum continue to be the most common causes of cancer deaths. While the numbers of expected cancer deaths in the stomach and liver show a decreasing trend, the cancer in the lung, colorectum, pancreas, breast, and oral cavity have an increasing trend. These observations indicate that cancer deaths in the near future would be increasing through the early 2000s, and there should be some urgent government’s policy on the cancer management.
Key Words : Forecasting; Vital statistics; Death; Neoplasms; Korea
Received : 21 March 2002 Accepted : 23 May 2002
RESULTS
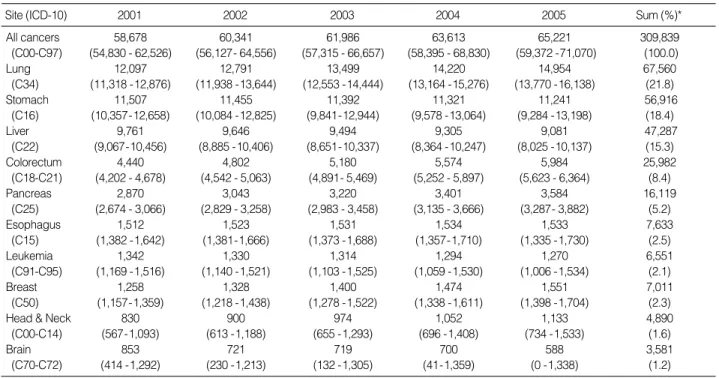
Annual observed and expected cancer deaths are given in Fig. 1. Table 2 summarizes the expected number of cancer deaths as well as deaths in the ten major sites of cancer-lung, stomach, liver, colorectum, pancreas, esophagus, leukemia, breast, head and neck, and brain for both genders combined in Koreans. The forecasting number of cancer deaths might be increasing so that the cumulative number of expected can- cer deaths between 2001 and 2005 would be 309,839 (95%
CI: 286,039-333,639). Cancers of the lung, stomach, liver, and colorectum continue to be the most common causes of cancer deaths. These four cancers account for more than 60%
of the total cancer deaths. Especially, the lung cancer would continuously be the leading cause of cancer death in the near
future. Through 2005, the expected number of deaths in can- cer of the lung, colorectum, pancreas, breast, and oral cavity would be increasing. But cancer deaths in the stomach, liver, leukemia, and brain would show a decreasing trend (Fig. 2).
Table 3 shows the expected number of all cancer deaths as well as deaths in the six major sites of cancer-lung, stomach, liver, colorectum, pancreas, and prostate in Korean men. The forecasting number of cancer deaths might be increasing through 2005. Among the six major cancers in men, the lung cancer would continuously be the leading cause of cancer
All cancers 58,678 60,341 61,986 63,613 65,221 309,839
(C00-C97) (54,830 - 62,526) (56,127- 64,556) (57,315 - 66,657) (58,395 - 68,830) (59,372 -71,070) (100.0)
Lung 12,097 12,791 13,499 14,220 14,954 67,560
(C34) (11,318 -12,876) (11,938 -13,644) (12,553 -14,444) (13,164 -15,276) (13,770 -16,138) (21.8)
Stomach 11,507 11,455 11,392 11,321 11,241 56,916
(C16) (10,357-12,658) (10,084 -12,825) (9,841-12,944) (9,578 -13,064) (9,284 -13,198) (18.4)
Liver 9,761 9,646 9,494 9,305 9,081 47,287
(C22) (9,067-10,456) (8,885 -10,406) (8,651-10,337) (8,364 -10,247) (8,025 -10,137) (15.3)
Colorectum 4,440 4,802 5,180 5,574 5,984 25,982
(C18-C21) (4,202 - 4,678) (4,542 - 5,063) (4,891- 5,469) (5,252 - 5,897) (5,623 - 6,364) (8.4)
Pancreas 2,870 3,043 3,220 3,401 3,584 16,119
(C25) (2,674 - 3,066) (2,829 - 3,258) (2,983 - 3,458) (3,135 - 3,666) (3,287- 3,882) (5.2)
Esophagus 1,512 1,523 1,531 1,534 1,533 7,633
(C15) (1,382 -1,642) (1,381-1,666) (1,373 -1,688) (1,357-1,710) (1,335 -1,730) (2.5)
Leukemia 1,342 1,330 1,314 1,294 1,270 6,551
(C91-C95) (1,169 -1,516) (1,140 -1,521) (1,103 -1,525) (1,059 -1,530) (1,006 -1,534) (2.1)
Breast 1,258 1,328 1,400 1,474 1,551 7,011
(C50) (1,157-1,359) (1,218 -1,438) (1,278 -1,522) (1,338 -1,611) (1,398 -1,704) (2.3)
Head & Neck 830 900 974 1,052 1,133 4,890
(C00-C14) (567-1,093) (613 -1,188) (655 -1,293) (696 -1,408) (734 -1,533) (1.6)
Brain 853 721 719 700 588 3,581
(C70-C72) (414 -1,292) (230 -1,213) (132 -1,305) (41-1,359) (0 -1,338) (1.2)
Site (ICD-10) 2001 2002 2003 2004 2005 Sum (%)*
Table 2.Expected numbers of cancer deaths (and 95% confidence intervals) in both genders in Korea
*Sum (%): the cumulated numbers of cancer deaths between 2001 and 2005 and its column percent.
80,000 70,000 60,000 50,000 40,000 30,000 20,000 10,000 0
1983 1985 1987 1989 1991 1993 1995 1997 1999 2001 2003 2005
Fig. 1. Annual observed and expected cancer deaths and those 95% confidence intervals.
Quadratic trend with autoregression 1261.2
Linear trend 1420.8
Quadratic trend 1403.8
Linear exponential smoothing 1478.1
Double exponential smoothing 1808.6
Damped Trend exponential smoothing 1476.2
Random walk with drift 1515.4
Log linear trend 1916.4
Log linear exponential smoothing 1547.1 Log double exponential smoothing 1869.3
Log random walk with drift 1597.2
Model Root mean square error
Table 1.Root mean square errors for specifying the degree of the time trend model
Observed Expected Lower Upper
deaths. The trends of cancer deaths by primary site would be as same as those in both genders (Fig 3).
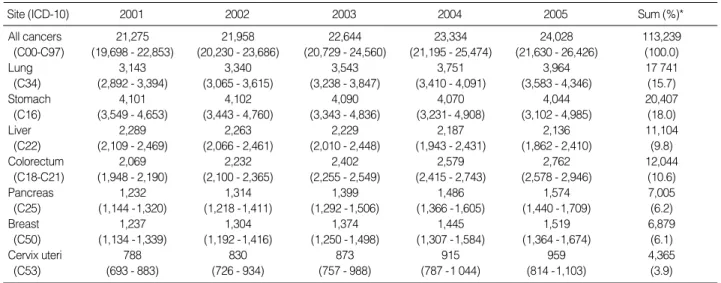
Table 4 shows the expected number of all cancer deaths as well as deaths in the seven major sites of cancer-lung, stom- ach, liver, colorectum, pancreas, breast, and uterine cervix in Korean women. The forecasting number of cancer deaths might be increasing through 2005 too. Although the stom- ach cancer would have a decreasing trend in death numbers, it would be the first leading cause of cancer deaths through 2005 (Fig. 4). The primary sites having increasing trends in cancer deaths would be the lung, colorectum, pancreas, breast, and uterine cervix.
DISCUSSION
Measurement of the burden of cancer in a population is es- sential in order to decrease the deaths from cancer. The Ameri-
70,000 60,000 50,000 40,000 30,000 20,000 10,000 0
Fig. 2. Trends of expected cancer deaths in both in Korea.
Year Both
2001 2002 2003 2004 2005
Person
16,000 14,000 12,000 10,000 8,000 6,000 4,000 2,000 0
All cancers 37,403 38,383 39,342 40,278 41,193 196,599
(C00-C97) (35,100 - 39,706) (35,861- 40,906) (36,546 - 42,138) (37,155 - 43,401) (37,692 - 44,694) (100.0)
Lung 9,033 9,492 9,977 10,480 10,995 49,977
(C34) (8,520 - 9,547) (8,888 -10,095) (9,299 -10,655) (9,720 -11,239) (10,143 -11,847) (25.4)
Stomach 7,356 7,324 7,286 7,242 7,192 36,400
(C16) (6,678 - 8,035) (6,581- 8,068) (6,462 - 8,110) (6,322 - 8,162) (6,160 - 8,223) (18.5)
Liver 7,472 7,382 7,264 7,119 6,945 36,182
(C22) (6,937- 8,007) (6,796 - 7,968) (6,615 -7,914) (6,393 -7,844) (6,132 - 7,758) (18.4)
Colorectum 2,371 2,570 2,778 2,996 3,223 13 938
(C18-C21) (2,212 - 2,530) (2,396 - 2,744) (2,586 - 2,971) (2,781- 3,211) (2,982 - 3,464) (7.1)
Pancreas 1,638 1,729 1,821 1,915 2,010 9,113
(C25) (1,507-1,769) (1,585 -1,873) (1,662 -1,981) (1,737- 2,093) (1,811- 2,209) (4.6)
Prostate 573 640 712 787 867 3,579
(C61) (523 - 622) (586 - 694) (651-772) (720 - 855) (791- 942) (1.8)
Site (ICD-10) 2001 2002 2003 2004 2005 Sum (%)*
Table 3.Expected numbers of cancer deaths (and 95% confidence intervals) in Korean men
*Sum (%): the cumulated numbers of cancer deaths between 2001 and 2005 and its column percent.
45,000 40,000 35,000 30,000 25,000 20,000 15,000 10,000 5,000 0
Fig. 3. Trends of expected cancer deaths in Korean men.
Year Men
2001 2002 2003 2004 2005
Person Persons in all cancers
Persons in all cancers
12,000 10,000 8,000 6,000 4,000 2,000 0
30,000 25,000 20,000 15,000 10,000 5,000 0
Fig. 4. Trends of expected cancer deaths in Korean women.
Year Women
2001 2002 2003 2004 2005
Person
4,500 4,000 3,500 3,000 2,500 2,000 1,500 1,000 500 0
Lung Esophagus
Stomach Leukemia
Liver Breast
Colorectum Pancreas All cancers
Lung Pancreas
Stomach Prostate
Liver All cancers
Colorectum
Lung Pancreas
Stomach Prostate
Liver
Cervix uteri All cancers Colorectum
Persons in all cancers
can Cancer Society (ACS) has estimated the number of new cancer cases and cancer deaths that are expected to occur in the whole United States and individual states during the up- coming years (7, 8). Using the current methods for estimation of the ACS (4), we tried to estimate the number of cancer deaths that are expected to occur in Korea in the near future.
However, the estimated number of cancer deaths for the upcoming years has limitations and should be interpreted with caution when used to study trends in cancer mortality (4). Although the estimates are based on the most recent avail- able cancer mortality data, the estimated numbers of deaths are computed before the year begins so that these estimates may vary considerably from year to year. On the other hand, unanticipated changes to cancer survivals (for example, acti- vation of cancer screening programs, development of a new modality of cancer diagnosis or treatments, etc), could be a factor for instability of these expectations.
The problem of choosing a forecast approach depends on the relative performance of the models for monitoring and prediction, with an adequate interpretation of the phenome- non under study (9). Since selection of the models could be based on the logarithm of the predictive likelihood error (10), this study used the R-square statistic and sigma types of ob- servation in order to specify the degree of the time trend mo- del.
Five possible choices for an estimate were considered as ac- ceptable: the forecast itself, the upper or lower 95% confi- dence limit, and the midpoints between the forecast and the upper or lower confidence limit (3). When appropriate, the forecast itself with confidence limits was selected as the esti- mate to compensate for the effects of recently changing mor- tality rates or large year-to-year variations in the number of cancer deaths (11).
REFERENCES
1. National Statistical Office (Republic of Korea). Annual report on the cause of death statistics (based on vital registration). Seoul: The Office; 2001.
2. Pickle LW, Feuer EJ, Edwards BK, National Cancer Institute. Pre- diction of incident cancer cases in non-SEER counties. Proceedings of the Biometrics Section of the 2000 Annual Meeting of the Ameri- can Statistical Association. 2001: 45-52.
3. National Statistical Office (Republic of Korea). Korea Statistical In-
formation System. Available from: URL: http://kosis.nso.go.kr.
4. Wingo PA, Landis S, Parker S, Bolden S, Health CW. Using cancer registry and vital statistics data to estimate the number of new can- cer cases and deaths in the United States for the upcoming year. J Reg Management 1998; 25: 43-51.
5. SAS Institute Inc. SAS/ETS User’s Guide. Version 8. Cary NC: SAS Institute Inc. 1999: 577-631.
6. SAS e-Intelligence. Time series. Available from: URL: http://www.
sas.com/korea.
7. Greenlee RT, Hill-Harmon MB, Murray T, Thun M. Cancer statis- tics, 2001. CA Cancer J Clin 2001; 51: 15-36.
8. Jemal A, Thomas A, Murray T, Thun M. Cancer statistics, 2002. CA Cancer J Clin 2002; 52: 23-47.
9. Nobre FF, Monteriro ABS, Telles PR, Williamson GD. Dynamic linear model and SARIMA: a comparison of their forecasting perfor- mance in epidemiology. Statist Med 2001; 20: 3051-69.
10. Pole A, West M, Hamson J. Applied Bayesian forecasting and time series analysis. Texts in Statistical Science. Champman & Hall: New York: 1994.
11. Wingo PA, Ries LAG, Rosenberg HM, Miller DS, Edwards BK.
Cancer incidence and mortality 1973-1995: a report card for the US.
Cancer 1998; 82: 1197-207.
All cancers 21,275 21,958 22,644 23,334 24,028 113,239
(C00-C97) (19,698 - 22,853) (20,230 - 23,686) (20,729 - 24,560) (21,195 - 25,474) (21,630 - 26,426) (100.0)
Lung 3,143 3,340 3,543 3,751 3,964 17 741
(C34) (2,892 - 3,394) (3,065 - 3,615) (3,238 - 3,847) (3,410 - 4,091) (3,583 - 4,346) (15.7)
Stomach 4,101 4,102 4,090 4,070 4,044 20,407
(C16) (3,549 - 4,653) (3,443 - 4,760) (3,343 - 4,836) (3,231- 4,908) (3,102 - 4,985) (18.0)
Liver 2,289 2,263 2,229 2,187 2,136 11,104
(C22) (2,109 - 2,469) (2,066 - 2,461) (2,010 - 2,448) (1,943 - 2,431) (1,862 - 2,410) (9.8)
Colorectum 2,069 2,232 2,402 2,579 2,762 12,044
(C18-C21) (1,948 - 2,190) (2,100 - 2,365) (2,255 - 2,549) (2,415 - 2,743) (2,578 - 2,946) (10.6)
Pancreas 1,232 1,314 1,399 1,486 1,574 7,005
(C25) (1,144 -1,320) (1,218 -1,411) (1,292 -1,506) (1,366 -1,605) (1,440 -1,709) (6.2)
Breast 1,237 1,304 1,374 1,445 1,519 6,879
(C50) (1,134 -1,339) (1,192 -1,416) (1,250 -1,498) (1,307 -1,584) (1,364 -1,674) (6.1)
Cervix uteri 788 830 873 915 959 4,365
(C53) (693 - 883) (726 - 934) (757 - 988) (787 -1 044) (814 -1,103) (3.9)
Site (ICD-10) 2001 2002 2003 2004 2005 Sum (%)*
Table 4.Expected numbers of cancer deaths (and 95% confidence intervals) in Korean women
*Sum (%): the cumulated numbers of cancer deaths between 2001 and 2005 and its column percent.
The FORECAST procedure provides a quick and automatic way to generate forecasts for many time series in one step. We adapt the stepwise autoregressive method. This method combines time trend regression with an autoregressive model and uses a stepwise method to select the lags to use for the autoregressive process as below,
Deatht= + ∙t+ ∙t2+υt, for t=1983, 1984, ...., 2000 where υt= 1∙υt-1+ 2∙υt-2+…+ p∙υt-p+ t
Appendix