혈압 변동에 의한 비만 지수 및 심전도 양상의 변화
원광보건대학 임상병리과ㆍ연세대학교 생체공학 협동과정1
진복희ㆍ박선영1ㆍ장미경
Changes of Pattern of Obesity Index and Electrocardiogram in Blood Pressure Variation
Jin, Bok Hee., Park, Sun Young
1., Jang, Mi Kyung
Department of Clinical Pathology, Wonkwang Health Science College Department of Biomedical Engineering, The Graduate School Yonsei University
1Recently, the economical level improvements for the Koreans have caused many changes in a mode of living and dietary life of the aspects of disease. Hypertension is one of the chronic senile blood-vessel diseases that is very common in the late 40's and hard to control its progression, since it predisposes of many circulating diseases. Therefore, we have looked for the relationship between the variations of blood pressure and the diseases that are associated with diet and life, so that we hope to use this data as standardized treatment and management in order to prevent hypertension by reducing risk factors and finding effective treatment. We targeted for 428 people over 40 years old(male 226 and female 256) who had visited to the comprehensive medical examinations for lifestyle related diseases to the dept. of Clinical Pathology, Sungdong-Gu Health Center from February to May, 2002. And, we measured systolic/diastolic blood pressures in order to classify normal range blood pressure group(NRBPG), borderline hypertension group(BHG) and definite hypertension group(DHG) and compared/analyzed each individual's obesity, electrocardiogram and blood serum work-up. The systolic/diastolic blood pressures of subjects were within of NRBPG for all age groups, and there were not of the blood pressure variation with increasing age. The blood pressure ranges for subjects' systolic/diastolic blood pressures were 32.4% for NRBPG, 16.2% for BHG and 2.5% for DHG. BMI(p<0.001) and PIBW(p<0.01) in systolic blood pressure variation and BMI(p<0.01) and PIBW(p<0.05) in diastolic blood pressure variation were significantly different between three groups.
However heart rate, PQ interval/QT interval in electrocardiogram, total cholesterol and glucose level according to the systolic/diastolic blood pressure variation were not significantly different between three groups. Age(p<0.05), body weight(p<0.01), BMI(p<0.01), PIBW(p<0.05) and total cholesterol (p<0.05) in total blood pressure variation were significantly different between three groups. while height, heart rate, PQ
임상병리검사과학회지 : 35권 제2호, 223-229, 2003
1)
교신 저자: 진복희, (우)570-750 전북 익산시 신룡동 344-2번지 원광보건대학 임상병리과
Tel: 063-840-1217 E-mail: [email protected]
interval/QT interval in electrocardiogram, and glucose level. were not significantly different between three groups. We have found that age is major risk factor and increased serum total cholesterol level secondary to obesity that has closely related to body weight, BMI, PIBW of increase and westernized life/food style is highly related to the aspects of hypertension. Therefore, hypertension is gradually increased as the major risk factor of circulating diseases, and it has confronted as the critical public health issue. We have exhibited the materials for the possible early findings of hypertension, prevention, management, and effective treatment of it, so that we can diminish the risk factors for hypertension.
Key Words: Blood Pressure Variation, BMI, PIBW, Electrocardiogram
I. 서 론
최근 우리나라는 경제수준의 향상에 따른 생활양식과 식습관의 서구화로 질병양상에도 많은 변화를 가져왔다.
그 중 혈압은 40대 이후 가장 빈도가 높고 관리가 잘 안 되는 혈관의 만성 퇴행성질환으로 순환기계 질환의 중요 한 위험인자로 알려져 있다(허갑범, 1993). 심혈관계 질환 은 우리나라 사망원인 중 1위를 차지한바 있으며(보건사 회부, 1992), 통계청(1995) 발표에서는 순환기계 질환에 의한 사망이 전체 사망자 수의 26.3%였다고 보고한바 있 다.
혈압은 동맥벽의 내압이며 여러 복합인자가 심박출량 과 총 말초혈관저항에 작용하여 변동하는 생리적 지표이 다. 심박출량과 총 말초혈관저항은 혈류 중 체액성 인자 나 혈관의 구성요소 자체 혹은 극히 주변 조직에서 생산 되는 혈관 작동성 물질 등에 의해 규정되며 이러한 물질 변동 혹은 그 특이적인 수용체 변화에 의해 변동하는 것 에 의해 혈압이 변동한다(高橋, 1999). 동맥 경화증은 신 혈관성 고혈압, 뇌혈관 장애에 의한 고혈압, 협심증을 수 반하는 고혈압 등의 원인이 되므로 주목해야할 병태의 하나이며 그 위험인자의 평가 및 동맥 경화증의 형태, 진 단 등도 중요하다. 고혈압은 소수이면서 신질환이나 내분 비 이상 등의 원인이 있는 기초 질환을 가지는 이차성 고 혈압과 대부분을 차지하나 원인이 분명하지 않은 본태성 고혈압으로 분류된다. 보통 임상에서 볼 수 있는 고혈압 환자의 약 90%는 본태성 고혈압으로 단일 질환이 아니라 여러 가지 병변이 혼합되어 있을 가능성이 많다(池田, 1982 ; 高橋, 1999). 앞으로도 고혈압은 인구의 고령화 및 과체중, 비만의 증가와 더불어 국민 보건상 많은 문제가 예상되므로 혈압 변동에 의한 생활습관병과 밀접한 관련 이 있는 측정 지표들의 변화를 보아 고혈압의 예방, 위험
인자의 감소 및 효율적인 치료를 위한 기초 자료로 사용 하고자 한다.
II. 대상 및 방법
1. 대상
2002년 2월부터 5월까지 서울시 성동구 보건소 임상병 리과에서 생활습관병 건강검진을 받은 40대 이상의 성인 남녀 482명중 남자 226명(46.89%), 여자 256명(53.11%) 을 대상으로 하였다(Table 1).
Sex Age
Male Female Total
No. % No. % No. %
40 ~ 49 62 12.86 76 15.77 138 28.63 50 ~ 59 75 15.56 86 17.84 161 33.40 60 ~ 69 63 13.07 65 13.49 130 26.56 70 ~ 79 26 5.39 29 6.02 55 11.41 Total 226 46.88 256 53.12 484 100.00 Table 1. Distributions of sex and age
2. 방법
혈압은 10분 이상 안정하게 한 후 앉은 자세에서 자동
혈압계를 이용하여 수축기 혈압(systolic blood pressure,
SBP)과 확장기 혈압(diastolic blood pressure, DBP)을 측
정하였다. 세계 보건기구(WHO)에서 정의한 분류에 의해
SBP가 140mmHg 이하이거나 DBP가 90mmHg 이하를
정상 혈압군(normal range blood pressure group, NRBPG), SBP가 140~160mmHg이거나 DBP가 90~
95mmHg인 경우를 경계영역 고혈압군(borderline hyper- tension group, BHG), SBP가 160mmHg 이상이거나 DBP 가 95mmHg 이상을 확정영역 고혈압군(definite hyperten- sion group, DHG)으로 하였다. 비만도는 신장 및 체중을 계측한 후 체질량 지수(body mass index, BMI)와 표준 체 중 백분률(percent ideal body weight, PIBW)을 구하였다.
BMI가 20㎏/m
2이하는 저체중, 20~24kg/m
2범위는 정상 체중, 24~26.5kg/m
2범위는 과체중, 26.5kg/m
2이상은 비 만으로 분류하였다. PIBW가 90% 이하는 저체중, 91~
110% 범위는 정상 체중, 111~119% 범위는 과체중, 120% 이상은 비만으로 분류하였다(서 등, 1992). 심전도 는 대상자를 바로 누운 자세에서 약 10분간 안정시킨 후 감도 1(10mm/mV), 표준기록속도 25mm/초에서 표준 12 유도 심전도를 기록하여 심박동수, PQ간격, QT간격을 계 측하였다. 혈청 총 콜레스테롤과 혈당은 이른 아침 공복 시 정맥 채혈하여 실온에 1시간 이상 방치한 후 3,000rpm 에서 10분 정도 원심 침전하여 혈청을 분리하였다. 혈청 총 콜레스테롤은 cholesterol oxidase법에 의해, 혈당은 hexokinase법에 의해 생화학 자동 분석장치(Hitachi 7600., Japan)를 이용하여 분석하였다.
측정된 자료의 통계처리는 SPSS/PC Package를 이용하 여 처리하였고, 모든 측정치는 평균±표준편차로 나타냈 다. 각 군간의 측정치의 유의성을 평가하기 위해서 ANOVA test를 시행한 후 Duncans multiple range test를 하여 각 군간의 유의한 차이(significant difference)를 검 정하였다. 검정 시에 p값이 0.05 이하이면 통계적으로 유 의하다고 판정하였다.
III. 결 과
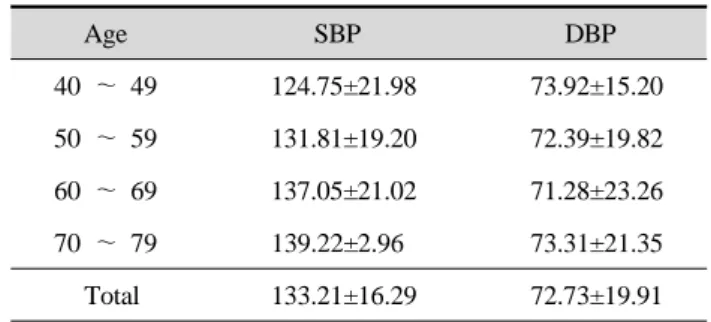
대상자의 SBP는 133.21±16.29mmHg, DBP는 72.73±
19.91mmHg로 각 연령층은 정상 혈압군에 포함되었으며 연령 증가에 의한 혈압 변동은 볼 수 없었다(Table 2).
대상자의 SBP 및 DBP 분포는 NRBPG가 156명 (32.4%), BHG가 78명(16.2%), DHG가 12명(2.5%)이었다 (Table 3).
연령은 세 군간에 유의한 차이가 있으며(p<0.05) BHG 와 DHG가 NRBPG 보다 증가하였다. 신장은 세 군간에 유의한 차이가 없으나 체중은 세 군간에 매우 유의
DBP SBP
NRBPG BHG DHG Total
No. % No % No. % No. %
NRBPG 156 32.4 10 2.1 3 0.6 169 35.1 BHG 134 27.8 78 16.2 45 9.3 257 53.3
DHG 32 6.6 12 2.5 12 2.5 56 11.6
Total 322 66.8 100 20.8 60 12.4 482 100.0 Values are Mean±S.D; SBP: systolic blood pressure DBP: diastolic blood pressure; NRBPG: normal range blood pressure group ; BHG: borderline hypertension group DHG: definite hypertension group
Age SBP DBP
40 ~ 49 124.75±21.98 73.92±15.20 50 ~ 59 131.81±19.20 72.39±19.82 60 ~ 69 137.05±21.02 71.28±23.26 70 ~ 79 139.22±2.96 73.31±21.35 Total 133.21±16.29 72.73±19.91 Values are Mean±S.D; SBP: systolic blood pressure DBP: diastolic blood pressure
Table 2. Comparisons of systolic and diastolic blood pressure in age
Table 3. Distributions of systolic and diastolic blood pressure
한 차이가 있으며(p<0.01) DHG가 NRBPG와 BHG 보다 증가하였다(Table 4).
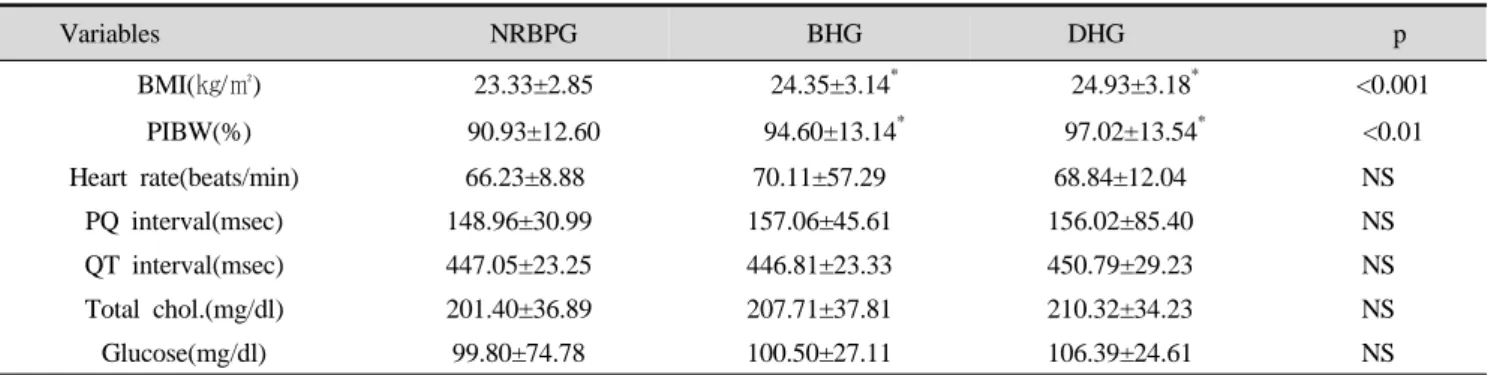
SBP 변동에 의한 BMI(p<0.001)와 PIBW(p<0.01)는 세 군간에 매우 유의한 차이가 있으며 모두 정상 체중 범위 에 포함되었으나 BHG와 DHG는 NRBPG 보다 증가되었 다. 심전도 기록에 의한 심박동수, PQ간격, QT간격은 세 군간에 유의한 차이는 없으나 모두 정상 동조율에 포함 되었다. 총 콜레스테롤, 혈당은 세 군간에 유의한 차이는 없었다(Table 5).
DBP 변동에 의한 BMI(p<0.01)와 PIBW(p<0.05)는 세
군간에 매우 유의한 차이가 있으며 모두 정상 체중 범위
에 포함되었으나 DHG는 NRBPG와 BHG 보다 증가되었
다. 심전도 기록에 의한 심박동수, PQ간격, QT간격은 세
군간에 유의한 차이는 없으나 모두 정상 동조율 포함되
었다. 총 콜레스테롤, 혈당은 세 군간에 유의한 차이는 없
었다(Table 6).
Variables NRBPG BHG DHG p
BMI(㎏/㎡) 23.33±2.85 24.35±3.14* 24.93±3.18* <0.001
PIBW(%) 90.93±12.60 94.60±13.14* 97.02±13.54* <0.01
Heart rate(beats/min) 66.23±8.88 70.11±57.29 68.84±12.04 NS
PQ interval(msec) 148.96±30.99 157.06±45.61 156.02±85.40 NS
QT interval(msec) 447.05±23.25 446.81±23.33 450.79±29.23 NS
Total chol.(mg/dl) 201.40±36.89 207.71±37.81 210.32±34.23 NS
Glucose(mg/dl) 99.80±74.78 100.50±27.11 106.39±24.61 NS
Values are Mean±S.D; NRBPG: normal range blood pressure group ; BHG: borderline hypertension group
DHG: definite hypertension group ; BMI: body mass index ; PIBW: percent ideal body weight ; * Significantly higher than NRBPG
* NS: not significant
Table 5. Comparisons of BMI, PIBW, heart rate, electrocardiogram, total cholesterol and glucose in systolic blood pressure variation
Variables NRBPG BHG DHG p
BMI(㎏/㎡) 23.75±3.13 24.48±2.82 25.01±3.09* <0.01
PIBW(%) 92.56±13.19 95.00±12.34 96.81±12.51* <0.05
Heart rate(beats/min) 69.34±51.45 66.95±9.33 67.43±8.36 NS
PQ interval(msec) 152.13±39.51 164.21±74.65 153.20±30.54 NS
QT interval(msec) 447.50±24.33 447.64±20.04 446.10±20.91 NS
Total chol.(mg/dl) 204.40±38.02 211.11±35.65 209.82±34.82 NS
Glucose(mg/dl) 99.89±59.98 102.23±23.86 104.45±32.67 NS
Values are Mean±S.D; NRBPG: normal range blood pressure group ; BHG: borderline hypertension group
DHG: definite hypertension group ; BMI: body mass index ; PIBW: percent ideal body weight ; * Significantly higher than NRBPG
* NS: not significant
Table 6. Comparisons of BMI, PIBW, heart rate, electrocardiogram, total cholesterol and glucose in diastolic blood pressure variation
Variables NRBPG BHG DHG p
Age(yrs) 54.33±9.30 57.98±9.83* 57.71±11.26* <0.05
Height(cm) 158.48±8.41 159.48±8.38 159.64±8.48 NS
Body weight(kg) 58.56±8.65 62.16±8.74 64.43±11.39* <0.01
Values are Mean±S.D; NRBPG: normal range blood pressure group; BHG: borderline hypertension group;
DHG: definite hypertension group * Significantly higher than NRBPG ; * NS: not significant Table 4. Comparisons of age, height and body weight in blood pressure variation
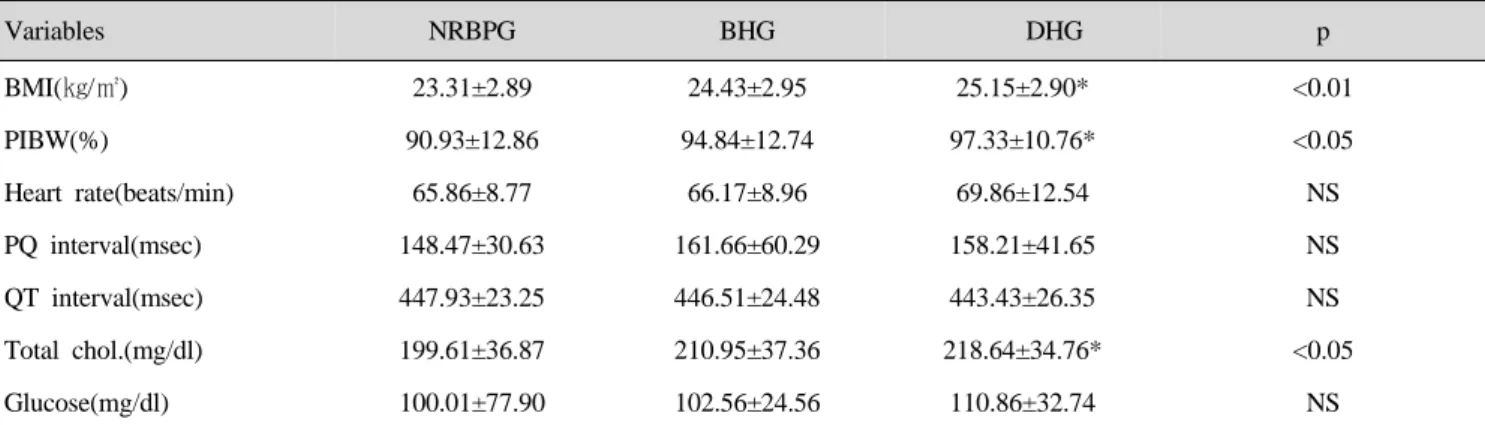
총 혈압 변동에 의한 BMI(p<0.01)와 PIBW(p<0.05)는 세 군간에 매우 유의한 차이가 있으며 모두 정상 체중 범 위에 포함되었으나 DHG는 NRBPG와 BHG보다 증가되 었다. 심전도 기록에 의한 심박동수, PQ간격, QT간격은 세 군간에 유의한 차이는 없으나 모두 정상 동조율에 포 함되었다. 총 콜레스테롤은 세 군간에 유의한 차이가 있 으나(p<0.05) 혈당은 유의한 차이가 없었다(Table 7).
IV. 고 찰
고혈압은 혈관계의 기초질환 내지 촉진인자로서 지속 적인 고혈압에 의한 심장, 혈관계 질환의 예방, 치료 및 사회생활의 활동성을 유지하는데 중요한 공중 보건 문제 로 주목되고 있다(飯村, 1982).
관상동맥질환과 관련된 중요한 위험인자는 연령, 체중,
당뇨, 에스트로겐, 알콜, 가족력, 흡연 등이 알려져 있으
Variables NRBPG BHG DHG p
BMI(㎏/㎡) 23.31±2.89 24.43±2.95 25.15±2.90* <0.01
PIBW(%) 90.93±12.86 94.84±12.74 97.33±10.76* <0.05
Heart rate(beats/min) 65.86±8.77 66.17±8.96 69.86±12.54 NS
PQ interval(msec) 148.47±30.63 161.66±60.29 158.21±41.65 NS
QT interval(msec) 447.93±23.25 446.51±24.48 443.43±26.35 NS
Total chol.(mg/dl) 199.61±36.87 210.95±37.36 218.64±34.76* <0.05
Glucose(mg/dl) 100.01±77.90 102.56±24.56 110.86±32.74 NS
Values are Mean±S.D ; NRBPG: normal range blood pressure group ; BHG: borderline hypertension group DHG: definite hypertension group BMI: body mass index ; PIBW: percent ideal body weight ; * Significantly higher than NRBPG ; * NS: not significant
Table 7. Comparisons of BMI, PIBW, heart rate, electrocardiogram, total cholesterol and glucose in blood pressure variation