• 검색 결과가 없습니다.

Method of deriving the acoustic impedance and sound absorption coefficient of materials by manipulating electrical impedance of a loudspeaker

N/A
N/A
Protected

Academic year: 2021

Share "Method of deriving the acoustic impedance and sound absorption coefficient of materials by manipulating electrical impedance of a loudspeaker"

Copied!
7
0
0

로드 중.... (전체 텍스트 보기)

전체 글

(1)

I. Introduction

To reduce noise in a room, sound absorptive materials are a prerequisite and therefore are widely used in the buildings. When developing sound absorptive materials, sound absorption performance should be monitored in every developing step for better results. Also in designing

a new acoustic environment of a room, measurement of sound absorption of the candidate materials could gua- rantee the correct estimation of the reverberation time.

Methods of sound absorption coefficient measurement are internationally standardized in ISO354 (reverberation room method) [1] or ISO10534-2 (transfer function method in the impedance tube). [2] Reverberation room method is

Method of deriving the acoustic impedance and sound absorption coefficient of materials by manipulating

electrical impedance of a loudspeaker

스피커의 전기적 임피던스를 이용한 시료의 음향임피던스와 흡음계수 도출 기법

Sejin Doo 1†

(두세진 1† )

1

Decoton Inc.

(Received March 22, 2021; accepted May 11, 2021)

ABSTRACT: When measuring the sound absorption coefficient of a specimen, a reverberation room which is costly or an impedance tube which has limitations in measuring low frequencies have been engaged. In this paper, a new measurement method of acoustic impedance or sound absorption coefficient has been suggested, which does not need microphones and only uses electrical impedance measurement data and derived Thiele/Small parameters of a speaker. The theory of this method has been described using equivalent circuit of the loudspeaker and acoustic properties of a test specimen are measured to demonstrate the validity of this method. It was confirmed that this method can easily measure the sound absorption coefficient in the low frequency band, which was previously difficult to trust. The advantages, limitations, and applicability of this method are discussed.

Keywords: Sound absorption, Acoustic impedance, Speaker, Equivalent circuit, Measurement

PACS numbers: 43.58.Bh, 43.38.Dv, 43.55.Ev

초 록: 시료의 흡음률 측정을 위해서는 비용이 많이 드는 잔향실 혹은 저주파수에서의 측정에 한계가 있는 임피던스 튜브를 사용한다. 본 논문에서는 마이크로폰을 사용하지 않고 단지 스피커 임피던스와 이로부터 도출된 Thiele/Small 변수만을 사용하여 시료의 음향임피던스와 흡음률을 구하는 기법을 제안하였다. 스피커의 등가회로를 이용하여 이 방법의 이론을 설명하였으며, 시료의 측정을 통하여 본 방법의 유효성을 증명하였다. 본 방법은 기존에 신뢰하기 어려 웠던 저주파 대역에서의 흡음률을 매우 쉽게 측정할 수 있음을 확인하였다. 본 방법의 장점과 제한사항, 그리고 응용 분야에 대해서 검토하였다.

핵심용어: 흡음, 음향 임피던스, 스피커, 등가회로, 측정

†Corresponding author: Sejin Doo ([email protected])

Decoton Inc., 1182 Gwangyeoro, Sanbukmyeon, Yeoju, Gyeonggi Province 12603, Republic of Korea (Tel: 82-1877-8827, Fax: 82-504-765-9525)

Copyrightⓒ2021 The Acoustical Society of Korea. This is an Open Access article distributed under the terms of the Creative Commons

Attribution Non-Commercial License which permits unrestricted non-commercial use, distribution, and reproduction in any medium, provided

the original work is properly cited.

(2)

based on the condition of 100 % diffuse field and therefore it gives practically realistic values of sound absorption coefficients. It has a drawback, however, as it sometimes gives more values than 1.0 of sound absorption coefficient due to the edge effect of the specimen installation, which is not theoretically acceptable. Also internal volume of 200 m 3 , precise temperature and humidity control, 5 micro- phones and the relevant measuring systems mean a big investment.

The transfer function method was proposed in the 1980s [3,4] and has been internationally standardized, but the problem was that only the sound absorption coefficient under the condition of normal incidence could be obtained, the hassle of calibration of two or three microphones, and uncertainty in the low frequency ranges.

In addition to these two methods, other attempts were also proposed. Farina proposed the sound intensity method rather than the transfer function method, and emphasized that the method was more advanced. [5]

In particular, new attempts are still limited, as neither the reverberation chamber method nor the transfer function method provides a reliable solution for the measurement of the sound absorption coefficient below 100 Hz. [6]

In this paper, a new method of measuring acoustic properties of the materials, which is especially consistent at the low frequencies is proposed: It does not employ the microphones or the long tube to measure sound pressure at all and instead utilize the equivalent circuit of the loud- speaker to extract acoustic impedance of the specimen, which again converts to sound absorption coefficient with ease.

II. Equivalent circuit of the loudspeaker with acoustic terminals

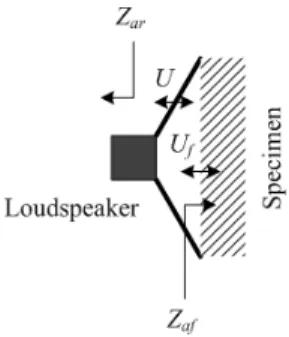
If a specimen is installed near the loudspeaker dia- phragm as shown in Fig. 1, when the volume velocity of the diaphragm is  , a volume velocity  different from

 is applied to the specimen surface due to the elasticity of air formed between the specimen and the diaphragm. If the acoustic impedance at the back of the diaphragm is   and the acoustic impedance at the surface of the specimen installed in front of the diaphragm is   , the equivalent circuit of the loudspeaker at low frequency ranges where the diaphragm of the loudspeaker vibrates as a piston can be expressed as shown in Fig. 2,

where,

  : series DC resistance

  : series coil inductance

 : parallel inductance associated with coil loss  

Fig. 2. Equivalent circuit of the loudspeaker with a specimen near the front of the diaphragm.

Fig. 1. Volume velocity of a loudspeaker diaphragm

 and that at the surface of the specimen 

. 



and 



are the acoustic impedances on the specimen

surface and at the rear of the loudspeaker respectively.

(3)

  : parallel resistance associated with inductance  

     : mass, compliance, and loss of the moving diaphragm of the loudspeaker respectively

 : acoustic impedance at the rear of the loudspeaker

 : acoustic impedance of the test specimen

  : compliance of the cavity between the loudspeaker diaphragm and the test specimen

 : force factor of the loudspeaker

  : effective diaphragm area of the loudspeaker

  : acoustic, mechanical, and electrical impedance of the loudspeaker seen from the each terminal respectively.

Acoustic impedance which is defined as pressure over volume velocity denotes as

         

        . (1)

For simple manipulation of the equations, motional impedance   can be defined as

       

  . (2)

Mechanical impedance of the loudspeaker reduces to

      . (3)

Electrical impedance of the loudspeaker incorporating electrical, mechanical and acoustical elements can be written as

        

   

   

 . (4)

Also, electrical impedance excluding resistances and inductances of the voice coil equates as

                 . (5)

Eq. (5) implies that   can be indirectly calculated by measuring the electrical impedance   of the loudspeaker and extracting the Thiele/Small parameters.

If the specimen is replaced with a rigid surface, the front acoustic impedance   becomes infinite and the acoustic impedance  is simplified to

          . (6)

In the condition that the front cavity of the loudspeaker is small and the frequency is low, 



 becomes dominant, and the   is connected in series with the  

of the loudspeaker. This lowers the total compliance, which increases the resonance frequency of the loud- speaker.   can therefore be readily calculated by

      ′  

, (7)

where   is the loudspeaker resonance frequency in free air and 

is that when the front cavity is small as in Fig. 1.

Also, volume of the front cavity of the loudspeaker can be calculated by the simple relation of

       . (8)

From Eqs. (3) and (6),  is expressed as

           

     

, (9)

where

           . (10)

Eq. (9) is then reduced to

(4)

   

  

. (11)

Boulandet [7] used an enclosure to measure the acoustic impedance   of the loudspeaker, but in this study, it can be easily measured by changing the loudspeaker com- pliance with only the space formed between the front and the hard surface of the loudspeaker. Several manipulations of the above equations yield the acoustic impedance of the specimen   as

   

 

             

 (12)

Absorption coefficient  is then calculated using the relation of

          , (13)

where   is the acoustic impedance of plane wave traveling in air.

III. Verification through experiment

3.1 Extract of   and  

To verify the effectiveness of this study, the loudspeaker impedance has been measured. The loudspeaker used in the experiment was a small full-range loudspeaker with an effective diameter of 70 mm, and the Praxis system of Liberty Instruments was used as a measurement and analysis system. Using the impedance measurement data along with the added mass method, Thiele/Small para- meters, which are the values of each element on the equivalent circuit in Fig. 1, have been extracted. The loudspeaker impedance graph measured in free air and that with the front of the loudspeaker blocked with a rigid panel are shown in Fig. 3. It resonated at 104 Hz in free

air and at 435 Hz when the loudspeaker surface was blocked, and   has been calculated using Eq. (7).

Since  and   used to obtain   have  in the denominator, the lower the frequency, the larger the their values. This means that the derivation of precise Thiele/

Small parameters is very important to obtain accurate   . Even with very small Thiele/Small parameter errors,  

reacts largely to represent an impractical value, and Boulandet’s study [7] also exemplifies this phenomenon.

Theoretical real and imaginary values of the acoustic radiation impedance of the piston radiator and the pulsating sphere similar to that of a loudspeaker decrease as the frequency decreases as shown in Eqs. (14) and (15), [8]

  ∝ 

 . (14)

∝  

 . (15)

For the case where the air cavity at the rear of the specimen is 50 mm, the acoustic radiation impedance  

has been calculated using Eq. (11) and is shown in Fig. 4.

For frequencies above the intermediate frequency, the

impedance increases rapidly, showing a graph similar to

the theoretical slope of the radiation impedance of the

piston radiator or pulsating sphere as in Eqs. (14) and

Fig. 3. (Color available online) (a) Magnitude of

electrical impedance of the loudspeaker in free air,

(b) phase of it, and (c) magnitude when the front

side is blocked with a rigid surface as in Fig. 1.

(5)

(15), but at low frequencies below 200 Hz, the acoustic radiation impedance increases as the frequency decreases.

This is a phenomenon that appears in other papers, [7,9] and more in-depth analysis of the cause is required.

3.2 Determination of acoustic impedance and sound absorption coefficient The loudspeaker impedance has been measured by flush-mounting the specimen into a cylindrical pipe with an inner diameter of 48 mm and installing the loudspeaker in close contact with the surface of the specimen as shown in Fig. 5.

Fig. 6 shows a graph of loudspeaker electrical impedance curves while changing the air cavity on the back of the specimen. Q is the largest when there is no rear air cavity, and it decreases as the rear air cavity deepens. As the condition of the specimen changes, the electrical impedance of the loudspeaker changes accordingly, which implies that the impedance of the loudspeaker acts as a important clue in measuring the acoustic impedance and the sound absorption coefficient. One thing to note is that above about 1 kHz, the impedance graph is almost identical regardless of the air cavity, which means that the loud- speaker no longer has sufficient sensitivity as a sensor.

Fig. 7(a) is the measured graph of the acoustic impedance at the surface of the specimen. The acoustic impedance of the plane wave has been overlaid in Fig. 7(b) for comparison of the values. It is informative to note that the more spacing (a) and (b) are, the greater the amount of

the reflection. Above about 1 kHz, the graph fluctuates very strongly because the sensitivity to sense through the loudspeaker is low and the assumption of lumped element modeling is difficult to apply due to the breakup vibration of the loudspeaker.

Fig. 4. Measured acoustic radiation impedance  

at the rear side of the loudspeaker.

(a) (b)

Fig. 5. (Color available online) Experimental apparatus with (a) the specimen installed, (b) the loudspeaker installed, respectively.

Fig. 6. (Color available online) Electrical impedance (magnitude) of the loudspeaker installed at the surface of the specimen with (a) 0 mm, (b) 50 mm, (c) 100 mm, and (d) 200 mm air cavity at the back of the specimen.

Fig. 7. (Color available online) (a) Measured acoustic

impedance of the specimen, (b) acoustic impedance

of plane wave ( 



).

(6)

Fig. 8 shows the sound absorption coefficient measured by the proposed method. It is surprising that even for low frequencies below 100 Hz, a very smooth curve has been obtained, which highlights that the sound absorption coefficient at the very low frequency ranges, which has been difficult to obtain using the conventional techniques, can be obtained with this method.

For comparison, the sound absorption coefficient has also been measured by the transfer function method utilizing the same specimen. The diameter of the im- pedance tube was 48 mm maintaining the plane wave up to 3 kHz, and the spacing between the two microphone was 50 mm. Fig. 9 shows the sound absorption coefficients obtained by the FFT of the impulse response between the loudspeaker and the microphones with two different window lengths (70 msec, 9 msec). Above 400 Hz, the two windows resulted in similar graphs, but in the low

frequency band below 400 Hz, very dissimilar graphs were obtained, indicating that it is difficult to trust the data in those low frequency ranges. Uncertainty of the transfer function method using 2 microphones is very large in the low frequency band. In addition, short windowing of 9 msec which uses only one reflection from the specimen did not calculate below 110 Hz.

In summary, it can be confirmed that the method of measuring the sound absorption coefficient by measuring the loudspeaker impedance can be an excellent method for measuring the sound absorption coefficient in the low frequency ranges.

IV. Conclusions

Measurement of the acoustic impedance or sound absorption coefficient of a material is very important to guarantee the acoustic performance of a building. ISO354 international standard costs too much and its sound absorption coefficient could be unrealistic due to the influence of the edge of the specimen. ISO10534-2 has weaknesses that it is valid only for normal incidence and that it is difficult to trust at low frequencies with a comparably short tube.

In this study, a new method has been proposed which can measure the acoustic impedance or the sound absorption coefficient only by measuring the loudspeaker impedance without the need for any microphones. The advantages of this method are as follows:

1) No need for a microphone or long tube.

2) It measures the surface acoustic condition of the specimen instead of measuring the traveling normal incidence with reflection.

3) Measurement at low frequencies that were previously impossible or unreliable is possible.

This method, however, has the following limitations:

1) For reliable results, it is necessary to extract very accurate T/S parameters of the loudspeaker.

2) It is valid only for frequencies below the breakup vibration of the loudspeaker.

Fig. 8. Sound absorption coefficient obtained by the proposed method with the same specimen of Fig. 1.

Fig. 9. (Color available online) Sound absorption

coefficient of the specimen with 50 mm air cavity

measured by the transfer function method (a) when

analyzed with 70 msec time window, and (b) with 9

msec time window.

(7)

As for the applications, since this measurement method is simple to use and portable, it can be easily applied for an in-situ measurement.

References

1. ISO 354, Acoustics - Measurement of Sound Absorp- tion in a Reverberation Room, 2003.

2. ISO 10534-2, Acoustics - Determination of Sound Absorption Coefficient and Impedance in Impedance Tubes – Part 2, 1998.

3. J. Y. Chung and D. A. Blaser, “Transfer function me- thod of measuring in-duct acoustic properties. Part I:

Theory,” J. Acoust. Soc. Am. 68, 907-913 (1980).

4. J. Y. Chung and D. A. Blaser, “Transfer function me- thod of measuring in-duct acoustic properties. Part II:

Experiment,” J. Acoust. Soc. Am. 68, 914-921 (1980).

5. A. Farina and A. Torelli, “Measurement of the sound absorption coefficient of materials with a new sound intensity technique,” Proc. AES 102

th

Convention, paper no. 4409 (1997).

6. D. Shearer, Measuring absorption below 100Hz with a P-U sensor, (Master’s. Thesis, South Bank University, 2016).

7. R. Boulandet, “Sensorless measurement of the acoustic impedance of a loudspeaker,” Proc. 23rd ICA. 7353- 7360 (2019).

8. L. E. Kinsler, A. R. Frey, A. B. Coppens, and J. V.

Sanders, Fundamentals of Acoustics, 4

th

ed (Wiley, New York, 1999), pp. 184-187.

9. X. Wang and Y. Xiang, “Probes design and experimental measurement of acoustic radiation resistance,” J. Acoust.

Vib. 22, 252-259 (2017).

Profile

▸Sejin Doo (두세진)

He received his B.Sc. in Electronics Eng. from Seoul National University in 1983. He experienced field application in Samsung Electronics from 1983 to 1984. He received his Ph.D. from Seoul National University in 1994 and worked as a professor at the Dong-ah institute of media and arts from 1997 to 2019. From 2007 to 2008, he served as an exchange professor at RPI.

He founded the audio semiconductor

company Neofidelity in 2000. He founded

another company Decoton inc. in 2018,

which specializes architectural acoustic

materials and is currently working as a

president/CEO. He is also working as an

acoustic consultant for architectural and

sound system design. His research interests

include electroacoustics, acoustic mea-

surement, acoustic signal processing, and

architectural acoustic design.

수치

Fig. 2. Equivalent circuit of the loudspeaker with a specimen near the front of the diaphragm.
Fig. 6 shows a graph of loudspeaker electrical impedance  curves while changing the air cavity on the back of the  specimen
Fig. 8. Sound absorption coefficient obtained by the  proposed method with the same specimen of Fig

참조

관련 문서

Most submerged lamp system have a fundamental fouling problem and due to the absorption of UV light by fouling materials on the quartz sleeve, germicidal power of UV

The design method for the optimization of FRP leaf spring is proposed by applying design method of experiment in order to improve the characteristics of

In this paper, it is implemented the image retrieval method based on interest point of the object by using the histogram of feature vectors to be rearranged.. Following steps

 Assuming the materials exist as a continuum, meaning the matter in the body is continuously distributed and fills the entire region of space it occupies..  A continuum is

Since this impedance exceeds the zone 3 setting of , the impedance during emergency loading lies outside the trip regions of the three-zone, directional impedance

It considers the energy use of the different components that are involved in the distribution and viewing of video content: data centres and content delivery networks

After first field tests, we expect electric passenger drones or eVTOL aircraft (short for electric vertical take-off and landing) to start providing commercial mobility

1 John Owen, Justification by Faith Alone, in The Works of John Owen, ed. John Bolt, trans. Scott Clark, "Do This and Live: Christ's Active Obedience as the