Background and Purpose Shift work disrupts the body’s circadian rhythms and increases the risk of health problems. Despite evidence of neuropsychological disturbances in shift work- ers (SW), the brain functional status as measured by brain perfusion in chronic shift work has not been evaluated previously. We investigated the regional cerebral blood flow (rCBF) in SW using perfusion MRI (pMRI) and evaluated the relationships between altered rCBF and sleep, mood, psychometric measures, and quality of life.
Methods Fifteen rotational SW and 15 day workers (DW) were enrolled. The participants were all female nurses working at a university-affiliated hospital. During 2 weeks of actigraphy they underwent pMRI scanning and psychometric testing on the last day immediately after working. Demographic characteristics, insomnia, daytime sleepiness, and mood were com- pared between the groups.
Results The participants were aged 35.3±2.9 years (mean±SD) and had been performing their current work for more than 2 years. The demographic characteristics did not differ be- tween SW and DW, but the levels of insomnia, anxiety, depression, and hyperactivity-restless- ness in psychometric measures were higher in SW than in DW. Cerebral perfusion in SW was significantly decreased in the cuneus, fusiform/parahippocampal gyri, and cerebellum of the right hemisphere, while it was increased in the inferior occipital gyrus of the left hemisphere.
Perfusion changes in SW were significantly correlated with depression and insomnia severity.
The onset and duration irregularity of sleep among SW were related to insomnia, mood, hyper- activity/restlessness, and quality of life.
Conclusions SW experience considerably more insomnia and mood disturbances than do DW, and this is significantly related to perfusion changes in multiple brain areas.
Key Words shift work, perfusion magnetic resonance imaging, sleep, insomnia, mood.
Altered Regional Cerebral Blood Flow Associated with Mood and Sleep in Shift Workers:
Cerebral Perfusion Magnetic Resonance Imaging Study
INTRODUCTION
Shift work disrupts the physiological circadian rhythms and acutely deteriorates sleep and other biological functions, which in turn alters both physical and psychological well-be- ing.1 Chronic shift work can increase the risks of cognitive impairment and depression.2 The circadian system not only governs the sleep-wake cycle but also regulates cognition and affective behavior via multiple mechanisms, including noradrenergic innervation of the cortex, clock-gene expression, dendritic spine density, and serotonin transport.3 It is therefore expected that circadian dysfunction results in multiple neuroanatomical, neuro- physiological, molecular and neurochemical disruptions during shift work. Circadian- rhythm-disrupted mice show a loss of dendritic length, decreased complexity of neurons Yun Kyung Parka*
Jae-Hun Kimb*, Su Jung Choic,d Sung Tae Kimb, Eun Yeon Jood,e
a Department of Neurology, Bundang Jesaeng General Hospital, Seongnam, Korea
b Department Radiology, Samsung Medical Center, Sungkyunkwan University School of Medicine, Seoul, Korea
c Department of Nursing, Samsung Medical Center,
Department of Clinical Nursing Science, Graduate School of
Clinical Nursing Science,
Sungkyunkwan University, Seoul, Korea
d Department of Neurology, Neuroscience Center,
Samsung Biomedical Research Institute, Samsung Medical Center,
Sungkyunkwan University School of Medicine, Seoul, Korea
e Department of Health Sciences and Technology, Samsung Advanced Institute for Health Sciences & Technology, Sungkyunkwan University, Seoul, Korea
pISSN 1738-6586 / eISSN 2005-5013 / J Clin Neurol 2019;15(4):438-447 / https://doi.org/10.3988/jcn.2019.15.4.438
Received August 13, 2018 Revised March 25, 2019 Accepted March 28, 2019 Correspondence Eun Yeon Joo, MD, PhD Department of Neurology, Neuroscience Center,
Samsung Biomedical Research Institute, Samsung Medical Center,
Sungkyunkwan University School of Medicine, 81 Irwon-ro, Gangnam-gu, Seoul 06351, Korea Tel +82-2-3410-3597
Fax +82-2-3410-0052 E-mail ejoo@skku.edu Sung Tae Kim, MD, PhD Department of Radiology, Samsung Medical Center, Sungkyunkwan University School of Medicine, 81 Irwon-ro, Gangnam-gu, Seoul 06351, Korea Tel +82-2-3410-6458
Fax +82-2-3410-0049 E-mail st7.kim@samsung.com
*These authors contributed equally to this work.
cc This is an Open Access article distributed under the terms of the Creative Commons Attribution Non-Com- mercial License (https://creativecommons.org/licenses/by-nc/4.0) which permits unrestricted non-commercial use, distribution, and reproduction in any medium, provided the original work is properly cited.
JCN
Open Access ORIGINAL ARTICLEPark YK et al.
JCN
in the prelimbic prefrontal cortex, and reduced cognitive flex- ibility or emotional changes consistent with the changes seen in neural architecture.4 The localized brain damage found in that study suggest that certain areas of the brain are selectively vulnerable to circadian-rhythm disruption and that these re- gions are responsible for the symptoms seen in shift-work dis- orders.
Despite experimental evidence that disrupted circadian rhythms can induce nerve damage and cognitive/affective system changes, which suggest alterations of the central ner- vous system in certain brain regions, there have been few neuroimaging studies of shift-work disorders. The first struc- tural MRI study performed in shift workers (SW) showed a reduced volume of the pontomesencephalic tegmentum and related poor sleep quality compared to day workers (DW).5 That preliminary study suggested a chronic disruption of cir- cadian rhythms or decreased exposure to bright light in SW.
However, it had limitations in that the participants had been performing shift work for less than 2 years, and that the de- pression and sleepiness observed in SW were not explained by regional volume changes of the brainstem.
Functional neuroimaging studies are useful for the early detection of metabolic and hemodynamic dysfunction com- pared to structural MRI.6 Perfusion MRI (pMRI) can be used to estimate various hemodynamic parameters such as the ce- rebral blood volume (CBV), cerebral blood flow (CBF), and mean transit time (MTT). pMRI has been applied to inves- tigate pathomechanisms of acute sleep restriction7 and ob- structive sleep apnea syndrome.8 Those studies showed that regional CBF (rCBF) changes were associated with the rele- vant symptoms, even without accompanying changes in the gray-matter volume.7,8 Arterial spin labeling (ASL) is the most recent noninvasive pMRI technology, but it may require a longer imaging time, underestimate CBF changes, and a show poor signal-to-noise ratio.9 The dynamic susceptibility con- trast (DSC) technique utilizes exogenous contrast to measure regional blood flow, but it has low sensitivity and spatial res- olution.10
To the best of our knowledge, no previous study has inves- tigated brain perfusion in SW. Our hypothesis was that chronic disruption of the sleep-wake pattern by shift work causes lo- calized neuronal damage and associated changes in regional cerebral perfusion. Observations of the regional blood flow alteration might be more sensitive than measuring changes in the gray-matter volume in brain sites earlier in the condition.
The aims of this study were to identify differences in sleep duration and quality between SW and DW and also rCBF changes between them using DSC MRI, while considering their sleep-wake schedules, cognitive function, and mood scores.
METHODS
Participants
Fifteen permanent day-fixed nurses (working during 08:00–
17:00) and 15 fast-rotating 3-shift nurses (performing day work during 07:00–15:30, evening work during 15:00–23:30, and night work during 23:00–07:30) were recruited from a met- ropolitan hospital. Inclusion criteria were 1) aged 25–65 years, 2) duration of current work of ≥2 years, 3) no psychiatric or serious medical problem, 4) not pregnant or planning preg- nancy, and 5) no definite obstructive sleep apnea syndrome [apnea-hypopnea index <5/h, as determined in a home sleep study using the Embletta MPR device (Natus Medical, Pleasan- ton, CA, USA)]. All participants gave written informed con- sent, and the study protocol was approved by the Ethics Com- mittee of Samsung Medical Center (IRB No. 2014-12-004).
Procedure and questionnaires
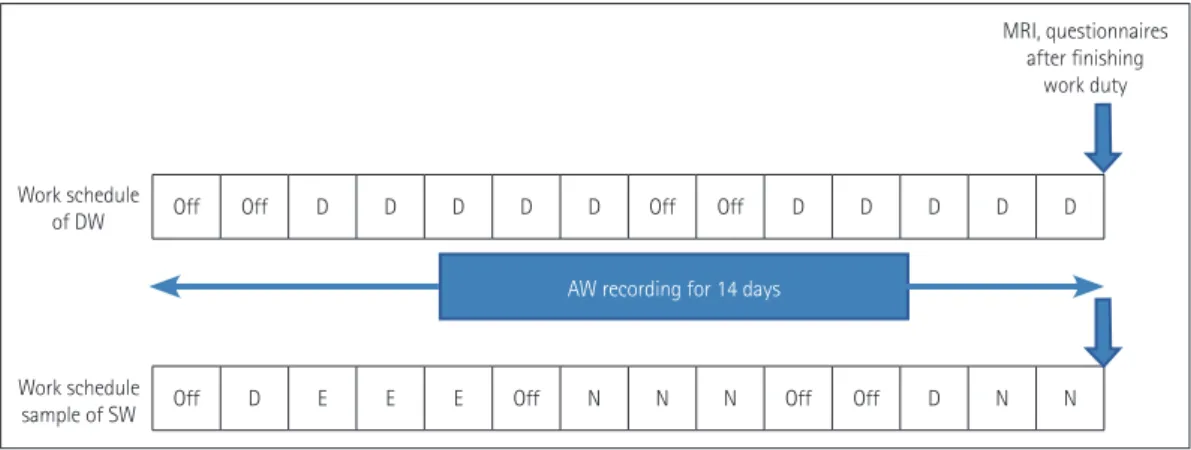
Each subject wore an actigraph and completed a sleep- and work-schedule diary for 2 weeks. The Joggle test and MRI scanning were conducted on the 14th day after finishing work on that day (Fig. 1).
Considering diurnal fluctuations of the brain at rest over the course of a single day and the different effects of fatigue from workload according to shifts, MRI scanning was per- formed on the day following two consecutive night shifts in SW and at the same time in DW.
The following self-reported questionnaires were applied:
Epworth Sleepiness Scale, with a score ≥11 indicating clini- cally significant daytime sleepiness11; Horne-Östberg Morn- ing-Eveningness Questionnaire12; Insomnia Severity Index (ISI), with >14 indicating clinical insomnia)13; World Health Organization Quality of Life Scale Abbreviated Version (WHOQOL-BREF)14 and Hospital Anxiety and Depression Scale (HADS), with scores ≥8 being clinically significant15; and the Korean version of Conners’ Adult Attention Deficit Hyperactivity Disorder Rating Scales (CAARS-K) for mea- suring inattention/memory problems, hyperactivity/rest- lessness, impulsivity/emotional lability, and problems with self-concept.16
Actigraphy
Participants were instructed to continuously wear an Acti- watch Spectrum device (Respironics, Murrysville, PA, USA) on the nondominant wrist. This device can detect accelera- tions down to 0.025 g with a bandwidth between 0.35 Hz and 7.5 Hz and a sampling frequency of 32 Hz. Wrist activity data were analyzed using Actiware (version 5.70; Philips Res- pironics, Murrysville, PA, USA) sleep software, with the fol- lowing sleep parameters derived: total sleep time (TST), sleep
Perfusion Brain MRI Study in Shift Workers
JCN
onset latency (SL), wakefulness after sleep onset (WASO), and sleep efficiency (SE). Variations in the sleep onset time and duration as recorded by the actigraph are regarded as in- dicators of irregular sleep patterns.17 The irregularity in the sleep onset time was assessed by measuring the standard deviation from the daily sleep onset time and converting this into the accumulated minutes from 0 h on the 24-h system.
Joggle test
Cognitive testing was conducted using automated psycho- metric measures that are commercially available from Jog- gle Research (https://admin.joggleresearch.com). The se- lected battery of tests was as follows: motor praxis task for measuring sensorimotor speed, visual object learning task for visual learning and spatial working memory, fractal two- back test for working memory, abstract matching task for abstraction, line orientation task for spatial orientation, digit symbol substitution task for complex scanning and visual tracking, balloon analog risk task for risk decision-making, and the psychomotor vigilance test for vigilant attention.18 Perfusion MRI
DSC MRI
All MRI images were acquired using a 3.0-T MRI scanner (Intera Achieva 3T, Philips Medical Systems, Best, the Neth- erlands) with an eight-channel sensitivity-encoding head coil. High-spatial-resolution axial T2*-weighted echo planar images were acquired using the following sequence parame- ters: repetition time (TR)=1,720 ms, echo time (TE)=35 ms, field of view (FOV)=240×240 mm, matrix=256×256, slic- es=50, slice thickness=5.0 mm, gap=1.5 mm, number of dynamic scans=50, and temporal resolution=1.8 s. Baseline images were acquired for 10 dynamic scans, followed by the
automatic injection of gadolinium-based contrast agent (0.1 mmoL/kg; Gadovist, Bayer HealthCare Pharmaceuticals, Berlin, Germany) at a rate of 3 mL/s through an 18G intrave- nous catheter, followed by a 40-mL normal saline flush with additional data acquisition. High-spatial-resolution sagittal T1-weighted images were acquired using the following scan parameters before injecting the contrast agent: TR=10 ms, TE=4.6 ms, FOV=240×240 mm, matrix=480×480, slices=
360, slice thickness=0.5 mm.
Quantification of DSC MRI
The flowchart for the quantification of DSC-MRI data is shown in Fig. 2. The MRI signals did not exhibit a linear re- lationship with the concentration of the contrast agent, and thus the curves of the MRI signal versus time were converted into curves of contrast-agent concentration versus time. The concentration of contrast agent in a given tissue voxel was estimated as Ct(t)=-log( S(t)S0 )
TE , where Ct(t) is the concen tration of contrast agent, S(t) is the signal intensity at time t, and S0 is the baseline signal intensity (Fig. 2A and B). For quantification of DSC-MRI data, the concentration of con- trast agent in tissue [Ct(t)] can be written as Ct(t)=CBF∫0t Cp
(t)R(t–τ)dτ=Cp(t)[CBF×R(t)], where Cp(t) is the concen- tration of contrast agent in a large vessel. In model-indepen- dent techniques, CBF×R(t) can be estimated using a decon- volution method. CBF×R(t) was computed using singular value decomposition (SVD) with block circulant matrices.19 SVD was implemented using the svd function in MATLAB (The Mathworks, Natick, MA, USA). The threshold for the diagonal matrix generated using SVD was set to 0.15 of the maximum eigenvalue in order to reduce oscillations of the derived tissue residue function R(t).20 The arterial input func-
Work schedule of DW
MRI, questionnaires after finishing
work duty
AW recording for 14 days
Work schedule sample of SW
Off Off D D D D D Off Off D D D D D
Off D E E E Off N N N Off Off D N N
Fig. 1. Diagrammatic representation of work schedule and timeline. The work schedule of DW was constant while that of SW involved rotational three shifts. Participants wore an actigraph for 2 weeks and underwent MRI scanning immediately after working. In the case of SW, MRI scanning was performed on the day after two consecutive night shifts. AW: awakening, D: day work, DW: day workers, E: evening work, N: night work, SW:
shift workers.
Park YK et al.
JCN
tion [Cp(t)] was manually measured by visually inspecting the concentration–time curves near the M1 segment of the middle cerebral artery (Fig. 2C). rCBF was computed as the maximum of the deconvolved tissue impulse response (CBF×
R(t) at t=0) using the property R(0)=1, and the regional CBV was calculated as the ratio of the area under the con- centration of contrast agent in a given voxel to the area under the curve of the contrast-agent concentration versus time of the arterial input function (Fig. 2D). MTT corresponded to the ratio of CBV to CBF. To obtain the absolute values of CBF and CBV, their regional values were scaled by assuming a normal white-matter CBF of 22 mL/100 g/min and a CBV of 2 mL/100 g.19 For spatial registration, the DSC-MRI im- age before injecting contrast agent was registered to the T1- weighted image using the affine transformation (from DSC space to T1 space), and then the T1-weighted image was reg- istered to the Montreal Neurological Institute (MNI) space (the MNI152 template in AFNI software) using the affine transformation (from T1 space to MNI space) for each sub-
ject. The affine transformation from DSC space to MNI space was calculated using both the affine transformation matrices from DSC space to T1 space and from T1 space to MNI space.
Using the obtained affine transformation from DSC space to MNI space, the computed parametric maps were regis- tered to MNI space for group analysis. We performed a voxel- by-voxel comparison of perfusion maps between two groups (3dttest++ function in AFNI), and the statistically signifi- cant regions were selected for the further analysis of the correlations of clinical scores.
Statistical analysis
Statistical analyses were performed with SPSS software (ver- sion 18.0, SPSS Inc., Chicago, IL, USA). A p value of less than 0.05 was considered to indicate statistical significance. All continuous variables were analyzed using the independent t- test or Mann-Whitney U test, and categorical variables were analyzed using Pearson’s chi-square tests. Spearman partial correlations between sleep irregularity and the questionnaire Fig. 2. Flowchart for quantifying the DSC-MRI data. A: DSC-MRI data. B: Concentration of contrast agent. DSC-MRI data were converted into the concentration of contrast agent. C: Concentration–time curves in a large vessel (red box in B) and tissue. The arterial input function was manually determined in large voxels. D: The tissue impulse response function [R(t)] multiplied by the CBF was computed using deconvolution. The regional CBF was computed as the maximum of the deconvolved tissue impulse response, the regional CBV was computed as the ratio of the AUC in a tis- sue to the AUC of the arterial input function, and the MTT was computed as the ratio of CBV to CBF. E: Observed Ct(t) (blue dots) and fitted curve using the estimated tissue impulse response function and CBF (red line). AUC: area under the curve, CBF: cerebral blood flow, CBV: cerebral blood volume, Cp: concentration of contrast agent in a large vessel, Ct: concentration of contrast agent in tissue, DSC: dynamic susceptibility contrast, MTT: mean transit time, TR: repetition time.
70 60 50 40 30 20 10 0 -10
Concentration
0 10 20 30 40 50 Time (TR)
Cp Ct
10
8
6
4
2
0
-2 Fp×R(t)
0 10 20 30 40 50 Time (TR)
CBF
CBV=
MTT=CBV/CBF
AUC (Ct) AUC (Cp)
40 35 30 25 20 15 10 5 0 -5
Concentration
0 10 20 30 40 50 Time (TR)
A
C
B
D E
Fitted Ct Observed Ct
Perfusion Brain MRI Study in Shift Workers
JCN
variables in each group were assessed after adjusting for age and the number of years performing the current work. A two- sample t-test was performed to detect significant differences in the mean kurtosis of rCBF between groups. The statistical threshold was set at p<0.001, with a spatial-extent threshold of a cluster size of 50 mm3 (about eight voxels in the original space). For each statistically significant cluster, the averaged values across voxels within each cluster were used in the cor- relation analysis.
RESULTS
Demographic and clinical characteristics
The demographic characteristics and the findings from the self-reported questionnaires are summarized in Table 1. SW reported a much higher level of insomnia than did DW, with 40% of the SW suffering from clinically significant insomnia.
The depression and anxiety levels were also significantly higher in SW, with 80% of them showing a clinically signifi- cant depressive mood. In terms of psychometric measures, hyperactivity and restlessness scores were also higher in SW.
No significant differences between SW and DW were found in most of the cognitive functions measured by the Joggle test (Supplementary Table 1 in the online-only Data Supple- ment).
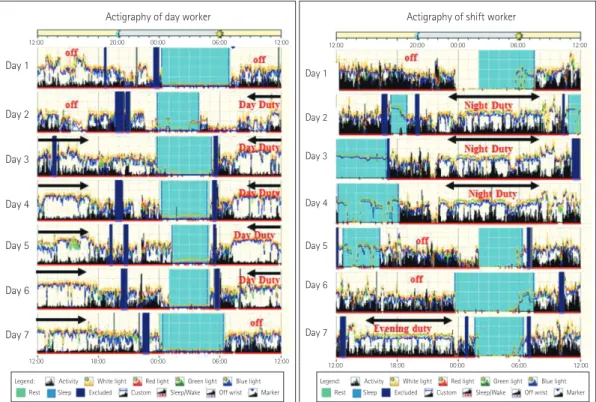
Actigraph-derived sleep parameters
The sleep-wake patterns differed between SW and DW ac- cording to their work schedule (Fig. 3). The sleep parameters (TST, SL, WASO, and SE) did not differ between the groups for 2 weeks prior to and on the day before pMRI scanning (Table 2).
SW showed a significantly irregular sleep duration [variabil- ity in daily sleep duration: 2.07±0.40 vs. 1.37±0.50 h (mean±s
Table 1. Demographic and clinical characteristics
Characteristic DW SW p
Age, years 36.0±2.7 34.58±3.10 0.137
Education, years 16 (16–16) 16 (16–18) 0.838†
BMI, kg/m2 20.52±1.90 21.02±2.60 0.683
Years performing current work 6.77±4.20 8.05±4.70 0.325
Alcohol consumption, g/week 33.0±43.7 7.3±9.6 0.035*
Caffeine consumption, g/day 116.0±53.6 128.5±80.1 0.870
Questionnaires
MEQ total score 51.73±6.50 49.0±9.6 0.369
ISI 4.60±3.20 12.53±5.10 <0.001*
Significant insomnia (ISI >14) 0 (0) 6 (40.0)
ESS score 9.53±3.20 11.20±4.30 0.305
Significant sleepiness (score ≥11) 5 (33.3) 8 (53.3)
HADS anxiety score 4.53±2.70 7.40±3.30 0.029*
Significant anxiety (score ≥8) 3 (20.0) 4 (26.7)
HADS depression score 4.93±3.90 9.33±3.00 0.001*
Significant depression (score ≥8) 4 (26.7) 12 (80.0)
CAARS-K score
Inattention/memory problem 21.73±6.40 24.20±4.30 0.106
Hyperactivity/restless 18.82±4.10 22.80±4.70 0.029*
Impulsivity/emotional lability 18.27±7.00 23.00±6.20 0.074
Problems with self-concept 11.53±3.00 12.47±2.30 0.389
WHOQOL-BREF score
Physical domain 14.60±4.50 12.93±3.80 0.098
Psychological domain 14.20±2.50 12.60±2.20 0.067
Social domain 14.47±2.20 13.33±2.40 0.126
Environmental domain 14.87±3.10 13.27±2.10 0.074
Data are mean±standard-deviation, median (interquartile range), or n (%) values.
*p<0.05, t-test, †Mann-Whitney U test.
BMI: body mass index, CAARS-K: Korean version of Conners’ Adult Attention Deficit Hyperactivity Disorder Rating Scales, DW: day workers, ESS: Ep- worth Sleepiness Scale, HADS: Hospital Anxiety and Depression Scale, ISI: Insomnia Severity Index, MEQ: Horne-Östberg Morning-Eveningness Ques- tionnaire, SW: shift workers, WHOQOL-BREF: World Health Organization Quality of Life Scale Abbreviated Version.
Park YK et al.
JCN
tandard deviation), p<0.001] and sleep onset time (variability in daily sleep onset time: 4.5±0.7 vs. 1.36±0.70 h, p<0.001) compared to DW (Table 2).
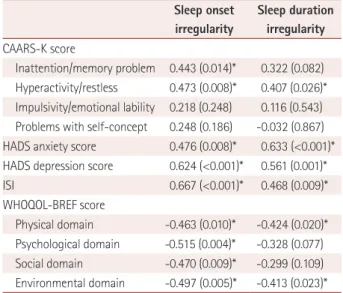
The sleep irregularity of SW was positively correlated with scores for hyperactivity and restlessness in the psychomet-
ric test, insomnia, and HADS. The WHOQOL-BREF score was negatively correlated with sleep duration and onset ir- regularity. Sleep onset irregularity was positively correlated with inattention and memory problems in the psychometric test (Table 3).
Fig. 3. Plots of actigraphy data. Light blue boxes indicate sleeping periods, dark blue boxes indicate where actigraphy recording was started, and arrows indicate working periods.
Table 2. Actigraph-derived sleep parameters
DW (n=15) SW (n=15) p
At a mean of 2 weeks prior to pMRI scanning 372.40±55.60 365.67±40.80 0.653
Sleep duration, min
SE, % 85.04±4.40 84.08±4.10 0.539
SL, min 8.00±4.70 11.17±5.90 0.089
WASO, min 46.34±20.50 41.22±14.40 0.683
WASO, % 12.73±5.70 11.41±4.20 0.567
Sleep irregularity
Duration, h 1.37±0.50 2.07±0.40 <0.001*
Onset, h 1.36±0.70 4.50±0.70 <0.001*
The day before pMRI scanning
Sleep duration, min 361.20±70.60 380.53±158.30 0.744
SE, % 84.90±7.80 87.87±6.30 0.345
SL, min 4.40±7.00 9.33±13.50 0.345
WASO, min 50.80±30.80 36.93±23.20 0.325
WASO, % 14.17±9.00 9.43±5.40 0.202
Number of arousals 15.47±7.60 12.53±7.80 0.325
Data are mean±standard-deviation values.
*p<0.05, t-test.
DW: day workers, pMRI: perfusion MRI, SE: sleep efficiency, SL: sleep onset latency, SW: shift workers, WASO: wakefulness after sleep onset.
Day 1
Day 2 Day 3
Day 4
Day 5 Day 6
Day 7
12:00 20:00 00:00 06:00 12:00 12:00 20:00 00:00 06:00 12:00
12:00 18:00 00:00 06:00 12:00
12:00 18:00 00:00 06:00 12:00 Legend: Activity White light Red light Green light Blue light
Rest Sleep Excluded Custom Sleep/Wake Off wrist Marker
Day 1
Day 2
Day 3
Day 4
Day 5
Day 6
Day 7
Actigraphy of day worker Actigraphy of shift worker
Legend: Activity White light Red light Green light Blue light Rest Sleep Excluded Custom Sleep/Wake Off wrist Marker
Perfusion Brain MRI Study in Shift Workers
JCN
pMRI findings
rCBF in the cuneus, fusiform/parahippocampal gyri, and cerebellum in the right hemisphere was significantly lower in SW than in DW, while that in the left inferior occipital gyrus was increased in SW (Fig. 4, Table 4).
rCBF in the right fusiform gyrus cluster was negatively correlated with the HADS depression score (r=-0.496, p<0.01) and ISI (r=-0.498, p<0.01). rCBF in the right cerebellum showed a negative correlation with the HADS depression score (r=-0.466, p<0.01), while rCBF in the left inferior oc- cipital gyrus showed a positive correlation with the HADS depression score (r=0.472, p<0.01). The CAARS-K score and actigraph-derived sleep parameters were not correlated with rCBF alterations.
DISCUSSION
The SW in this study were more depressed and anxious as well as more hyperactive and restless than the DW. pMRI showed that rCBF of SW was considerably altered in temporo-oc- cipital and cerebellar areas compared to DW, and those ar- eas were significantly correlated with depression and insom- Table 3. Sleep irregularity and its relationships with clinical factors
Sleep onset irregularity
Sleep duration irregularity CAARS-K score
Inattention/memory problem 0.443 (0.014)* 0.322 (0.082) Hyperactivity/restless 0.473 (0.008)* 0.407 (0.026)*
Impulsivity/emotional lability 0.218 (0.248) 0.116 (0.543) Problems with self-concept 0.248 (0.186) -0.032 (0.867) HADS anxiety score 0.476 (0.008)* 0.633 (<0.001)*
HADS depression score 0.624 (<0.001)* 0.561 (0.001)*
ISI 0.667 (<0.001)* 0.468 (0.009)*
WHOQOL-BREF score
Physical domain -0.463 (0.010)* -0.424 (0.020)*
Psychological domain -0.515 (0.004)* -0.328 (0.077) Social domain -0.470 (0.009)* -0.299 (0.109) Environmental domain -0.497 (0.005)* -0.413 (0.023)*
Data are r (p) values.
*p<0.05.
CAARS-K: Korean version of Conners’ Adult Attention Deficit Hyperac- tivity Disorder Rating Scales, HADS: Hospital Anxiety and Depression Scale, ISI: Insomnia Severity Index, r: spearman partial correlation co- efficient, WHOQOL-BREF: World Health Organization Quality of Life Scale Abbreviated Version.
A B C D
Fig. 4. Comparison of regional perfusion MRI data between SW and DW. Left inferior occipital gyrus (A), right cerebellum (B), right fusiform/para- hippocampal gyri (C), and right cuneus (D). Red color indicates areas with lower CBF in SW compared to DW, and blue color indicates areas with higher CBF. Statistical images are displayed with a cluster probability threshold of p<0.05, corrected for multiple comparisons. CBF: cerebral blood flow, DW: day workers, SW: shift workers.
Park YK et al.
JCN
nia severity. rCBF was significantly decreased in the right fusiform gyrus, cuneus, and cerebellum, while the perfusion was somewhat increased in the left inferior occipital area.
rCBF in the right fusiform gyrus and cerebellum was nega- tively correlated with depression severity, while it was posi- tively correlated with the perfusion in the left inferior occipital lobe. Patients with depression show structural or functional derangement in visual regions such as the fusiform/lingual gyri and middle occipital cortex,21,22 and derangement of the fusiform gyrus in memory processing is responsible for cog- nitive vulnerability and depression.23
Functional MRI studies have revealed that the cerebellum is involved in cognition and emotion in addition to motor control.24-26 Our findings are in line with previous research showing that emotional memory and the severity of depres- sive symptoms are associated with structural changes in an- terior gray-matter regions of the cerebellum in patients with depression.26
A particularly interesting finding of the present study was the increased rCBF in the left inferior occipital gyrus in SW and the perfusion in this region being positively correlated with depression scores. A previous ASL MRI study in pa- tients with depression found increased perfusion in the tem- poro-occipital area.27 Another paper reported that hyperac- tivity in that area might be associated with experiencing sad events or the recognition of unpleasant stimuli.28 The causal relationship between perfusion change and mood disturbance in SW is not clear. All of the present participants denied any mood problems before starting work. Together with find- ings from previous studies, the present results suggest that perfusion changes in the temporo-occipito-cerebellar regions are associated with the occurrence of mood disturbances in SW.rCBF in the right fusiform gyrus of SW was negatively cor- related with insomnia severity. Previous functional neuro- imaging studies have produced mixed findings. The fusiform gyrus is frequently affected in insomnia, exhibiting both in- creased and decreased activity.29,30 One study found that the activity was dependent on the sleep-wake state, with the ac-
tivity of the fusiform area being increased during sleep but decreased while awake.31 The fusiform gyrus is involved in multimodal combined and facial identification and has been linked to depression.32 These findings together with previous ones may indicate that dysfunction in the region contributes to affective difficulties with insomnia in SW.
The SW in this study exhibited irregular sleep onset and sleep duration, with these symptoms being significantly re- lated to a higher level of depression and insomnia as well as a lower quality of life. Variations in the sleep onset time as recorded by the actigraph was used as an indicator of irreg- ular sleep patterns, and the standard deviation of sleep onset for each participant was regarded as an index of irregularity of the sleep-wake pattern.33 The sleep irregularity of SW was highly significant for the onset time (4.5 h in SW vs. 1.36 h in DW), which may indicate that keeping a regular sleep- wake pattern is essential to prevent sleep and psychological health problems.
This study had several strengths that should be consid- ered. The experience of shift work was long enough (4–12 years) to reflect the characteristics of SW. Most prior stud- ies have relied on self-reported questionnaires to assess the sleep behaviors of SW, whereas we used actigraphy to obtain objective information about sleep and behavior patterns and extensively investigated mood, psychometric features, and cognitive performance. Polysomnography was not conduct- ed in this study because the different sleep schedules of SW may lead to different sleep structures or arousal indices ac- cording to particular shifts. Instead, participants were eval- uated using home sleep tests, which revealed no evidence of sleep-disordered breathing in any of them. To the best of our knowledge, there has been no previous cerebral perfusion study using DSC-MRI data in SW. Our analysis of DSC-MRI data revealed specific brain regions showing alteration of cerebral perfusion in SW compared to DW, and these brain regions showed significant correlations with depressive mood.
Several limitations of this study should be addressed. The participants were all females in their mid-30 s, and their cog- nitive changes induced by circadian disruption may differ Table 4. Clusters of brain regions showing cerebral perfusion changes
Brain region Cluster (mm3) Peak t MNI coordinates (mm)
X Y Z
Decreased rCBF (SW<DW)
Right cuneus 87 4.84 9 -83 26
Right fusiform gyrus and right parahippocampal gyri 130 4.23 30 -59 -6
Right cerebellum 218 4.66 14 -51 -1
Increased rCBF (SW>DW)
Left inferior occipital gyrus 286 -4.87 -23 -92 -15
DW: day workers, MNI: Montreal Neurological Institute, rCBF: regional cerebral blood flow, SW: shift workers.
Perfusion Brain MRI Study in Shift Workers
JCN
from those in males.34 The Joggle test in SW indicated that their cognitive function was not disturbed, which is probably related to a lower level of difficulty in test items considering the high innate capacities of younger participants. Perfusion differences between SW and DW might have been attenu- ated by the relative youngness of the participants and the smallness of the sample. In this study, DW consumed more alcohol than SW. Chronic alcohol consumption exceeding 15 drinks/week is known to reduce the global CBF.35 Although the present DW consumed significantly less alcohol than those in the previous study, it is still possible that the CBF was reduced due to alcohol consumption, which would have un- derestimated the CBF difference between the two groups. The present MRI studies were conducted on the day following two consecutive night shifts in SW and at the same time in DW, and the schedules of the SW might have differed before their night shifts. Also, the time of day is important when interpreting functional connectivity or rCBF, and circadian and homeostatic influences are important when understand- ing the results of resting-state data. However, in shift-work studies, the effects of fatigue and workload according to dif- ferent shifts might overwhelm the time-of-day effects. A pre- vious investigation found a significant correlation between rCBF and the cortisol level in the morning in the anterior cingulate cortex.36 In the present study, the regional perfu- sion in the anterior cingulate cortex did not differ between SW and DW. This might reduce the need to consider the time of day, but the different MRI study times impair the ability to interpret our results. There could be potential errors in computer perfusion parameters due to susceptibility artifacts of DSC-MRI data, registration errors using an affine trans- formation, and image distortion due to the phase-encoding polarity.
This study has shown that disrupted circadian rhythm is associated with multiregional cerebral dysfunction; however, the underlying mechanisms remain unknown and so require further investigation.
In summary, we found that female SW were more depressed, anxious, and hyperactive-restlessness than DW, and that the severity of these features was significantly correlated with the irregularity of sleep. Mood and insomnia symptoms were substantially correlated with perfusion changes in SW. This study suggests that SW have altered functional changes in their brains that may partly explain the impact of desynchro- nization of the circadian rhythm on the development of af- fective disorder in SW.
Supplementary Materials
The online-only Data Supplement is available with this arti- cle at https://doi.org/10.3988/jcn.2019.15.4.438.
Author Contributions
Conceptualization: Jae-Hun Kim, Eun Yeon Joo. Data curation: Yun Kyung Park, Jae-Hun Kim, Su Jung Choi, Eun Yeon Joo. Formal analysis: Yun Kyung Park, Jae-Hun Kim. Funding acquisition: Jae-Hun Kim, Eun Yeon Joo. Investigation: Yun Kyung Park, Jae-Hun Kim, Eun Yeon Joo. Method- ology: Yun Kyung Park, Eun Yeon Joo, Jae-Hun Kim, Sung Tae Kim. Proj- ect administration: Eun Yeon Joo, Sung Tae Kim. Resources: Eun Yeon Joo.
Supervision: Eun Yeon Joo, Sung Tae Kim. Validation: Su Jung Choi. Visu- alization: Jae-Hun Kim, Sung Tae Kim. Writing—original draft: Yun Kyung Park, Jae-Hun Kim. Writing—review & editing: Eun Yeon Joo, Sung Tae Kim.
ORCID iDs
Yun Kyung Park https://orcid.org/0000-0002-0725-1633 Jae-Hun Kim https://orcid.org/0000-0003-3064-6948 Su Jung Choi https://orcid.org/0000-0003-2171-7441 Sung Tae Kim https://orcid.org/0000-0001-8185-0063 Eun Yeon Joo https://orcid.org/0000-0003-1233-959X Conflicts of Interest
The authors have no potential conflicts of interest to disclose.
Acknowledgements
This research was supported by Basic Science Research Program through the National Research Foundation of Korea funded by the Ministry of Sci- ence, ICT & Future Planning, Republic of Korea (2017R1A2B4003120), by a grant of the Korea Health Technology R&D Project through the Ko- rea Health Industry Development Institute (KHIDI), funded by the Min- istry of Health & Welfare, Republic of Korea (HI18C1038) and by Sam- sung Biomedical Research Institute grant (OTC1190671).
REFERENCES
1. Vogel M, Braungardt T, Meyer W, Schneider W. The effects of shift work on physical and mental health. J Neural Transm (Vienna) 2012;
119:1121-1132.
2. Logan RW, McClung CA. Rhythms of life: circadian disruption and brain disorders across the lifespan. Nat Rev Neurosci 2019;20:49-65.
3. Benca R, Duncan MJ, Frank E, McClung C, Nelson RJ, Vicentic A.
Biological rhythms, higher brain function, and behavior: gaps, oppor- tunities, and challenges. Brain Res Rev 2009;62:57-70.
4. Karatsoreos IN, Bhagat S, Bloss EB, Morrison JH, McEwen BS. Dis- ruption of circadian clocks has ramifications for metabolism, brain, and behavior. Proc Natl Acad Sci U S A 2011;108:1657-1662.
5. Kim JB, Kim JH. Regional gray matter changes in shift workers: a vox- el-based morphometry study. Sleep Med 2017;30:185-188.
6. Debernard L, Melzer TR, Alla S, Eagle J, Van Stockum S, Graham C, et al. Deep grey matter MRI abnormalities and cognitive function in re- lapsing-remitting multiple sclerosis. Psychiatry Res 2015;234:352-361.
7. Poudel GR, Innes CR, Jones RD. Cerebral perfusion differences be- tween drowsy and nondrowsy individuals after acute sleep restriction.
Sleep 2012;35:1085-1096.
8. Innes CR, Kelly PT, Hlavac M, Melzer TR, Jones RD. Decreased re- gional cerebral perfusion in moderate-severe obstructive sleep apnoea during wakefulness. Sleep 2015;38:699-706.
9. Huang YC, Liu HL, Lee JD, Yang JT, Weng HH, Lee M, et al. Compari- son of arterial spin labeling and dynamic susceptibility contrast perfu- sion MRI in patients with acute stroke. PLoS One 2013;8:e69085.
10. Jahng GH, Li KL, Ostergaard L, Calamante F. Perfusion magnetic reso- nance imaging: a comprehensive update on principles and techniques.
Korean J Radiol 2014;15:554-577.
11. Johns MW. A new method for measuring daytime sleepiness: the Ep- worth sleepiness scale. Sleep 1991;14:540-545.
12. Horne JA, Ostberg O. A self-assessment questionnaire to determine
Park YK et al.
JCN
morningness-eveningness in human circadian rhythms. Int J Chrono- biol 1976;4:97-110.
13. Morin CM. Insomnia: Psychological assessment and management.
New York: Guilford Press, 1994.
14. World Health Organization. WHOQOL-BREF introduction, adminis- tration, scoring and generic version of the assessment. Field trial version.
Geneva: World Health Organization, 1996.
15. Zigmond AS, Snaith RP. The hospital anxiety and depression scale.
Acta Psychiatr Scand 1983;67:361-370.
16. Conners CK, Erhardt D, Sparrow E. Conners adult ADHD rating scales (CAARS). New York: Multi Health Systems, Inc., 1999.
17. Lee DH, Cho CH, Han C, Bok KN, Moon JH, Lee E, et al. Sleep irreg- ularity in the previous week influences the first-night effect in poly- somnographic studies. Psychiatry Investig 2016;13:203-209.
18. Warwick JM, Carey P, Jordaan GP, Dupont P, Stein DJ. Resting brain perfusion in social anxiety disorder: a voxel-wise whole brain compar- ison with healthy control subjects. Prog Neuropsychopharmacol Biol Psychiatry 2008;32:1251-1256.
19. Ostergaard L, Sorensen AG, Kwong KK, Weisskoff RM, Gyldensted C, Rosen BR. High resolution measurement of cerebral blood flow using intravascular tracer bolus passages. Part II: experimental comparison and preliminary results. Magn Reson Med 1996;36:726-736.
20. Zöllner FG, Weisser G, Reich M, Kaiser S, Schoenberg SO, Sourbron SP, et al. UMMPerfusion: an open source software tool towards quan- titative MRI perfusion analysis in clinical routine. J Digit Imaging 2013;
26:344-352.
21. Ma N, Li L, Shu N, Liu J, Gong G, He Z, et al. White matter abnor- malities in first-episode, treatment-naive young adults with major de- pressive disorder. Am J Psychiatry 2007;164:823-826.
22. Kroes MC, Rugg MD, Whalley MG, Brewin CR. Structural brain ab- normalities common to posttraumatic stress disorder and depression.
J Psychiatry Neurosci 2011;36:256-265.
23. Harvey PO, Pruessner J, Czechowska Y, Lepage M. Individual differ- ences in trait anhedonia: a structural and functional magnetic reso- nance imaging study in non-clinical subjects. Mol Psychiatry 2007;12:
703, 767-775.
24. Schmahmann JD. The role of the cerebellum in cognition and emo- tion: personal reflections since 1982 on the dysmetria of thought hy- pothesis, and its historical evolution from theory to therapy. Neuropsy- chol Rev 2010;20:236-260.
25. Stoodley CJ, Schmahmann JD. Evidence for topographic organization
in the cerebellum of motor control versus cognitive and affective pro- cessing. Cortex 2010;46:831-844.
26. Xu LY, Xu FC, Liu C, Ji YF, Wu JM, Wang Y, et al. Relationship between cerebellar structure and emotional memory in depression. Brain Behav 2017;7:e00738.
27. Lui S, Parkes LM, Huang X, Zou K, Chan RC, Yang H, et al. Depres- sive disorders: focally altered cerebral perfusion measured with arterial spin-labeling MR imaging. Radiology 2009;251:476-484.
28. Surguladze S, Brammer MJ, Keedwell P, Giampietro V, Young AW, Travis MJ, et al. A differential pattern of neural response toward sad versus happy facial expressions in major depressive disorder. Biol Psy- chiatry 2005;57:201-209.
29. Kay DB, Buysse DJ. Hyperarousal and beyond: new insights to the pathophysiology of insomnia disorder through functional neuroimag- ing studies. Brain Sci 2017;7:E23.
30. Huang X, Li SH, Zhou FQ, Zhang Y, Zhong YL, Cai FQ, et al. Altered intrinsic regional brain spontaneous activity in patients with comitant strabismus: a resting-state functional MRI study. Neuropsychiatr Dis Treat 2016;12:1303-1308.
31. Kay DB, Karim HT, Soehner AM, Hasler BP, Wilckens KA, James JA, et al. Sleep-wake differences in relative regional cerebral metabolic rate for glucose among patients with insomnia compared with good sleep- ers. Sleep 2016;39:1779-1794.
32. Wang Y, Zhong S, Jia Y, Zhou Z, Wang B, Pan J, et al. Interhemispher- ic resting state functional connectivity abnormalities in unipolar de- pression and bipolar depression. Bipolar Disord 2015;17:486-495.
33. Medeiros AL, Mendes DB, Lima PF, Araujo JF. The relationships be- tween sleep-wake cycle and academic performance in medical stu- dents. Biol Rhythm Res 2001;32:263-270.
34. Santhi N, Lazar AS, McCabe PJ, Lo JC, Groeger JA, Dijk DJ. Sex dif- ferences in the circadian regulation of sleep and waking cognition in humans. Proc Natl Acad Sci U S A 2016;113:E2730-E2739.
35. Christie IC, Price J, Edwards L, Muldoon M, Meltzer CC, Jennings JR.
Alcohol consumption and cerebral blood flow among older adults. Al- cohol 2008;42:269-275.
36. Hodkinson DJ, O’Daly O, Zunszain PA, Pariante CM, Lazurenko V, Zelaya FO, et al. Circadian and homeostatic modulation of functional connectivity and regional cerebral blood flow in humans under nor- mal entrained conditions. J Cereb Blood Flow Metab 2014;34:1493- 1499.