Vol. 23, No. 3, pp. 231-241, May 31, 2017, ISSN 1229-3431(Print) / ISSN 2287-3341(Online) https://doi.org/10.7837/kosomes.2017.23.3.231
*
1. Introduction
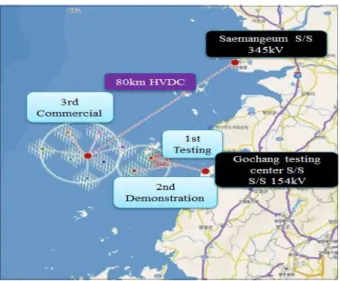
Recently, interest in new energy development has increased according to the growth of energy demand in the world. The main form of energy receiving attention is wind power. Offshore wind power is a valuable source of renewable energy that can help reduce carbon emissions. In 2010, the Korean government announced a road map to develop a southwest offshore wind farm (Yoo, 2010) in order to leap into position as the third leading country in terms of offshore wind power by 2020. The project includes development of 2.5 GW, dividing the process into three steps, testing, demonstration, and commercial function, as in Fig. 1.
The electricity produced by offshore wind power is expected to account for 10% of electric consumption for the total Korean population (Sung and Lee, 2013).
Offshore wind farms occupying a vast area affect the traffic flow of vessels and the operation of vessels engaged in fishing, potentially causing collision risks (MSG, 2014). Therefore, the development of offshore wind farms should be analyzed sufficiently not only in terms of how much wind power will be
* First Author : [email protected], 061-555-5496 Corresponding Author : [email protected], 061-240-7175
produced but also from the perspective of traffic investigation for vessels that must navigate the are, like fishing and leisure vessels.
Generally, traffic investigations for vessel navigation are conducted by collecting Automatic Identification System (AIS) data, which reflects the traffic volume of merchant vessels well but does not provide sufficient information on the traffic volume of fishing vessels, which often do not have AIS. In order to grasp the traffic flow of these fishing vessels, direct observation and radar data are often used, but for a vast area over 20 km from shore, like the southwest offshore wind farm, the use of observation and radar are limited in terms of time and expense, with additional challenges due to seasonality, which cannot be represented given only a short data collection period.
Yang (2014b) evaluated traffic safety for an offshore wind farm based on AIS data collected over 9 days, but the traffic of fishing vessels without AIS was not considered and monthly variation was not considered due to the limited observation time.
Meanwhile, Yoo et al. (2015) attempted to create a variation index by month and week for traffic volumes in accordance with relevant observation times for maritime traffic investigations. Kang et al. (2017) also confirmed that there was a difference in seasonal traffic volume. Particularly, the Marine and Coastguard Agency
A Study on Traffic Safety Assessments for Fishing Vessels Near the Southwest Sea Offshore Wind Farm
Sang-Lok Yoo
*Jae-Yong Jeong
*** Vessel Traffic Services, Ministry of Public Safety and Security, Korea
** Mokpo National Maritime University, Mokpo 58628, Korea
Abstract : The purpose of this study was to analyze traffic safety assessments for fishing vessels near the southwest offshore wind farm. This study applied a collision model for safety assessment. It also involved a spatiotemporal analysis of vessels engaged in fishing to identify fishing hotspots around the offshore wind farm. This study used data from fishing vessel location transmission devices gathered over 1 year in 2014. As a result, in September, when the average number of vessels engaged in fishing is high, 62 ships were operating in fishing section 184-6 and 55 ships in section 184-6. In addition, in fishing sections 184-8 and 192-2, where an offshore wind farm was located, there were 55 and 38 ships operating, respectively. As the recovery period for a seaway near wind farm turbines is 55 years, it was determined that safety measures are required in order to reduce collision frequency while allowing fishing vessels to navigate through offshore wind farms. Meanwhile, the return period of Seaway B between the groups of generators considered was 184 years. A safety zone for offshore wind farms should be installed covering a distance of at least 0.3 NM from the boundary of turbines. Then, the collision return period was derived to be close to 100 years. Through this traffic safety assessment, it has been concluded that such measures would help prevent marine accidents.
Key Words : Offshore wind farm, Fishing vessel, Traffic safety assessment, Collision return period, Safety zone
(MCA) in London mentioned that a traffic investigation should extend over 28 days and seasonal variation patterns should be taken into account since an appropriate traffic investigation cannot be conducted with only AIS data when evaluating the traffic safety of an offshore wind farm (MGN 275, 2005; MGN 543, 2016).
The purpose of this study was to analyze traffic safety assessments for fishing vessels near the southwest offshore wind farm. In this study, a monthly analysis was conducted, reflecting seasonal traffic flows for fishing vessels, which represent the main vessels navigating near the southwest offshore wind farm. Basic data is provided to help prevent marine accidents by improving traffic safety assessments for fishing vessels near the offshore wind farm.
Fig. 1. The road map of southwest sea offshore wind farm.
2. Methodology
This study used data from fishing vessel location transmission devices gathered over 1 year in 2014. Fig. 2 shows the flow of this study, which established a database by month. The progressive installation of fishing vessel location transmission devices has been promoted since 2011 in accordance with the Fishing Vessel Act.
By December 2016, devices had been installed on about 70,000 fishing boats in Korea, including small boats of less than 1 ton.
The first step was to analyze vessels engaged in fishing, determining their time and space attributes within the study area, as shown in Fig. 3. The study area included the green circle, which is used to present the location of the first step, testing, and the second step, demonstration. The detailed location was latitude 35.16°-35.83° and longitude 125.84°-126.5°between Anmado,
Youngkwang-gun, Jeollanam-do, and Wido Buan-gun, Jeollabuk-do.
In order to identify whether fishing vessels were operating or not based on maximum current speed, data was extracted with regards to speed. Data was assimilated on the supposition that a speed under 2 knots represented an operating fishing vessel. Under these conditions, it was possible to exclude moored or anchored fishing vessels inside of fishing harbors; fishing harbors were also excluded from the study area. For detailed analysis, we established intervals of 10×10 latitude and longitude to represent fishing ′ sectors. Grids were established and analyzed for a total of 16 fishing sectors, from 183-6 to 194-6.
The second step evaluated traffic safety for fishing vessels in accordance with the construction of an offshore wind farm. First, the database was filtered to consider only the offshore wind farm area. Next, the presence of all fishing vessels near the offshore wind farm was calculated. Lastly, the seaways were analyzed, applying a collision model.
Monthly database
Database at less than maximum current in study area
Analysis Speed under maximum current?
Yes Study area except fishing harbor?
Yes Yes
Database at all speeds in study area
End Start
Application to collision assessment model Calculating fishing boats in
wind farm area Wind farm area?
Database at all speeds in wind farm area
Analysis by fairway No
Fig. 2. Procedure of this study.
Fig. 3. Location of offshore wind power turbines and study area.
3. Current Situation
3.1 Fishing Harbor Type
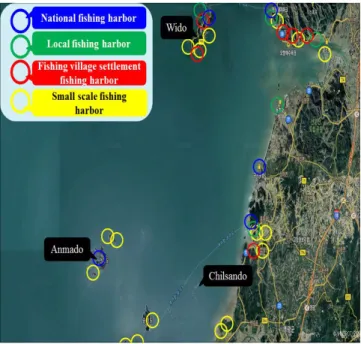
Table 1 shows the current situation by fishing harbor type, including national, local, fishing village settlement and small scale fishing harbors that are located in the study area. Fig. 4 shows the location of each fishing harbor. A national fishing harbor refers to a fishing harbor that has over 70 fishing vessels according to the enforcement regulations of the Fishing Village and Fishing Harbor Acts, and Gyeokpo, Gusipo and Gyema harbors were included in the study area. A local fishing harbor refers to a fishing harbor that has over 30 fishing vessels, with Sikdo and Gomso harbors included. A fishing village settlement refers to a harbor that is the living base of a fishing village, among which Beolgeum and Daeri harbors were included.
Fishing Harbor Type Name of Fishing Harbor National fishing harbor Gyeokpo, Gusipo, Gyema, Wido,
Anma
Local fishing harbor Sikdo, Gomso, Gunghang, Dongho, Beopseong
Fishing village settlement fishing harbor
Beolgeum, Daeri, Docheong, Mohang, Wangpo, Daesin
Small scale fishing harbor
Jilli, Georyun, Chido, Jukmang, Jakdang, Judo, Wolgog, Chilgok,
Gusu, Changwoo, Dangdu, Soseongman, Daeseongman, Hoengdo,
Songi, Daegagi, Sogagi Table 1. Categorization by fishing harbor type
Fig. 4. Location by fishing harbor type.
3.2 Number of Registered Fishing Vessels
Table 2 shows the number of registered fishing vessels in the study area by gross tonnage. The total number of registered fishing vessels was 812 ships in Yeonggwang-gun, and 1,132 ships in Buan-gun. It was found that around 95% of ships were fishing vessels under 10 tons.
Gross Tonnage Administrative district Yeonggwang-gun Buan-gun
Less than 1 ton 237 124
1-5 tons 414 893
5-10 tons 118 102
10-20 tons 30 10
20-30 tons 11 2
30-50 tons 1 1
50-100 tons 1 -
Total 812 1,132
Table 2. Number of registrated fishing vessels by gross tonnage type
Table 3 shows only six representative permitted fisheries.
Among the permitted fishing boats in Yeonggwang-gun, gill nets accounted for around 55% and composite fisheries held 22%. It was concluded that composite fisheries made up around 30% and gill nets 23% in Buan-gun.
Fishery Type Administrative District Yeonggwang-gun Buan-gun
Gill nets 443 258
Stow nets 17 39
Purse seines 2 18
Composite fisheries 180 339
Traps 23 15
Beam trawls - 59
Table 3. Number of permitted fishing vessels by fishery type
3.3 Chilsan Fishing Ground
As the study area had a low water depth and was rich in plankton, fishing grounds formed from April to October with gill nets or stow nets, providing catches of yellow corvina, blue crabs, shrimp, red tongue sole, butter fish and croakers. Specially, this area formed Chilsan fishing ground, where yellow corvina spawn from April to July every year, passing Heuksando fishing area, as in Fig. 5. This area was also home to pasi (a seasonal fish market) with trade between buyers and fishing vessels. In particular, Wido pasi was popular as the third most prominent market of yellow corvina with Heuksando and Yeonpyeongdo pasi. It was estimated that these areas have heavy traffic volume from fishing vessels (Na, 2008; Kim, 2009).
Fig. 5. Path of yellow corvina and location of Chilsan fishing ground.
3.4 Tidal Current
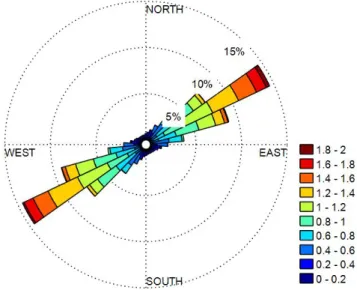
Fig. 6 shows the current rose plot for year 2014 at a central location between Anmado and Wido, using the numeric tidal current chart from the National Ocean Research Institute. The maximum flood current was found to come from the northeast (1.8-2.0 knots) and the maximum ebb current from the southwest (1.8-2.0 knots)
Fig. 6. Measured current rose at offshore wind power complex.
4. Analysis of a Vessel Engaged in Fishing
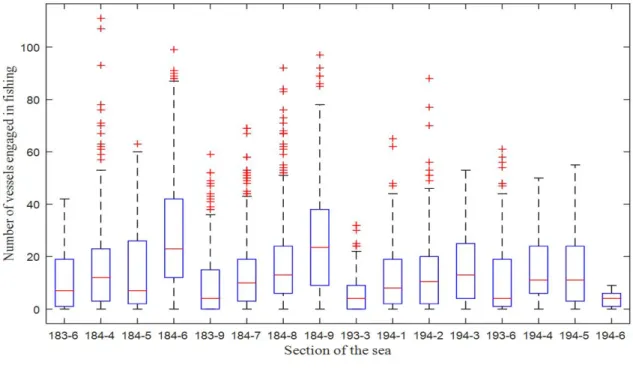
Fig. 7 shows a box plot with attributes of vessels engaged in fishing by fishing sector. Areas with high numbers of vessels engaged in fishing are in order: sectors 184-6, 184-9, 184-8 and 184-4. Sectors 184-6 and 184-9 had the greatest annual average number of vessels engaged in fishing. With values in the 25 quantile, median, and 75 quantile, these fishing sectors were higher than others. Also, the area with the greatest daily number of vessels engaged in fishing was sector 184-4, with 111 ships on the 3rd of July and 107 ships on the 17th of June. The next highest was sector 184-6 with 99 ships on the 3rd of July.
Fig. 8 indicates the top ten fishing sectors according to the average number of vessels engaged in fishing by month. In the study area, an increase in the number of vessels engaged in fishing in summer and fall was confirmed. Specifically, the number of vessels engaged in fishing in August and September was 13 times more than in January. Vessels engaged in fishing changed location due to the movement of the targeted fish populations according to water temperature, as indicated by a positive correlation. In
September a high average number of vessels were engaged in fishing, with 62 ships operating in sector 184-9, 55 ships in sector 184-6, and 50 and 38 ships operating in sectors 184-8 and 194-2 respectively, where an offshore wind farm is to be located.
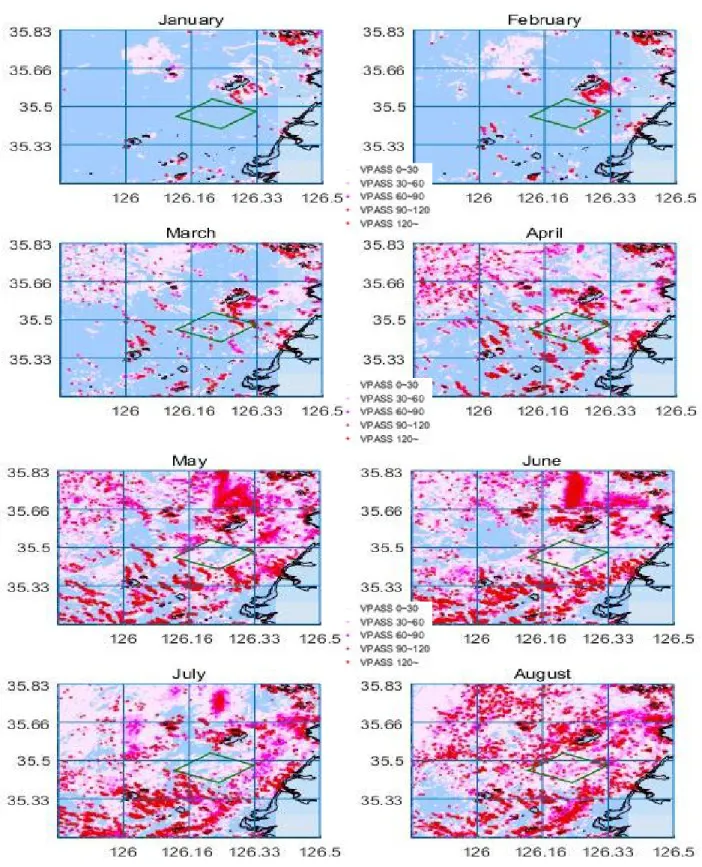
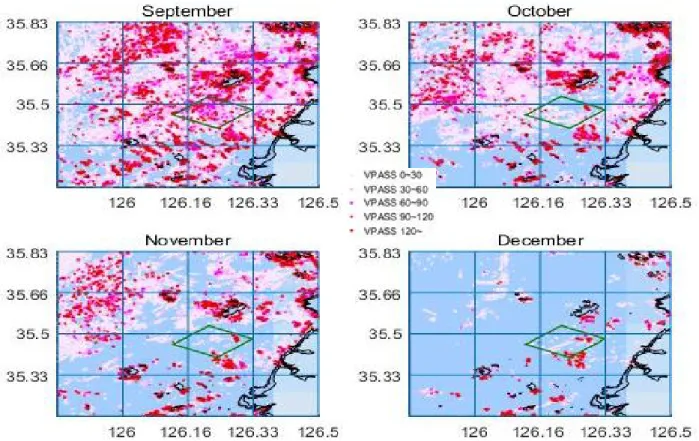
Fig. A-1 and A-2 in the Appendix provide a density distribution chart by month with trajectories for vessels engaged in fishing.
The grid represents 0.1 mile distances, and color differences indicate 5 grades in accordance with the accumulated number of vessel trajectories. The distribution of vessels engaged in fishing is seen to be relatively greater from April to October. The
distribution of vessels engaged in fishing in areas near the offshore wind farm in particular is visible for the period considered.
Therefore, it was confirmed that Chilsan fishing ground forms during this period
5. Traffic Safety Assessment of Fishing Vessels
5.1 Traffic Volume of Fishing Vessels
Table 4 shows an analysis by month of the number of fishing vessels that navigated through or engaged in fishing within a 134
Fig. 8. Average number of vessels engaged in fishing per day by the fishing section.
Fig. 7. Box plot of vessels engaged in fishing by the fishing section.
demonstration and testing zone for offshore wind power. There
㎢
were 2,113 vessels engaged in fishing in 2014, 1,931 vessels that navigated the area, and 4,044 ships in total that passed through the offshore wind farm. The vessels that navigated the area did so to enter other fishing grounds.
Month Vessel engaged in fishing
Vessel to
navigate through Total
January 1 16 17
February 19 38 57
March 94 95 189
April 144 163 307
May 231 151 382
June 177 67 244
July 104 78 182
August 334 186 520
September 765 414 1179
October 133 549 682
November 38 139 177
December 73 35 108
Total 2,113 1,931 4,044
Table 4. Number of fishing vessels by month
5.2 Traffic Safety Assessment for Fishing Vessels Policies related to fishing vessels within an offshore wind farm differ by nation. Several nations allow navigation or fishing in offshore wind farms (MARIN, 2010). Among these is Greater Gabbard of the UK, which is the largest offshore wind farm in the world. It now allows for fishing vessels to navigate through and fish within its territory (GGOWL, 2013). The traffic safety of fishing vessels within offshore wind farms has been evaluated with this in mind, applying a collision model.
1) Collision Model
We used an SSPA model developed with the most recent available information for model assumptions. The structure of the SSPA calculation model is similar to models used by Germanischer Lloyd (GL), Det Norske Veritas (DNV) and Maritime Research Institute Netherlands (MARIN) for wind farms and offshore platforms. This SSPA model was designed to be simple and transparent, giving good prerequisites for explaining the relevant physics (SAFESHIP, 2005; SSPA, 2008). The return period of the SSPA model was the same as in Formula (1)
⋅⋅⋅⋅⋅⋅ (1)
where,
: Frequency of a passing ship colliding under power (per year)
n : Total traffic volume on the seaway (vessels/year)
: Probability of having a certain offset from current position
: Probability of following a certain course heading towards an object
: Probability of human failure during planning and execution to pass an object
: Probability of technical failure of navigational equipment or of watch keeping failure
: Probability of failure of the wind farm safety equipment or a potential stand-by boat
: Probability of the crew onboard being unable to react in time to correct a navigational error
It is assumed that the course deviation of a vessel can vary between 90 and 90 degrees, but in reality this is impossible, so – that in this study is omitted to provide a more conservative calculation (Yang, 2014b). adds 2% traffic, which differs from the normal distribution function for a seaway by a uniform amount. , , relate to human failure, and, represents the probability of failure to avoid an obstacle in the seaway. The value of is agreed in GL and DNV. is the exponential distribution function (SSPA, 2008). Therefore, the return period of vessels in the offshore wind farm was modified as in Formula (2).
⋅⋅⋅ (2)
where,
⋅
∞
⋅
×
: Mean for lateral distribution
: Standard deviation for lateral distribution
d : Distance between the center line of seaway and a wind turbine
2) Traffic Safety Assessment for Fishing Vessels Within the Offshore Wind Farm
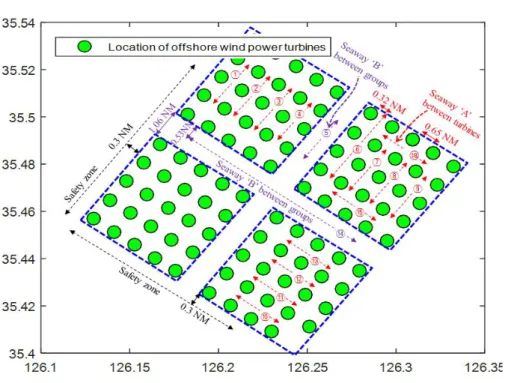
As shown in Fig. 9, there are eighteen seaways to navigate through offshore wind farm, the distance between the center line of the seaway and the turbine is 0.32 NM, the distance between the complex of the generator’s groups is 0.53 NM. Table 5 shows the return period of the seaway A between the turbines and the seaway B between the complex of the generator’s groups. For total 4,044 vessels of annual traffic of fishing vessels drawn in Table 4, we assumed that 224 ships for traffic volume of one seaway.
Meanwhile, as there are offshore wind power in both side of the seaway A and B, we calculated with multiplying two by the geometric possibility of . Also, was considered to be 0.3 NM, assuming that the operator of each fishing vessel regarded the offshore wind power facilities as navigational marks (SSPA, 2008).
There is no general standard to be employed internationally for risk acceptance in offshore wind farm safety. In SSPA, there is no applicable quantitative acceptance criteria, but, as shown in Table 6, an acceptance standard for collision return periods from Germany was applied. In Germany, if a collision return period is more than 100 years, it is considered acceptable, and if a collision cycle is 50-100 years, further analysis is deemed necessary to prepare measures for collision reduction. If the result is under 50 years, this is not acceptable (BMVBW, 2005).
Applying the German standard, the collision cycle of Seaway A was 55 years, so for navigation safety measures should be required in order to reduce collision frequency. For the traffic safety of Seaway A, an AtoN AIS navigation aid should be installed with light near the offshore wind farm. Specially, the character of the light is important to identify offshore wind farms, and it is useful to install a light with characters described by Fl Y(4) 12s‶ ″ to blink on and off periodically (Yang, 2014a). In addition, if a fog signal is installed, this would also be helpful for identifying the offshore wind power facilities as fishing vessels navigate at night with limited visibility.
Factor Seaway A
between Turbines Seaway B between Groups
Traffic (ship) 244 244
d (NM) 0.32 0.53
(NM) 0.3 0.3
0.2779 0.0873
0.0003 0.0003
0.9633 0.9526
8.0E-05 2.4E-05
0.0180 0.0054
Return period (year) 55 184
Table 5. Return period between wind farm and fishing vessels by Seaway
Fig. 9. Seaway between turbines, seaway between groups and safety zone.
Acceptability Time Between Collisions (years)
Acceptable > 100
Further analysis necessary 50-100
Not acceptable < 50
Table 6. Risk acceptance criteria in German (based on data from BMVBW, 2005)
3) Safety Zone
We conducted the traffic safety assessment in safety zone of offshore wind farm. Table 7 shows the return period according to the separation distance from the boundary of turbine to safety zone. When set with 0.1 NM, the collision cycle is 41 years, with 0.2NM, it is 60 years, and if with 0.3 NM, is presented 97 years.
Therefore, it is resulted that when the safety zone is set in distance of 0.3NM at least from the boundary of turbine, the collision return periods is close to 100 years.
Factor Safety Zone
Traffic (ship) 244 244 244 244
d (NM) 0.1 0.2 0.3 0.4
(NM) 0.3 0.3 0.3 0.3
0.3632 0.2497 0.1588 0.0938
0.0003 0.0003 0.0003 0.0003
0.9937 0.9823 0.9677 0.9507
0.0243 0.0165 0.0104 0.0060
Return period
(year) 41 60 97 166
Table 7. Return period of the safety zone
6. Conclusion
The purpose of this study was to analyze traffic safety assessments for fishing vessels near the southwest offshore wind farm. This study applied a collision model for traffic safety assessment. Also, a spatiotemporal analysis of vessels engaged in fishing was performed to identify fishing hotspots around the offshore wind farm.
As a result, September was identified as having a high average number of vessels engaged in fishing, with 62 ships operating in sector 184-6 and 55 ships in sector 184-6. In addition, sectors 184-8 and 192-2, where an offshore wind farm would be located, had 55 and 38 ships operating, respectively.
As the return period of Seaway A between the turbines was 55
years, it requires safety measures in order to reduce collision frequency to acceptable levels for fishing vessels to pass.
Meanwhile, the return period of Seaway B between groups of generators was 184 years so traffic safety can be considered secure.
Safety zones for offshore wind farms should be installed over a distance of at least 0.3 NM from turbine boundaries so the collision return periods will be close to 100 years.
This traffic safety assessment is expected to contribute to preventing marine accidents, as well as having use as a basic data set for installing coastal Vessel Traffic Services (VTS) later.
Therefore, fishing vessels with heavy seasonal changes in time and space should be further analyzed. Particularly, traffic safety assessments for fishing vessels in offshore wind farms would be supported by the acquisition of big data from relevant departments.
References
[1] Bundesministerium für Verkehr, Bau-und Wohnungswesen (2005), Genehmigungsrelevante Richtwerte für Offshore-Windparks, Bericht einer Arbeitsgruppe, Bundesministerium für Verkehr, Bau- und Wohnungswesen:
Bonn, Main document and Appendix 2, both in German.
[2] GGOWL(2013), Guidelines for Sailing and Fishing Activities within the Greater Gabbard Wind Farm, Greater Gabbard Offshore Winds Ltd, pp. 1-3.
[3] Kang, W. S., T. H. Song, Y. D. Kim and Y. S. Park(2017), A Study on Seasonal Variation in Maritime Traffic Congestion on Major Port and Coastal Routes, Journal of the Korean Society of Marine Environment & Safety, Vol. 23, No. 1, pp. 1-8.
[4] Kim, J.(2009), A Study on Chilsan Fishing Area and Croaker Pasi Market, Journal of the Island Culture, Vol. 34, pp.
175-200.
[5] MGN 275(2005), Proposed UK Offshore Renewable Energy Installations(OREI) - Guidance on Navigational Safety Issues, Maritime and Coastguard Agency, UK, pp. 1-14.
[6] MGN 543(2016), Offshore Renewable Energy Installations (OREI) - Guidance on UK Navigational Practice, Safety and Emergency Response, Maritime and Coastguard Agency, UK, pp. 1-23.
[7] MSG(2014), Wind Farms and Navigation, Michigan Sea Grant, pp. 1-12.
[8] Na, S. M.(2008), A Study on Datbae-Fishery of the Yellow
Corvina-Fishing in Jo island, Journal of the Island Culture, Vol. 31, pp. 61-92.
[9] SAFESHIP(2005), Reduction of Ship Collision Risks for Offshore Wind Farms, Collision Frequencies, Germanischer Lloyd AG, Maritime Research Institute Netherlands MARIN, Technical University of Denmark, No. 6, pp. 197-201.
[10] SSPA(2008), Methodology for Assessing Risks to Ship Traffic from Offshore Wind Farms, VINDPILOT-to Vattenfall AB and Swedish Energy Agency, Appendix D, pp. 1-18.
[11] Sung, J. K. and T. J. Lee(2013), Study on Present Status and Future Direction of Korean Offshore Wind Power, The Transactions of the Korean Institute of Electrical Engineers, Vol. 62, No. 3, pp. 312-321.
[12] Yang, H. S.(2014a), Selection of Light Character for Marking with Lights on Offshore Wind Farms, Journal of Korean Navigation and Port Research, Vol. 38, No. 2, pp. 105-110.
[13] Yang, H. S.(2014b), Study on the Vessel Traffic Safety Assessment for Routeing Measures of Offshore Wind Farm, Journal of the Korean Society of Marine Environment &
Safety, Vol. 20, No. 2, pp. 186-192.
[14] Yoo, J. H.(2010), Offshore Wind Farm Road Map, Journal of electrical world, No. 408, pp. 56-59.
[15] Yoo, S. L., S. B. Park, Y. S. Park and J. Y. Jeong(2015), A Study on the Observation Days of Maritime Traffic Investigation, Journal of the Korean Society of Marine Environment & Safety, Vol. 21, No. 4, pp. 397-402.
Received : 2017. 05. 08.
Revised : 2017. 05. 19.
Accepted : 2017. 05. 29.
Appendix A
Fig. A-1. Trajectories of the vessels engaged in fishing at study area from January to August. in 2014.
Fig. A-2. Trajectories of the vessels engaged in fishing at study area from September to August in 2014.