• 검색 결과가 없습니다.

The Relationship between Ownership Structure and Conservatism of Companies in Iran

N/A
N/A
Protected

Academic year: 2021

Share "The Relationship between Ownership Structure and Conservatism of Companies in Iran"

Copied!
6
0
0

로드 중.... (전체 텍스트 보기)

전체 글

(1)

Abstract

Purpose - Since Iran’s economy is only now developing, and its stock market is only now emerging, we should deal with the relationship between ownership structure and conservative ac- counting of companies to see whether such a relationship exists in Iran’s market. This study aims to investigate the relationship between ownership structure and accounting conservatism of listed companies on the Tehran Stock Exchange.

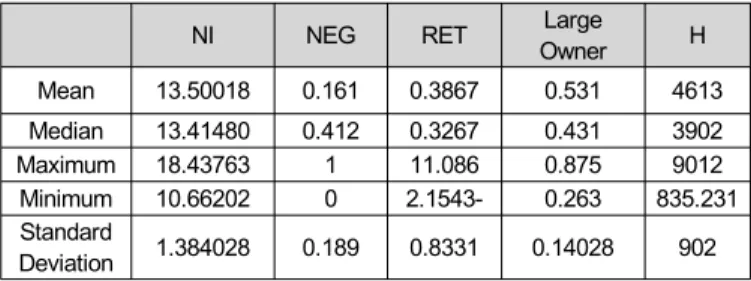
Research design, data, and methodology - All listed compa- nies on the Tehran Stock Exchange, for which the required in- formation financial statements (balance sheet, profit and loss ac- count) could be acquired for the period 2007 2012, were – studied. A total of 123 companies from various industries was selected.

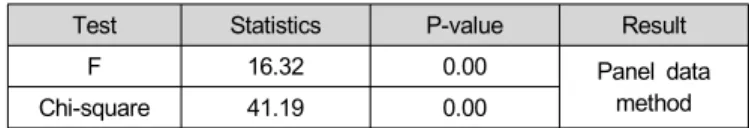
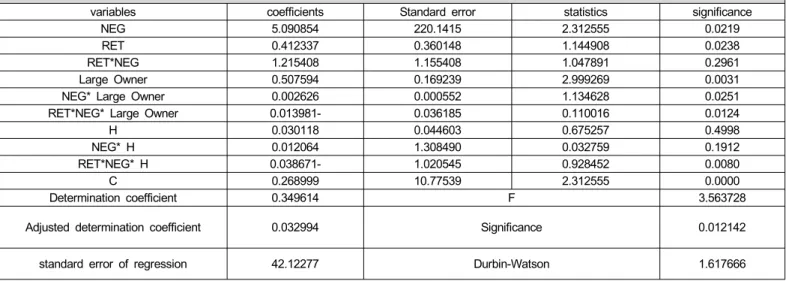
Results - In order to test the hypotheses, multi variate re- gression (inter procedure), with their meaningful t- and f-sta- tistics, and a Durbin-Watson autocorrelation model were used.

Conclusions - The research results show that the ownership of major shareholders and ownership concentration have a neg- ative significant relationship with accounting conservatism.

Therefore, as a significant negative relationship between concen- tration of ownership and accounting conservatism at the 95%

confidence level was found, the second hypothesis was confirmed.

Keywords: Ownership Structure, Conservatism, Major Shareholder, Ownership Concentration.

JEL Classifications: F31, F47, L83.

* Corresponding Author, Assistant Professor of Accounting, Ferdowsi University of Mashhad, Iran, E-mail: [email protected].

** Assistant Professor of Accounting, Hormozgan University, Hormozgan, Iran.

*** M.A. Student of Accounting, Geshm Branch, Geshm, Iran.

1. Introduction

Ball (2001) and Watts (2003) propose that stock shareholders support conservatism as a monitoring tool. According to share- holders’ demand for conservatism, LaFond and Roychowdhury (2008) show that conservatism is higher when the separation between ownership and control is announced more, and LaFond and Watts (2008) propose that the lack of equal access to in- formation for managers and shareholders leads to conservative reports.

Financial lists form the main part of financial reporting. The objective of financial lists is to present categorized information about financial status, financial performance and financial flexi- bility of the business unit that would be useful for a wide range of people to make economic decisions.

The purposes of financial reporting and the basics of ac- counting necessitate the information from financial reporting to have certain features. In the theoretical concepts of Iran’s finan- cial reporting, these features are described as qualitative features. One of these features is conservatism which is defined as the use of a certain degree of vigilance which is needed for evaluating in vague conditions. Incomes or assets should not be presented more than they are or debts must not be reported less than they are.

Basu (1997) describes conservatism as being committed to having a high degree of confirmation for recognizing good news like benefit, as opposed to recognizing bad news like loss. This definition describes conservatism from the benefit and loss point of view. Another definition of conservatism is given using the balance sheet approach. According to this approach, in cases which there is a real doubt about choosing between a numbers of reporting procedures, that method must be chosen which would have the least effect on the salary of the stock shareholders.

The third definition of conservatism is based on the mixed approach of balance sheet and benefit and loss. In this third approach, conservatism is an accounting concept which results in the decrease of the reported benefit through late recognition of income and quicker recognition of cost, low evaluation of as- set and high evaluation of debts.

Print ISSN: 1738-3110 / Online ISSN 2093-7717 doi: 10.13106/jds.2014.vol12.no5.27.

The Relationship between Ownership Structure and Conservatism of Companies in Iran

3)

Mahdi Salehi*, Bizhan Abedini**, Razieh Bahrani***

Received: March 04, 2014. Revised: March 17, 2014. Accepted: May 14, 2014.

(2)

The most accepted definition of conservatism is a differ- entiated encounter with identifying benefit and loss. This differ- entiated approach is the result of an asymmetric investigation capability for benefits and losses. In other words, information which is less verifiable than benefit’s information suffices. This symmetric investigation capability could result from employment contract or corporate governance. Managers conceal the in- formation about loss in order not to lose their good reputation (Jang et al., 2012).

The extreme form of conservatism is defined as not identify- ing the benefits until their related information is completely identifiable. Why is not the extreme form of conservatism used?

The reason is the cost of untimely information. Delay in identify- ing the benefits whose related information has a high degree of investigation capability is costly both for giving reward to man- agers and the approval of pecuniary benefit for shareholders.

The application of the investigation capability principle allows an on time rewarding.

Institutional investors, who own a great deal of compa- nies’stocks, have a great influence on those companies.

Conservative accounting procedures prevents managers from a profit-seeking behavior and extreme optimism in presenting ben- efits, therefore resulting in more reliable benefit reports. In this research, we are going to indicate the effect of institutional own- ers on conservative accounting procedures.

LaFond and Roychowdhury (2008) showed that commercial units with property management mostly do not report a con- servative benefit more than it is a fact which is in corre- spondence with the request of shareholders for reducing agents.

Jang et al. (2012) showed that the concentration of the man- agement increases the possibility for overcoming the lack of in- formation symmetry between managers and shareholders through private relational channels rather than public announcement. This leads to the decrease of demand for con- servatism in benefits.

According to what has been previously mentioned, the ques- tion arises that is there a significant relationship between con- servative accounting employed by companies and the degree of institutional ownership of companies? Therefore, our main ob- jective in this research is to answer this question.

2. The Objectives

Each research is conducted for reaching specific objectives.

These objectives are embedded in the research question.

Research objectives could be general or specific.

The main objective of this research is to examine the rela- tionship between ownership structure and accounting con- servatism in companies which are listed on the Tehran Stock Exchange.

3. The Importance of the study

Since Iran’s economy is only now developing and stock mar- ket is only emerging, we should deal with the relationship be- tween ownership structure and conservative accounting of com- panies to see whether such a relation exists in Iran’s market.

The significance of this research could be viewed from two aspects. First, the theoretical significance which considers the relationship between conservative accounting and ownership structure in Iran’s market and second, it’s functional significance.

By discovering these kinds of relationships, Shareholders and stakeholders could find out the degree of conservatism in ac- counting reports of companies according to their ownership structure and indicate the reliability of such reports for making important decisions.

The following chapters are organized as follows: in the sec- ond section the review of related literature is presented. In the third section, research methodology is described, the fourth sec- tion presents the analysis of data and findings, the fifth section consists of the results, the sixth section contains the list and references and the seventh section presents the abstract of the article in English.

4. Related Literature

LaFond and Roychowdhury (2008) showed that as the per- centage of managers’ ownership reduces, regarding to the neg- ative correlation of their benefits with that of shareholders and the increase in the costs of the agency, the demand for con- servatism increases.

Chi et al.(2009) conducted a study and found out that con- servatism has a negative correlation with the percentage of ma- jor shareholders and there is more significance when the per- centage of the major shareholders’ownership is more than 30%.

Their research results also showed that governmental ownership has no effect on the relationship between the ownership of ma- jor shareholders and conservatism.

5. Research methodology

This research is a correlation type of research. Correlation re- search is conducted when the researcher has two or more groups of different information (in the form of independent varia- bles) related to one group and the objective of the study is to examine the variation degree of 2 or more factors. Regression analysis is one type of correlation studies which would be used in this research.

The methodology of the current study is inductive-deductive,

which means that the theoretical framework and background of

the study through library reading, articles and websites are done

using inductive reasoning and confirmation or rejection of hy-

(3)

pothesis happens through deductive reasoning. Regarding the goals, there search methodology is functional and regarding da- ta collection method, it’s descriptive correlation. This method is useful in studies which aim at discovering the relationship be- tween variables. This research falls under the category of "after event"studies, because previous information is used for testing the hypothesis.

Since this study aims at reaching a scientific objective and gives useful information about current realities, it also has a functional nature.

A set of people or objects that have a minimum of one mu- tual feature are called population. In fact, population includes all people, events or objects that the researcher wants to study.

The population of the current study is all listed companies on the Tehran Stock Exchange from 2007 to the end of 2012.

The main reason for selecting this population is that the in- formation related to these companies is standard, reliable and conceivable.

5.1. Studied sample and sampling method

Sample is a part of the population. It’s the set of measure- ments of the population that are collected in the course of study. The procedure of a study could be defined as an effort to conceive the behavior of a population based on the in- formation collected from the sample. Information collection for the whole population is costly and time-consuming. Moreover, gathering information from the whole population is sometimes irrational. Therefore, we have to exclude a sample, although we know that sampling reduces the certainty and trustfulness of the results.

5.2. Data collection

Data for this study have been collected using two methods:

Information which was related to the theoretical discussions of the research has been collected from different sources like books and international journals which were available online.

The information used for testing the research’s hypotheses was collected using Tehran stock exchange’s CDs and soft wares. In cases which the software did not contain the necessary data, companies’ financial statements, reports of the board of directors and the reports received from Tehranstock exchange were used.

6. Research hypotheses

According to what has been previously mentioned, research hypotheses are explained as follows.

Hypothesis 1: there is a significant relationship between the ownership of major shareholders and con- servative policy in accounting.

Hypothesis 2: there is a significant relationship between concen- tration of ownership and accounting conservatism.

Data analysis and research findings:

In the first phase of the study, we measure conservatism based on the revenue- income model proposed by Basu (1997) that incomes will return according to revenues and the revenue coefficient changes with a percentage of the revenue. This mod- el uses positive (negative) joint profits to obtain good (bad) news. Basu (1997) estimates the following regression model:

NI

jt

0

1

NEG

jt

2

RET

jt

3

RET

jt

*NEG

jt

NIjt= yearly profit before the extraordinary announcement (IB) of the company (j) in the year (t).

RETj

t

= yield of company (j) during (t)

NEGjt= virtual variable of company(j) in the year (t) which is 1 for negative yields and 0 for positive yields.

In this equation, β

2

obtains the gradation of revenues related to good news and β

3

obtains the gradation related to bad news and therefore, it is a scale for conservatism.

Finally, for finding the relation between companies’ ownership, concentration of ownership and conservatism, we used the mod- el of Laffond and Watts (2008); Laffond and Roichhood Harry (2008) and evaluate Basu’s model, whichindicate conservatism (Basu’s correlation) as the ownership’s performance and other factors which determine conservatism:

NIjt= 0+ 1NEGjt+ 2RETjt+ 3RETjt*NEGjt+ 4 Large Owner jt+ β β β β β 5NEGjt* Large Owner jt+ 6RETjt*NEGjt* Large Owner jt+ 7

β β β

Hjt + 8NEGjt* Hjt + 9RETjt*NEGjt * Hjt + β β ε

NIjt= yearly profit before the extraordinary announcement (IB) of the company (j) in the year (t).

RETjt= yield of company (j) during (t)

NEGjt= virtual variable of company(j) in the year (t) which is 1 for negative yields and 0 for positive yields.

Large Ownerjt = overall percentage of major shareholders’

ownership of the company

Hjt= equals to concentration of ownership which is obtained using the Herfindahl correlation as follows.

<Table 1> The results of descriptive statistics used in this study

NI NEG RET Large

Owner H

Mean 13.50018 0.161 0.3867 0.531 4613

Median 13.41480 0.412 0.3267 0.431 3902

Maximum 18.43763 1 11.086 0.875 9012

Minimum 10.66202 0 2.1543- 0.263 835.231

Standard

Deviation 1.384028 0.189 0.8331 0.14028 902

Table 1 shows that the variable "yearly profit" before un-

expected announcement (NI(which is homogenized using its nat-

ural logarithm, has a mean of 13.500. the highest value of this

variable is 18.437 and its lowest is 10.662. Standard deviation

of this variable is 1.38 which has less dispersion compared to

other related studies. The lowest value for company’s revenue

(RET) is 2.154 and its highest is 11.08, while its mean is

0.38.concentration of ownership is obtained using the Herfindahl

index which ranges from 0 to 100000. The mean for concen-

(4)

tration of ownership is 4613, its highest value is 9012 and its lowest is 835.23. Moreover, the results of this study for the mean of the percentage of major shareholders’ ownership show 0.531, which means that in the sample companies of this study, half of companies’ stocks are possessed by owners who have more than 5% share of the company. The Maximum and mini- mum for this variable are 0.87 and 0.26, relatively. Table 1 also contains descriptive statistics of other research variables.

Since the correlation method has been used in this study, we should first show that the variables studied in the correlation test are normally distributed.

H

0

: Data distribution is not normal H

1

: data distribution is normal

Table 2 shows the level of significance of the Kolmogorov-Smirnov test for dependent variables of the study.

<Table 2> Normal distribution test

NI NEG RET Large

Owner H

Number of observations 615 615 615 615 615 Kolmogorov-Smirnov

statistics 1.212 0.741 2.564 2.111 0.987 significance 0.106 0.643 0.653 0.762 0.066

As we can see, the level of significance for Kolmogorov-Smirnov test for research variables is higher than 0.05, so these variables have a normal distribution. We use parametric tests for the analysis of data and testing the re- search hypotheses.

In order to test research hypotheses, we have used re- gression and the analysis of panel data.

In order to combine cross-sectional data and time series da- ta, we use panel data method. In the panel data method, we measure variables both among the population (company) and over time (year).

In order to test the recognition of panel data, we use the Chaw test.

Hypotheses of this test are as follows:

H

0

: Pooled Model H

1

: Panel Model

Hypothesis H

0

is based on the lack of unobservable individual works and H

1

is based on the existence of unobservable in- dividual works. If H

0

hypothesis is accepted, it means that the model lacks unobservable individual works. Therefore, it can be estimated using the model of combined regression, but if H1 hy- pothesis is accepted, it means that unobservable individual works exist in the model.

The results of this study show that the value of statistic F is 16.32 where p-value is zero. Therefore, the hypothesis of com- bined model is not confirmed. In other words, individual or group works exist and panel data method must be used for evaluating the model. In the next stage, for indicating a suitable model for estimating the regression model, White and Hausman

tests were used.

<Table 3> Panel or pooled tests

Test Statistics P-value Result

F 16.32 0.00 Panel data

method

Chi-square 41.19 0.00

For studying the Variance anisotropy among disturbing state- ments, (ARCH) LM and White tests were used. The results of the Variance anisotropy test are expressed in the following ta- bles:

<Table 4> The results of the ARCH LM test

Description Value of statistics Probability

F-statistic 154.226 0.0000

Obs*R-squared 200.897 0.0003

<Table 5> The results of the White test

Description Value of statistics Probability

F-statistic 7.890247 0.0030

Obs*R-squared 14.66849 0.0021

Scaled explained SS 61.10174 0.0045

Probability of the model’s tests is lower than 5%. Since the statistics of this test is not significant at the 5% level, the con- sistency assumption is rejected and Variance anisotropy of dis- turbing statements is accepted.

For testing the significance of fixed effects method, Hausman and F tests must be used.

<Table 6> The results of the F test (Test cross-section fixed effects) Description Value of

statistics Degree of

freedom Probability

Cross-section F 7.57403 111 0.0003

<Table 7> The results of the Hausman test

Descriptive Value of statistics D.f Probability

Cross-section random 16.076208 5 0.0034

Since the probability obtained from both tests which were conducted for the regression model were less than 5%, we should use the fixed effects method in this model.

The hypotheses of the study could be expressed as null hy- pothesis and alternative hypotheses:

H

0

: there is not a significant relationship between ownership

(5)

by major shareholders and conservative policy in accounting.

H

1

: There is a significant relationship between ownership by major shareholders and conservative policy in accounting.

H

0

: There is not a significant relationship between concen- tration of ownership and accounting conservatism.

H

1

: There is a significant relationship between concentration of ownership and accounting conservatism.

Assumptions of linear regression:

<Table 8> F test for measuring the linear relationship

description Value of statistics probability

F-statistic 3.563728 0.012142

Table 9 shows that the estimated coefficient for the RET vari- able (β

4

) is 0.4123. Looking at the significance column, we see that the estimated coefficient is significant at the confidence lev- el of 95%, for its significance level is 0.023 which is less than 0.05. Consequently, this variable must be remained as an in- dependent variable in the multivariate regression model of the research. moreover, table 9 shows that the estimated coefficient for the RET*NEG* Large Owner variable ( 6) which was used β for testing the first hypothesis of the study is equal to - 0.013 and this means that this coefficient is significant at the error level of 0.05. In other words, there is a significant negative rela- tionship between ownership by major shareholders and con- servative policy in accounting. The first hypothesis of the re- search is confirmed.

Table 9 also shows that the estimated coefficient for the vari- able RET*NEG* H is equal to -0.038 which according to the significance column, it sob served that the estimated coefficient is significant at the confidence level of 95%, because its sig- nificance is 0.008 and this number is less than the accepted er- ror in this research. Therefore, the significant negative relation- ship between concentration of ownership and accounting con- servatism is confirmed and this means that the second hypoth- esis of the research is confirmed. In addition, the results of the analysis of the data using the regression model shows that the coefficient of determination is 34% and it shows that 34% of the changes of the dependent variable are caused by the in- dependent variables.

7. Discussion and conclusion

In the analysis of multivariate regression model, the estimated coefficient for the variable RET*NEG* Large Owner ( 6) is equal β to 0.013 and the significance of this coefficient is 0.012 and this is less than the error level of error which is accepted in this research. In other words, there is a significant negative relation- ship between the ownership of major shareholders and con- servative accounting policy. This confirms the first hypothesis and it’s in line with the theoretical basics discussed in previous chapters and our expectations. Previous studies expressed that institutional investors have a great influence on companies. They also have some stimulus for monitoring the procedures in the company (including accounting procedures). Conservative ac- counting procedures deter managers from opportunistic behavior and excessive optimism in presenting the profits and therefore, result in more reliable profit reports. This study aims at de- termining the influence of institutional owners on conservative accounting procedures (Jang et al., 2012).

<Table 9> The results of the mixed regression analysis test

NIjt= 0+ 1NEGjt+ 2RETjt+ 3RETjt*NEGjt+ 4 Large Owner jt+ 5NEGjt* Large Owner jt+ 6RETjt*NEGjt* Large Owner jt+ 7 Hjt + 8NEGjt* Hjt β β β β β β β β β + 9RETjt*NEGjt * Hjt + β ε

variables coefficients Standard error statistics significance

NEG 5.090854 220.1415 2.312555 0.0219

RET 0.412337 0.360148 1.144908 0.0238

RET*NEG 1.215408 1.155408 1.047891 0.2961

Large Owner 0.507594 0.169239 2.999269 0.0031

NEG* Large Owner 0.002626 0.000552 1.134628 0.0251

RET*NEG* Large Owner 0.013981- 0.036185 0.110016 0.0124

H 0.030118 0.044603 0.675257 0.4998

NEG* H 0.012064 1.308490 0.032759 0.1912

RET*NEG* H 0.038671- 1.020545 0.928452 0.0080

C 0.268999 10.77539 2.312555 0.0000

Determination coefficient 0.349614 F 3.563728

Adjusted determination coefficient 0.032994 Significance 0.012142

standard error of regression 42.12277 Durbin-Watson 1.617666

(6)

The estimated coefficient for the variable "RET*NEG* H" is 0.038 which according to the significance column, the estimated coefficient is significant at the confidence level of 95%. Its sig- nificance is 0.008 and this number is less than 5%, the level of error accepted in this research study. Therefore, the significant negative relationship between concentration of ownership and accounting conservatism at the confidence level of 95% has been confirmed, the second hypothesis being approved.

References

Ball, R. (2001). Infrastructure requirements for an economically efficient system of public financial reporting and disclosure. Brookings-Wharton Papers on Financial Services, 1, 127-169.

Ball, R., and Robin, A. (2003). Incentives versus standards:

properties of accounting income in four East Asian countries. Journal of Accounting and Economics, 36, 235

270.

Ball, R., and Shivakumar, L. (2005). Earnings quality in UK pri- vate firms: comparative loss recognition timeliness.

Journal of Accounting and Economics, 39, 83 128. – Basu, S. (1997). The conservatism principle and the asymmetric

timeliness of earnings. Journal of Accounting and Economics, 25, 1 34. –

Bushee, B. (2001). Do institutional investors prefer near term earnings over long-run value?. Contemporary Accounting Research, 18, 207 246. –

Bushee, B., and Noe, C. (2000). Corporate disclosure practices, institutional investors, and stock return volatility. Journal of Accounting Research, 38, 171 202. –

Chen, X., Harford, J., and Li, K. (2007). Monitoring: which in-

stitutions matter? Journal of Financial Economics, 86, 279 305. –

Chi, Wuchun, Liu, Chiawen, and Wang, Taychang (2009). What Affects Accounting Conservatism: A Corporate Governance Perspective. Journal of Contemporary Accounting & Economics, 5 (1), 47-59.

Chung, H., and Wynn, J. (2008). Managerial legal liability cover- age and earnings conservatism. Journal of Accounting and Economics, 46, 135 153. –

Feltham, G., and Ohlson, J. A. (1995). Valuation and clean sur- plus accounting for operating and financial activities.

Contemporary Accounting Research, 11(2), 689 731. – Givoly, D., and Hayn, C. ( 2000). The Changing Time-series

Properties of Earnings, Cash Flows and Accruals: Has Financial Reporting Become More Conservative?".

Journal of Accounting and Economics, 29, 287-320.

Holthausen, R., and Watts, R. (2001). The relevance of the val- ue-relevance literature for financial accounting standard setting. Journal of Accounting and Economics, 31, 3 75. – Khan, M., and Watts, R. (2009). Estimation and validation of a

firm-year measure of accounting conservatism. Journal of Accounting and Economics, 48, 132 150. –

LaFond, R., and Roychowdhury, S. (2008). Managerial owner- ship and accounting conservatism. Journal of Accounting Research, 46, 101 135. –

LaFond, R., and Watts, R. (2008). The information role of conservatism. The Accounting Review, 83, 447 478. – Watts, R. (2003). Conservatism in accounting. Part I: ex-

planations and implications. Accounting Horizons, 17, 207 221. –

Yan, X., and Zhang, Z. (2009). Institutional investors and equity returns: are short-term institutions better informed?.

Review of Financial Studies, 22, 893 924. –

수치

Table 1 shows that the variable &#34;yearly profit&#34; before un- un-expected announcement (NI(which is homogenized using its  nat-ural logarithm, has a mean of 13.500
Table 2 shows the level of significance of the Kolmogorov-Smirnov test for dependent variables of the study.
Table 9 also shows that the estimated coefficient for the vari- vari-able RET*NEG* H is equal to -0.038 which according to the significance column, it sob served that the estimated coefficient is significant at the confidence level of 95%, because its  sig

참조

관련 문서

Therefore, this study aims to investigate the relationship between explicit grammar instruction and English speaking of lower-grade students in third-grade

Objectives: This study aimed to investigate the relationship between job stress and turnover intention of employed opticians and to investigate the mediating effect of burnout

The purpose of this study was to analyze the relations between the leader-member exchange relationship, job satisfaction, and organizational citizenship behavior of sports

The purpose of this study is to verify whether The mediating effects of planned happenstance skills on the relationship between perceived social support

Objective: The purpose of this study was to investigate the relationship between the awareness of death and the ethical attitude to Do-Not-Resuscitate (DNR) among some

Purpose: The aim of this study is to identify the relationship between knowledge and awareness of radiation department students and their intent in

The present study used the guinea pig CPI model to investigate the effect of hypoxia on the development of mature neurons and to evaluate the relationship

Objective: The purpose of this study is to investigate the relationship between employee satisfaction and patient safety and quality improvement after compulsory certification