INTRODUCTION
Alkaline phosphatase, which is produced by various microorganisms in the limnological envi- ronment (Berman, 1970; Stewart and Wetzel, 1982; Francko, 1983), is considered to play an important role in the phosphorus cycle (Reichardt et al., 1967). It is commonly regarded that the enzyme is produced in response to the acute reactive phosphorus depletion (Thingstad, 1988).
Therefore alkaline phosphatase activity (APA) has been considered to indicate phosphorus nutri- ent status of the aquatic microorganisms (Chrost et al., 1984). However, some studies in France (Jamet et al., 2001) and in Japan (Hirotani et al., 2001, 2004) raised doubts on this recognition. The aim of this study is to examine the relation of APA with phosphorus availability and microbial
parameters.
MATERIALS AND METHODS
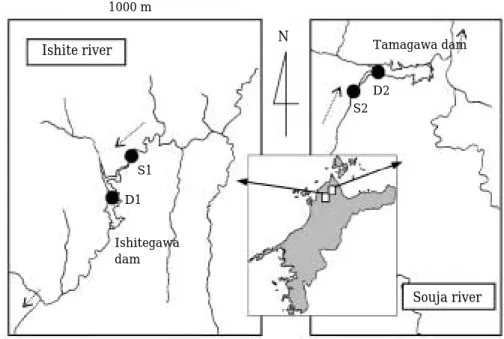
The study was done mainly in the upper rea- ches of the Ishite River, which originates from low peaked mountains ca. 1100 m above sea level, and in the Souja River which originates from the same mountain range and flows through the adjacent watershed (Fig. 1). Coniferous planta- tions mainly covered the surrounding mountains and there are multipurpose dams in both water- sheds. The total storage volume and watershed area of Ishitegawa Dam (Ishite River) and Tama- gawa Dam (Souja River) are 1.3×10
7m
3, 72.6 km
2, 9.9×10
6m
3, and 38.1 km
2, respectively.
These two dam reservoirs are located only 14 km apart, so that the climatic and geological condi-
─
─ 406 ──
Vertical Profiles of Alkaline Phosphatase Activity in Dam Reservoirs and its Relation with Microbial Parameters
Hirotani, Hiroshi*, Ayumi Nakagawa1and Hisanori Kagawa1
(Dept. of Arts and Sciences, Osaka Kyoiku Univ., Kashiwara, Osaka, 582-8582, Japan
1Faculty of Agriculture, Ehime Univ., Matsuyama, Ehime 790-8566, Japan)
The alkaline phosphatase activity (APA) of two dam reservoirs and inflowing streams were measured monthly in 2000. During summer months in 2001, the vertical profiles of APA and related parameters were also examined in one of the reservoirs. The APA was relatively high during the summer season in the epilimnion while it was almost invariable in the hypolimnion. A small increase in APA was observed at just above the bottom. The APA fluctuation was independent of the concentration of soluble reactive phosphorus. It was assumed that APA is not indicative of the phosphorus availability status. An examination of size-fractionated samples suggested that APA in reservoirs was attached to particles larger than 0.4 µµm, whereas in streams it existed in a dissolved form. There was a positive signi- ficant correlation between chlorophyll a concentration and APA in the photic zone.
In the aphotic zone, APA correlated positively with the colony count of heterotro- phic bacteria, but not with microscopic total bacterial counts.
Key words : alkaline phosphatase activity, dam reservoir, photic and aphotic zones, chlorophyll a, heterotrophic bacteria
* Corresponding Author: Tel: ±81-729-78-3645, Fax: ±81-729-78-3645, E-mail: [email protected]
tions are assumed identical. Water samples were collected monthly in 2000 at all stations from the surface, and from various depth including half of the water depth (1/2D) and 1 m above the bottom (D-1) at Station D1 during summer months in 2001.
APA was measured using p-nitrophenyl phos- phate as a substrate (Reichardt et al., 1967; Obst, 1985). Stock solution (25 mg L
-1) of p-nitrophenyl phosphate was mixed 1 : 6 with sample water.
After incubation for 6 h at 30� C, p-nitrophenol was measured spectrophotometrically at 405 nm.
Samples treated in the same manner but without the substrate were measured as control blanks.
Soluble reactive phosphorus (SRP) of the 0.45
µm membrane filter filtrate was measured by the molybdenum blue colorimetric method (Koroleff, 1983). Chlorophyll a (Chl-a) was measured spect- rophotometrically by grass-fiber filtration and acetone extraction (Lorenzen, 1967). Direct count (DC) of bacterial cells was done by staining the cells with 4
′-6-diamidino-2-phenylindole (25 µg mL
-1, DAPI) followed by filtration with Isopore membrane filters (0.2
µm pore size, Millipore Corp., Bedford, MA), and counting the cells using epifluorescence microscope (Porter and Feig, 1980). Heterotrophic plate counts (HPC) were de- termined by the pour plate method using R2A (Difco, Detroit, MI) (AHPA-AWWA-WPCF,
1000 m
D2 S2
S1 D1
Ishitegawa dam
Tamagawa dam Ishite river
Souja river
Fig. 1. Map of two watersheds and sampling sites. Broken arrows indicate the direction of flow.
Fig. 2. Fluctuation of alkaline phosphatase activity (APA) in dam reservoirs and inflowing streams in 2000 (top) and soluble reactive phosphorus (SRP) in the water column at Sta. D1 in 2001 (bottom). 1/2D m indicates half of the water depth and D-1 m indicates 1 m above the lake bottom.
N
1995). The plates were inverted and incubated at 25� C for 5 d. The plate counts were expressed as colony forming units (CFU) per milliliter. The microbial parameters were indicated in logarith- mic scales.
For the size-fractionation, the sample waters were filtered aseptically through Isopore mem- brane filters of pore sizes of 0.2, 0.4, 1.2, 5, or 10
µm. Each filtrate was subjected to APA, Chl-a, and HPC analyses. Data from each filtrate were subtracted by data from filtrate by the smaller pore size filter.
RESULTS AND DISCUSSION
In the monthly field study in 2000, the APA in the reservoirs indicated a seasonal cycle, with a peak during the summer season; and in the in- flowing streams the activities were relatively invariable all the year round (Fig. 2). The APA fluctuation in the reservoirs located in the two adjacent watersheds showed similar dynamics.
SRP in the epilimnion remained almost constant in both reservoirs (Hirotani et al., 2001).
The mean SRP concentrations at Sta. D1 in 2001 were 1.4, 1.7, 3.6, and 4.3
µg L
-1, at 0.5 m, 10 m, in the intermediate water (1/2D), and at the bottom (D-1), respectively (Fig. 2). The monthly variation in SRP concentration at 0.5 m and 10 m remained constant, whereas there was an in- crease in SRP concentrations in July at deeper layers.
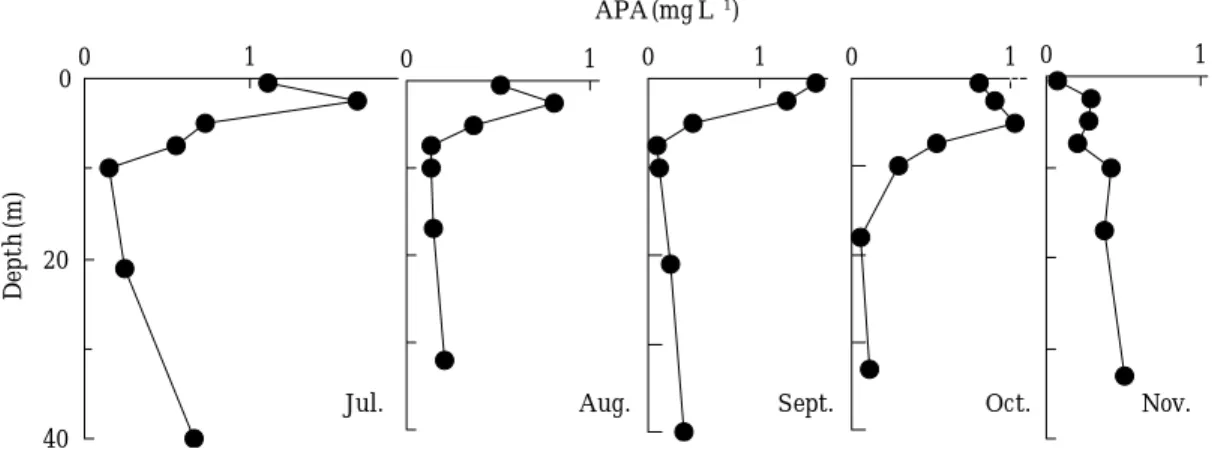
For the vertical profiles of APA in a dam reser- voir (Sta. D1) (Fig. 3), the maximum of the APA
was observed near the surface between 0.5 and 7.5 m-depth and gradually declined downwards
0
20
40
0 1
Depth(m)
0 1 0 1 0 1
0
10
20
30
40
0 1
Jul. Aug. Sept. Oct. Nov.
APA(mgL-1)
Fig. 3. Vertical profiles of alkaline phosphatase activity (APA) at Sta. D1 during July to November, 2001.
Fig. 4. Microbial parameters including alkaline phospha- tase activity (APA) in size fractionated sample from Sta. D1 (top) and Sta. S1 (bottom).
Sta. D1
HPC Chl-a APA
HPC Chl-a APA Sta. S1
HPC(log CFUmL-1) and Chl-a(logµgL-1)HPC(log CFUmL-1) and Chl-a(logµgL-1) APA(mgL-1 )APA(mgL-1)
4
2
0
-2
4
2
0
-2
10
1
0.1
0.01
10
1
0.1
0.01
0.1 1 10
0.1 1 10
Pore size (µm)
Pore size (µm)
with a slight increase near the bottom. In Nove- mber, during the destratification of the water column, the vertical profile of APA became un- clear.
One may think that high APA near the surface would be due to the biological response to the shortage of available phosphorus. However, APA at 10 m depth where SRP was at similar level to that of 0.5 m depth was lower than the surface and APA at 10 m depth was often detected as minimum. Therefore, it is likely that the APA does not indicate phosphorus availability of aqua- tic microorganisms. This agrees with our former studies (Hirotani et al., 2001, 2003, 2004).
In size-fractionated samples, high APA was detected in ¤0.4
µm filtrates (Fig. 4), suggesting that the enzyme is attached to particles (Hirotani et al., 2001). In the streamwater sample, APA evenly distributed for all size-fractions, sugges- ting that the enzyme has a soluble form.
A statistically significant positive correlation (n
= 15, r = 0.54, P-value = 0.036) was found between APA and Chl-a in the photic zone (¤1
µg L
-1Chl- a) (Fig. 5). Thus, in the photic zone APA may be derived from the algae. In the aphotic zone, a significant correlation was found between APA and HPC (n = 18, r = 0.50, P-value = 0.033), but not between DC (n =18, r = -0.12, P-value = 0.63).
Further studies are needed to explain the discre- pancy between these bacterial parameters.
ACKNOWLEDGMENT
The authors thank the students of Ehime Uni- versity who contributed to the study with field and laboratory experiments.
REFERENCES
AHPA-AWWA-WPCF, 1995. Standard methods for the examination of water and wastewater, 19th ed.
Berman, T. 1970. Alkaline phosphatases and phosph- orus availability in lake Kinneret. Limnol. Oceanogr.
15: 663-674.
Chrost, R.J., W. Siuda and G.Z. Halemejko. 1984.
Longterm studies on alkaline phosphatase activity (APA) in a lake with fish-aquaculture in relation to lake eutrophication and phosphorus cycle Arch.
Hydrobiol. 70: 1-32.
Francko, D.A. 1983. Size-fractionation of alkaline phosphatase activity in lake water by membrane filtration. J. Fresh. Wat. Ecol. 2: 305-309.
Hirotani, H., A. Nagagawa, K. Ochi and M. Daijo.
2001. Fluctuation of alkaline phosphatase activity in stream and reservoir water in adjacent water- sheds (in Japanese). J. Japan Soc. Water Environ.
24: 762-765.
Hirotani, H., A. Nagagawa and H. kagawa. 2004.
Vertical profile of alkaline phosphatase activity in the water column of a dam reservoir (in Japane- se). J. Japan Soc. Water Environ. 27: 175-180.
Hirotani, H., K. Ochi and A. Nakagawa. 2003. Fluc- tuation of alkaline phosphatase activity in the headwaters and the factors affecting the activity.
IWA-Asia Pacific Regional Conference (Asian Waterqual 2003), Bangkok, October, Proceedings 408 (3Q5K15:1-5).
Jamet, D., C. Amblard and J. Devaux. 2001. Size- fractionated alkaline phosphatase activity in the hypereutrophic Villerest reservoir (Roanne, Fran- ce). Wat. Environ. Res. 73: 132-141.
Koroleff, F. 1983. Determination of phosphorus, in Fig. 5. Correlation between chlorophyll a (Chl-a) and
alkaline phosphatase activity (APA) when Chl-a were above 1µg L-1 (top, open symbols indicate the outlying data (¤2σ) measured in July and August), and correlation between direct count (open, log counts mL-1) and heterotrophic plate count (closed, log CFU mL-1) and APA in aphotic zones (bottom).
2
1
0 APA(mgL-1)APA(mgL-1 )
0.8
0.4
0
0 10 20
2 4 6 8
Chl-a (µg L-1)
Bacterial counts (log CFUmL-1, log countsmL-1)
“Methods of Seawater Analysis”(Eds. Grasshoff, K., Ehrhardt, M. and Kremling, K.), 2nd revised ed., pp. 125-139, Verlag Chemie, Weinheim.
Lorenzen, C.J. 1967. Determination of chlorophyll and pheopigments: spectrophotometric equations.
Limnol. Oceanogr. 12: 343-346.
Obst, U. 1985. Test instructions for measuring the microbial metabolic activity in water samples.
Fresenius Z. Anal. Chem. 321: 166-168.
Porter, K.G. and Y.S. Feig 1980. The use of DAPI for identifying and counting aquatic microflora. Lim- nol. Oceanogr. 25: 943-948.
Reichardt, W., J. Overbeck and L. Steubing 1967.
Free dissolved enzymes in lake waters. Nature 216: 1345-1347.
Stewart, A.J. and R.G. Wetzel. 1982. Phytoplankton contribution to alkaline phosphatase activity.
Arch. Hydrobiol. 93: 265-271.
Thingstad, T.F., U.L. Zwifel and F. Rossoulzadegan.
1988. P limitation of heterotrophic bacteria and phytoplankton in the northwest Mediterranean.
Limnol. Oceanogr. 43: 88-94.
(Manuscript received 14 July 2004, Revision accepted 24 November 2004)
⁄ ¤
댐 저수지에서
alkaline phosphatase
활성의 수직변화와 미생물 요인들과의 상관관계Hirotani, Hiroshi*, Ayumi Nakagawa1and Hisanori Kagawa1
(Dept. of Arts and Science, Osaka Kyoiku Univ., Kashiwara, Osaka, 582-8582, Japan
1Faculty of Agriculture, Ehime Univ., Matsuyama, Ehime 790-8566, Japan)
2000년 두 댐 저수지와 유입 하천에서 월별 alkaline phosphatase activity (APA)을 측정하였다. 또 한2001년 여름 동안은 한 댐 저수지에서APA의 수직변화와 관련된 요인들을 조사하였다. APA는 여름 동안 저수지 표층에서 상대적으로 높게 나타났으나 심층에서는 거의 변화가 없었다. 그러나 바닥층 바로 윗부분에서는APA의 미미한 증가 관찰되었다. APA 변화와 용존무기인 농도 변화와 는 상관관계가 없었으며, 이 결과 조사 대상 저수지에서 APA는 인 이용성의 상태를 의미하지는 않는 것으로 추정되었다. 시료의size-fractionation 분석 결과, 조사 대상 저수지들에서APA는 0.4 µm보다 큰 입자들에 흡착된 반면, 유입 하천에서는 용존형태로 존재하는 것으로 판단되었다. 저수 지 유광층에서 엽록소-a의 농도와 APA간에 유의한 양의 상관성이 나타났다. 무광층에서 APA는 세균의colony count와 양의 상관성을 나타냈으나 총 세균수와는 상관성이 없었다.