[논 문] 한국재료학회지 https://doi.org/10.3740/MRSK.2019.29.12.753 Korean J. Mater. Res.
Vol. 29, No. 12 (2019)
753
Dielectric Properties of Orthorhombic Dysprosium Manganites
Wei Tian Wang †
Institute of Opto-Electronic Information Science and Technology, Yantai University, Yantai 264005, P.R. China
(Received October 29, 2019 : Revised October 29, 2019 : Accepted December 1, 2019)
Abstract
Orthorhombic dysprosium manganite DyMnO3 with single phase is synthesized using solid-state reaction technique and the crystal structure and dielectric properties as functions of temperature and frequency are investigated. Thermally activated dielectric relaxations are shown in the temperature dependence of the complex permittivity, and the respective peaks are found to be shifted to higher temperatures as the measuring frequency increases. In Arrhenius plots, activation energies of 0.32 and 0.24 eV for the high- and low-temperature relaxations are observed, respectively. Analysis of the relationship between the real and imaginary parts of the permittivity and the frequencies allows us to explain the dielectric behavior of DyMnO3 ceramics by the universal dielectric response model. A separation of the intrinsic grain and grain boundary properties is achieved using an equivalent circuit model. The dielectric responses of this circuit are discerned by impedance spectroscopy study. The determined grain and grain boundary effects in the orthorhombic DyMnO3 ceramics are responsible for the observed high- and low-temperature relaxations in the dielectric properties.Key words
ceramics, dielectric properties, impedance analysis.1.
Introduction
In the last decade, the rare-earth manganites have been studied extensively due to the underlying fundamental physics and their potential applications in advanced technology.
1,2)These materials can structurally be divided into two types of groups depending on the rare-earth ions.
3)The larger rare-earth ions adopt an orthorhombic structure, such as LaMnO
3, EuMnO
3, GdMnO
3manganites, while the smaller ones take a hexagonal structure, such as YMnO
3, YbMnO
3, and HoMnO
3manganites. Generally, dysprosium manganites DyMnO
3(DMO) can be formed in either orthorhombic or hexagonal structures because of the intermediate-sized Dy
3+ion.
4,5)As is known, different structure may have promising effects on the (anti)ferromagnetic or ferroelectronic orders in these materials. Therefore, the synthesis of DMO ceramics and studies on its physical properties are more attractive.
In this paper, we reported the fabrication of single- phased orthorhombic DMO ceramics by using solid-state reaction technique. The complex dielectric properties were investigated as functions of temperature (80 K ≤ T
≤ 360 K) and frequency (100 Hz ≤ f ≤ 100 KHz). Two sets of thermally activated relaxations were observed, and
the dielectric behavior was explained by the universal dielectric response model. The impedance spectroscopic analysis in a broad frequency range (100 Hz-10 MHz) was used to discern the intrinsic DMO grain and grain boundary contributions to the dielectric responses.
2. Experimental
The ceramic polycrystalline DMO samples were fabricated through conventional solid-state reaction process using appropriate amounts of Dy
2O
3and MnO
2. (> 99.99 % purity). The stoichiometric raw materials were mixed and milled, then calcined in the temperature range of 1,000 ~ 1,200
oC for 10 h. The reaction-generated powders were grinded and pressed into high-density pellets for dielectric measurements, which were sintered at a temperature of 1,400
oC for 12 h. Under normal solid state synthesis conditions, DMO ceramics tend to form an orthorhombic perovskite phase. The crystalline structure of the prepared DMO samples were analyzed by x-ray diffraction (XRD) using a Rigaku diffractometer with Cu Kα radiation at 1.54 Ǻ. The measurements of complex dielectric properties were carried out on a QuadTech 1730 LCR Digibridge over a frequency range of 100 Hz ~ 100 kHz. The temperature
†
Corresponding author
E-Mail : [email protected] (W.T. Wang, Yantai Univ.)
© Materials Research Society of Korea, All rights reserved.
This is an Open-Access article distributed under the terms of the Creative Commons Attribution Non-Commercial License (http://creative-
commons.org/licenses/by-nc/3.0) which permits unrestricted non-commercial use, distribution, and reproduction in any medium, provided the
original work is properly cited.
754 Wei Tian Wang
dependence was controlled by a temperature controller (Lakeshore 332). The impedance spectroscopy was examined by using a HP4194A analyzer with signal amplitude of 50 mV. Data were taken in a frequency range of 100 Hz
~ 10 MHz.
3. Results and Discussion
Fig. 1 shows the powder diffraction pattern of DMO ceramics. The vertical lines indicate the allowed Bragg reflections. The location and intensity of all the reflection peaks could be indexed to an orthorhombic structure without any detectable impurity implying the single phase of the prepared sample within the detection limits of the diffractometer. The XRD data were analyzed using Rietveld refinement method, and the calculated lattice parameters of orthorhombic DMO were obtained to be a
= 0.581 nm, b = 0.527 nm and c = 0.739 nm. The lattice parameters are comparable to that of JCPDS card No.
25-0330. The crystallographic structure and the values of lattice parameters of the present DMO are in good agreement with previously reported results.
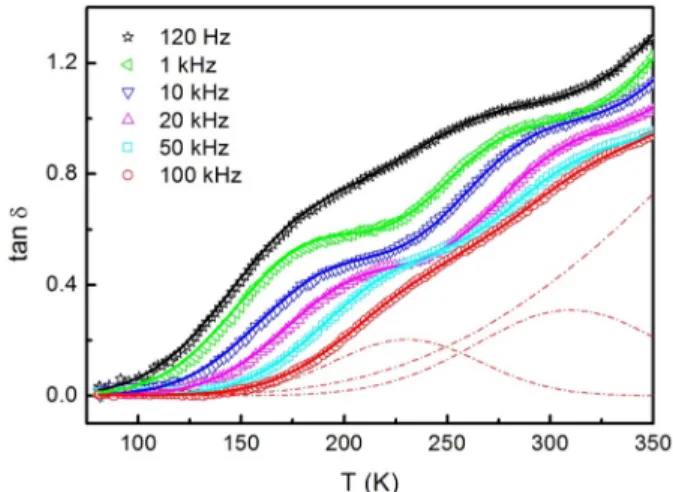
6,7)The temperature dependence of the real part of the complex permittivity and loss tangent tanδ (tanδ is defined as ε′′/ε', where ε' and ε′′ is the real and imaginary parts of the complex permittivity, respectively) for the prepared orthorhombic DMO ceramics at various frequencies are plotted in Figs. 2 and 3. The value of ε ' is weakly temperature and frequency dependent in the low temperature range from 80 to 150 K. With the increasing of T, ε' increases intensively and the characteristic of ε' (T) displays two distinct diffused transitions, which can be seen more clearly at lower frequency. Two corresponding peaks in loss tangent can be seen clearly in Fig. 3. The
peaks of ε' and tanδ shift to higher temperatures as frequency increases indicates that there exist two sets of thermally activated relaxations in DMO ceramic samples, which possibly comes from the grain and grain boundary effects in polycrystalline ceramics. Such behavior is similar to that observed in several other works.
8,9)In Fig. 3, the solid curves through the tanδ data points (open symbols) are the fitting results which were obtained by superimposition of two Gaussian functions and an exponential function. By this processing, the peak positions, T
p, can be extracted accurately. The dashed lines at the lower part are the typical fitting of the experimental data at frequency f = 100 kHz.
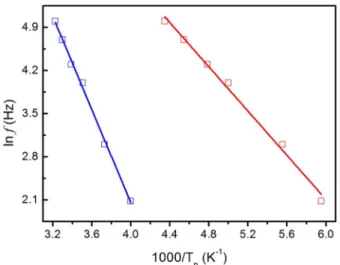
Fig. 4 shows the variation of ln f versus 1000/T
p. This linear relationship can be described by the Arrhenius law
10)0
exp( / E kT ) , τ τ =
Fig. 1. Typical θ-2θ XRD pattern with indices of lattice planes of DMO ceramics. Vertical lines at bottom indicate the allowed Bragg reflections.
Fig. 2. Temperature dependences of ε' of DMO samples measured at different frequencies.
Fig. 3. Temperature dependences of tanδ of DMO samples
measured at different frequencies. The solid curves through the data
points are the fitting results. The two Gaussian peaks and an
exponential background (dashed curves) are the typical fitting of
data at f = 100 kHz.
Dielectric Properties of Orthorhombic Dysprosium Manganites 755
where τ is the relaxation time, E is the activation energy and k is the Boltzmann constant. At peak position of tanδ (T) (T = T
p), the values of most probable relaxation time were defined by ( is the angular frequency), then the linear relationship of ln f versus 1/T
pwas quite clear. The Arrhenius plots in Fig. 4 are typical of Debye-type relaxations, and the changes of slope and intercept suggest the difference of activation energy (E) and the preexponential factor ( ) for the two relaxations. The values of E were determined to be 0.32 eV and 0.24 eV, while factor were 2.04 × 10
−11s and 3.18 × 10
-11s, respectively. The reported E and values are comparable with those of manganite HoMnO
3.
11)The results further show the existing two thermally activated relaxations in DMO ceramics which may be from the grain and grain boundary effects.
It is well known that, over a wide range of frequencies, the dielectric behavior of oxide materials can be described as the universal dielectric response (UDR) model. The complex dielectric constant can be expressed as
10,12)ωε''
= (A/ε)ω
s, and ωε' = ωε
∞+ (A/ε
0)tan(sπ/2)ω
s, where A and s are temperature dependent constants, ε
0is the electric permittivity of free space, ε
∞is the high-frequency value of ε'(ω).
According to the UDR power laws, a straight line with the slope of s should be obtained in the log-log plot of fε’′ versus f at a given temperature, and the same character can be observed in the log-log plot of fε′ versus f pattern. The assumption was well confirmed by the plots in Figs. 5 and 6. The value of ε′′ was determined from the loss tangent (tanδ) data. Quite good straight lines can be observed for logf dependence of logfε′′ [Fig.
5], and logf dependence of logfε′ [Fig. 6]. The obtained values of s were in the range of 0.52-0.61 for the logfε′′
versus logf plots, 0.58-0.79 for the log fε′ versus logf plots, which is consistent with the UDR model.
12)As is known, the exponential increasing background in loss tangent [Fig. 3] implies that the relaxation is associated with the hopping of charged carriers with appropriate relaxation of surrounding ions. Moreover, localized charged carriers hopping between lattice potentials in DMO ceramics give rise to dipolar effects, which is the main contribution to the polarization. These actions agree with the UDR law. With decreasing temperature, the localized carriers are becoming frozen, which reduces the dipolar effects, resulting in some data (T = 100 K) deviating from the straight line in Fig 5.
As is known, the polycrystalline ceramic materials are electrically inhomogeneous, and usually have at least three electrical components contribute to the electrical 1
ωτ = ω = 2 f π
τ
0τ
0τ
0Fig. 5. Log-log plot of fε’′ as function of frequency f at several temperatures. The solid lines are the least-square straight-line fits.
Fig. 6. Log-log plot of fε′ as function of frequency f at several temperatures. The solid lines are the least-square straight-line fits.
Fig. 4. The Arrhenius plots of the frequency dependence of the
tanδ (T) maximum temperature T
pfor DMO samples. Symbols are
the experimental points and solid lines are the least-square straight-
line fits. The red and blue lines respectively stand for the low- and
high-temperature relaxations in Fig. 3.
756 Wei Tian Wang
and dielectric effects.
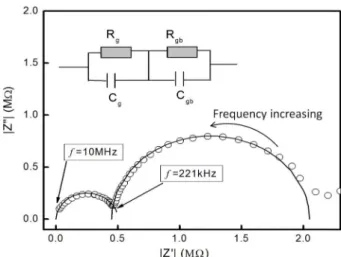
13)These are the intrinsic grains, grain boundaries, and electrodes effects. In order to separate the different dielectric responses, impedance spectroscopy is often used to reliably illustrate different dielectric relaxations with demarking frequencies. Fig. 7 shows the complex impedance |Z''| versus |Z'| spectroscopy of DMO ceramics in a broad frequency range (100 Hz- 10 MHz) at room temperature, where Z
*= Z' − jZ'' is the complex impedance. The complex plots form semicircular arcs, and the fitting results are shown as solid curves.
Each experimental point (open symbol) corresponds to a frequency value.
The most commonly assumed equivalent circuit for these types of materials consisting of a series association of RC components is shown in the inset of Fig. 7. The subscript g denotes grain, and that gb means grain boundary. The impedance Z
*of this ideal equivalent circuit can be defined as
14),
where
and
.
By using the impedance spectroscopy analysis method,
13,14)the observed two arcs from high to low frequencies can be assigned, respectively, to the dielectric response from grains and grain boundaries in DMO ceramics with demarking frequency f = 221 kHz. The dielectric response from electrodes cannot be discerned from Fig. 7, because electrodes effects may be covered by the increasing
exponential background resulting from the electric conductivity at room temperature, and the electrode relaxation frequency is much lower than the bulk grain and grain boundary relaxation frequencies.
4. Conclusion
In summary, we fabricated single-phased orthorhombic DMO polycrystalline ceramics and presented the complex dielectric properties as functions of temperature and frequency. Two thermally activated relaxations in DMO ceramics were observed, and the activation energies were determined to be 0.32 eV and 0.24 eV, respectively. The dielectric properties of DMO ceramics were consistent with the universal dielectric response model. The intrinsic grain and grain boundary effects on the dielectric behaviors of DMO ceramics were discerned with demarking frequency f = 221 kHz by using the impedance spectroscopy analysis.
References
1. T. Lottermoser, T. Lonkai, U. Amann, D. Hohlwein, J.
Ihringer and M. Fiebig, Nature, 430, 541 (2004).
2. N. Hur, S. Park, P. A. Sharma, J. S. Ahn, S. Guha and S. W. Cheong, Nature, 429, 392 (2004).
3. S. Harikrishnan, S. Roßler, C. M. N. Kumar, H. L. Bhat, U. K. Roßler, S. Wirth, F. Steglich and S. Elizabeth, J.
Phys.: Condens. Matter, 21, 096002 (2009).
4. S. Jandl, S. Mansouri, A. A. Mukhin, V. YuIvanov, A.
Balbashov, M. M. Gospodino, V. Nekvasil and M.Orlita, J. Magn. Magn. Mater., 323, 1104 (2011).
5. V. Yu. Ivanov, A. A. Mukhin, A. S. Prokhorov, A. M.
Balbashov and L. D. Iskhakova, Phys. Solid State, 48, 1726 (2006).
6. N. P. Kumar and P. V. Reddy, Mater. Lett., 122, 292 (2014).
7. K. Yadagiri, R. Nithya, N. Shukla and A. T. Satya, J.
Alloys Compd., 695, 2959 (2017).
8. Z. Abdelkafi, N. Abdelmoula, H. Khemakhem, O. Bidault and M. Maglionea, J. Appl. Phys., 100, 114111 (2006).
9. C. C. Wang, Y. M. Cui and L. W. Zhang, Appl. Phys.
Lett., 90, 012904 (2007).
10. A. K. Jonscher, Dielectric Relaxation in Solids, 1st ed., p.103, Chelsea Dielectrics Press, London (1983).
11. W. Wang, B. Xu, P. Gao, W. Zhang and Y. Sun, Solid State Commun., 177, 7 (2014).
12. A. K. Jonscher, Nature, 267, 673 (1977).
13. D. C. Sinclair, A. R. West, J. Mater. Sci., 29, 6061 (1994).
14. D. C. Sinclair, A. R. West, J. Appl. Phys., 66, 3850 (1989).
< 저자소개 >
Wei Tian Wang
Professor of physics in the Institute of Opto-Electronic Information Science and Technology, Yantai University, China.
*
1 1
1/
g g1/
gb gbZ Z jZ
R i C ω R i C ω
′ ′′
= − = +
+ +
2 2
1 ( ) 1 ( )
g gb
g g gb gb
R R
Z ′ = ω R C + ω R C
+ +
2 2
2 2
1 ( ) 1 ( )
g g gb gb
g g gb gb