1)
Received 13 October 2020, revised 20 November 2020, accepted 23 November 2020.
*
Corresponding author: Young-Ran Kim(E-mail : [email protected])
∙김영란 (선임연구위원) / Youngran Kim (Senior Research Fellow) 서울특별시 마포구 매봉산로 37, 산학협력연구센터 8층, 03909 37, Maebongsan-ro, Mapo-gu, Seoul 03909, Republic of Korea
∙황성환 (연구위원) / Seonghwan Hwang (Research Fellow) 서울특별시 마포구 매봉산로 37, 산학협력연구센터 8층, 03909 37, Maebongsan-ro, Mapo-gu, Seoul 03909, Republic of Korea
∙이연선 (전임연구원) / Yunsun Lee (Research Specialist) 서울특별시 마포구 매봉산로 37, 산학협력연구센터 8층, 03909 37, Maebongsan-ro, Mapo-gu, Seoul 03909, Republic of Korea
This is an Open-Access article distributed under the terms of the Creative Commons Attribution Non-Commercial License (http://creativecommons.org/licenses/by-nc/3.0) which permits unrestricted non-commercial use, distribution, and reproduction in any medium, provided the original work is properly cited.
도시특성 요인의 다중선형회귀 분석을 이용한 물순환상태추정모델 개발
Development of water circulation status estimation model by using multiple linear regression analysis of urban characteristic factors
김영란*・황성환・이연선
Youngran Kim
*・Seonghwan Hwang・Yunsun Lee 서울기술연구원 기술개발본부 생활환경연구실
Division of Living and Built Environment Research, Technology Development Headquarter, Seoul Institute Technology
ABSTRACT
Identifying the water circulation status is one of the indispensable processes for watershed management in an urban
area. Recently, various water circulation models have been developed to simulate the water circulation, but it takes a lot
of time and cost to make a water circulation model that could adapt the characteristics of the watershed. This paper
aims to develop a water circulation state estimation model that could easily calculate the status of water circulation in
an urban watershed by using multiple linear regression analysis. The study watershed is a watershed in Seoul that
applied the impermeable area ratio in 1962 and 2000. And, It was divided into 73 watersheds in order to consider
changes in water circulation status according to the urban characteristic factors. The input data of the SHER(Similar
Hydrologic Element Response) model, a water circulation model, were used as data for the urban characteristic factors
of each watershed. A total of seven factors were considered as urban characteristic factors. Those factors included
annual precipitation, watershed area, average land-surface slope, impervious surface ratio, coefficient of saturated
permeability, hydraulic gradient of groundwater surface, and length of contact line with downstream block. With
significance probabilities (or p-values) of 0.05 and below, all five models showed significant results in estimating the
water circulation status such as the surface runoff rate and the evapotranspiration rate. The model that was applied all
1. 서 론
도시에서 인구가 증가하고 삶이 질이 높아짐에 따 라 토지이용이 변하고 이에 따라 물순환에 영향을 미 치는 환경여건이 달라지고 있다. 도시의 확대와 개발 로 투수면적은 증가하고, 이로 인해 강우의 토양침투 량과 증발산량이 감소되고, 지표면유출수는 증가되는 등 물순환이 변화되어 도시건조, 열섬화와 폭염 빈발, 합류식 하수관거 월류수(Combined Sewer Overflows, CSOs)증가에 의한 하천수질 악화, 홍수량 증가 등의 도시문제가 심화되고 있다.
우리나라에서는 2005년 「서울특별시 빗물관리 기본 조례」 제정을 계기로 도시의 물순환 개선에 관심을 가지고 지자체별로 물순환 관리사업을 시행해 오고 있다. 도시유역의 물순환 상태를 파악하는 것은 유역 관리를 위해서 중요하다. 그러나 도시유역의 물순환 을 직접 모니터링하는 것은 어려운 실정으로서 이러 한 상황을 고려할 때 물순환모형은 매우 유용하게 사 용되고 있다 (Foter et al., 2005).
도시유역의 기후, 지형, 토양 등 다양한 인자가 물 순환에 미치는 영향을 모의하는 것은 모델 평가에서 중요하다. 최근에는 기후변화로 인한 전 지구적인 환 경문제에 대비하기 위하여 다양한 영향인자를 적용한 물수지 모형을 개발하여 물순환 상태를 모의하고 있 다. 국내에서 물수지 모형을 적용한 사례는 서울시 물 순환 회복 기본계획과 서울시 빗물관리기본계획에서 SHER(Similar Hydrologic Element Response)모형을 이 용하여 서울시의 물순환을 모의하였으며, 국내 현황 에 적용할 수 있도록 개발한 유역 물순환 해석 모형 인 CAT(Catchment hydrologic cycle Assessment Tool)를 이용한 사례가 있다 (Seoul, 2003, 2013; Kim et al., 2012). 청계천의 하천유역을 대상으로 SWAT 모형을 이용하여 물순환을 모의한 바가 있고, 도림천 유역을 대상으로 분포형 모형인 WEP(Water and Energy
transfer Processes) 모형을 적용하여 모의한 바가 있다 (Chang et al., 2004; Lee et al., 2005).
그러나 물순환모형은 도시유역의 지역특성을 고려 하여 구축하는데 많은 시간과 비용이 소요되는 문제 를 가지고 있다. 또한 도시유역 특성인자의 변화뿐만 아니라 소유역 간의 관계를 고려하여 물순환 변화를 모의하므로 물순환 모의값 변화에 대하여 명확하게 설명하기 어려운 상황이 발생할 수도 있다.
본 연구에서는 도시 물순환 현황을 간편하게 추정할 수 있는 다중선형회귀분석에 의한 물순환 상태 추정 모 델을 개발하였다. 다중선형회귀 모델은 미계측 유역에 대하여 적은 시간과 비용으로 신뢰할 수 있는 결과를 추정할 수 있고 , 대상유역의 도시특성 요인에 따른 물순 환상태를 현장에서도 간단하게 산정할 수 있다. 본 연구 에서 다중선형회귀분석의 독립변수는 물순환에 영향을 주는 기상적 요인과 불투수면적률(Impervious surface ratio), 유역경사(Surface slope) 등의 지형적 요인들이며, 종속변수는 물순환 상태를 나타내는 지표로서 표면유 출율 , 증발산율이다. 이후 물순환에 영향을 주는 기상적 요인과 지형적 요인을 도시특성 요인으로 통합하여 제 시하고자 한다. 종속변수의 자료는 서울시 물순환을 분 석하였던 SHER 모형의 모의결과를 적용하였으며, 독립 변수의 자료는 기상청 서울관측소의 30년 이동평균 강 수량과 SHER 모형의 입력자료를 이용하였다. 도시특성 요인들을 고려한 물순환 상태추정 모델들 중에서 오차 가 적고 상관성이 높은 최적 모델을 도출하고자 모델들 추정값의 정확도를 분석하였다.
2. 연구방법
2.1 대상유역 및 물순환모형 선정
연구대상 유역은 한강의 수위에 크게 영향을 받는 한 강유역을 제외한 서울시 경계내의 중랑천 , 탄천, 고덕 seven urban characteristics factors, can calculate the most similar results such as the existing water circulation model.
The water circulation estimation model developed in this study is not only useful to simply estimate the water circulation status of ungauged watersheds but can also provide data for parameter calibration and validation.
Key words: Water circulation, Multiple linear regression analysis, Urban characteristic factor, Water circulation index, SHER model
주제어: 물순환, 다중선형회귀 분석, 도시특성 요인, 물순환 지표, SHER 모형
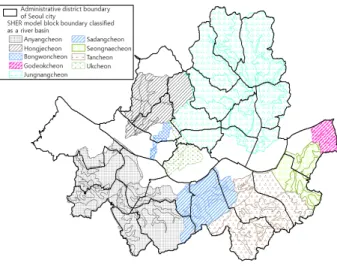
천, 성내천, 안양천, 사당천, 봉원천 및 욱천의 9개 유역 이다. 도시특성 요인 변화에 따른 물순환 상태 변화를 고려할 수 있는 충분한 자료를 확보하기 위하여 Fig. l과 같이 9개 하천유역의 73개 소유역에 대한 도시특성 요인 에 따른 물순환 상태 자료를 정리하였다.
현재 우리나라에서 도시유역의 물순환 상태는 물순 환모형을 이용하여 산정하고 있으며 , 물순환모형으로는 SHER 모형, CAT 모형, SWAT 모형 및 WEP 모형 등을 이용하고 있다.
Fig. 1. Location map of target watersheds.
본 연구에서 2007년 빗물관리 기본계획에서 서울시 물순환 모의에 사용한 SHER 모형을 이용하여 서울시 73개 소유역에 대한 물순환 상태를 모의하였다.
2.2 다중선형회귀분석 대상자료
다중선형회귀분석은 다양한 요인에 의하여 발생하는 결과를 설명하는 분석 방법으로써 , 한강 유역의 특성에 대한 연간 유출률에 관하여 분석한 사례가 있고 계측한 기상자료를 기반으로 저수지의 월별 저수율 추정에도 활용되고 있다 (Lee et al., 2018a, b). 또한 고립지역 연평 균 일교통량 추정, LiDAR(Light Detection and Ranging) 필터링, 교차로 사망사고 예측, 미세먼지 농도 추정 등 과 같이 폭넓게 사용하고 있다 (Lee, 2004; Choi et al., 2011; Kim and Oh, 2015; Choo et al., 2017).
본 연구에서는 물순환상태를 추정할 모델 개발에서 도시특성 요인의 상수를 산정하기 위하여 이용하였 다. 물순환상태추정모델의 상수를 결정하기 위하여 이용한 독립변수와 종속변수를 정리하면 다음과 같다.
2.2.1 독립변수 도시특성 요인 구성
다중선형회귀분석을 위해서는 도시유역의 물순환 변화에 영향을 미치는 요인인 도시특성 요인분석을 Table 1. Input data of SHER model and influencing urban characteristic factors
Classification Input data of SHER model water circulation status estimation model urban characteristic factor unit Weather • Hourly rainfall
a)• Potential evapotranspiration
• Annual precipitation
• (Unapplied)
• mm/yr
• - Watershed
specifications
• Watershed area
b)• Average land-surface slope
b)• Watershed area
• Surface slope
• km
2• m/m Impervious
watershed
• Impervious area
c)• Storage capacity of impervious surface
• Impervious surface ratio
• (Unapplied)
• m/m
• - Pervious
watershed
• Topsoil thickness
• Storage capacity of pervious surface
• Area of solid bare land and bare land
b)• (Unapplied)
• (Unapplied)
• Saturated permeability coefficient
• -
• -
• cm/sec
Groundwater
• Riverbed elevation
• Riverbed area
• Aquifer top level
• Aquifer bottom level
• Hydraulic gradient of groundwater surface
b)• Length of contact line with downstream
b)• (Unapplied)
• (Unapplied)
• (Unapplied)
• (Unapplied)
• Hydraulic gradient of groundwater
• Contact line length
• -
• -
• -
• -
• m/m
• m
a)
30-year moving average of annual precipitation at the Seoul Station of the Korea Meteorological Administration(1961-2019)
b)
SHER model Input data(Seoul, 2003) was made by Seoul Metropolitan Internal Digital Topographic Map Data
c)
SHER model Input data(Seoul, 2003) was made by “Seoul metropolitan biotop map”(Seoul, 2000)
선행하여야 한다. 그러나 특정 도시특성 요인을 입력 자료로 사용하는 물순환모형의 모의결과를 다중선형 회귀분석 자료로 이용하였기 때문에 별도의 요인분석 을 실시하지 않고, 기존 서울시 물순환모형으로 적용 한 SHER 모형의 입력자료를 도시특성 요인으로 적용 하였다.
SHER 모형의 입력자료로부터 도출한 물순환에 영향 을 미치는 도시특성 요인을 정리하면 Table 1과 같다.
SHER 모형의 입력자료 중에서 불투수면적은 불투 수면적률로 산정하여 적용하였다. 또한 투수유역에서 투수계수를 사용하여 나지 및 단단한 나지 유역을 구 분하고 나지면적과 단단한 나지 면적의 비율을 고려 한 포화투수계수의(Saturated permeability coefficient) 면적가중 평균값을 도시특성 요인으로 적용하였다.
도시특성 요인 중에서 강우량 자료는 30년 이동평균 연강수량(Annual precipitation) 자료를 이용하였다. 도 시특성 요인들 중에서 서울시 수치지형도, 생태면적 지도 및 계측한 강우자료와 같이 실측자료를 이용한 7개 요인을 적용하였다.
2.2.2 종속변수 물순환 상태지표
서울시 빗물관리기본계획에서 물순환 상태는 지표 면유출량, 증발산량, 침투량의 3개의 지표로 나타내었 다 (Seoul, 2013). 물순환 상태지표는 물순환 변화의 대표값인 지표면유출량과 증발산량을 연강수량으로 지표화한 식 (1)과 식(2)와 같다. SHER 모형의 지표면 유출량 및 증발산량의 30년 이동평균값을 물순환 상 태지표로 이용하였으며, 침투율은 식 (3)과 같이 지표 면유출율 및 증발산율로 산정할 수 있기 때문에 추정 할 물순환 상태에서 제외하였다.
Index
surf Q
surf R
year× (1)
Index
eva Q
eva R
year× (2) 여기서,
Index
surf: 지표면유출율(%) Index
eva: 증발산율(%)
Q
surf: 30년 이동평균 지표면유출량 (mm/yr) Q
eva: 30년 이동평균 증발산량 (mm/yr) R
year: 30년 이동평균 연강수량 (mm/yr)
Index
inf Index
surf Index
eva(3) 여기서, Index
inf: 침투율(%)
3. 결 과
3.1 물순환 상태지표 및 도시특성 요인의 다변량 산점도
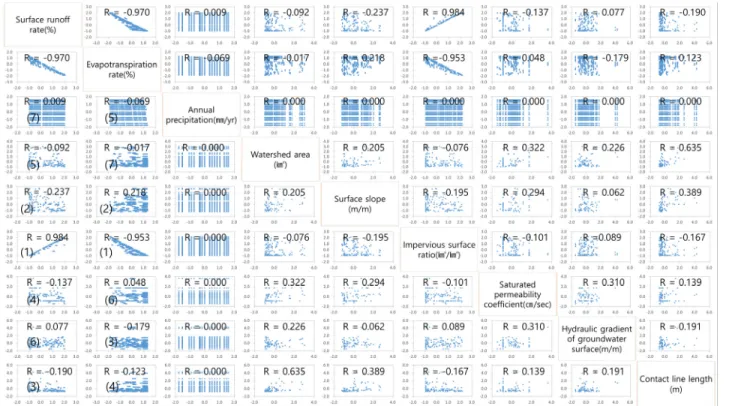
물순환 지표인 표면유출율 , 증발산율과 도시특성 요인인 연평균강수량을 포함한 7개 요인에 대한 다변 량 산점도는 Fig. 2와 같다.
표면유출율과 증발산율의 Pearson 상관계수(R)는 -0.970로 높은 상관관계를 나타낸다. 도시특성 요인들 중에서 표면유출율 또는 증발산율과 0.5 이상의 큰 상 관계수를 나타내는 도시특성 요인은 불투수면적률 뿐 이며, 상관계수가 각각 0.984, -0.953이다. 표면유출률 과 상관관계가 큰 도시특성 요인 순서는 불투수면적 률, 지표면평균경사, 하류블록 선형 접선 연장(Contact line length), 포화투수계수, 유역면적(Watershed area), 지하수면 동수경사(Hydraulic gradient of groundwater), 연강수량이며, 증발산율과 상관관계가 큰 도시특성 요인의 순서는 불투수면적률, 지표면평균경사, 지하수 면 동수경사, 하류블록 선형 접선 연장, 연강수량, 포 화투수계수, 유역면적이다.
3.2 물순환상태추정모델 개발 결과
물순환 상태지표 및 도시특성 요인의 다변량 산점 도 분석결과는 지표 및 요인의 1:1 상관관계를 검토한 결과이다. 도시특성 요인의 추가 또는 제외에 따른 물 순환 상태지표의 변화는 산점도 분석 만을 이용하여 추정하기 어렵다. 비록 물순환 상태지표와 상관성이 낮 은 도시특성 요인일지라도 추가시에 다중선형회귀분 석에서 오차를 줄일 수 있는 요인이 될 수 있다. 이후 다변량회귀분석의 결과인 물순환 상태지표를 산정할 수 있는 다중선형회귀식을 물순환상태추정모델(Water circulation estimating model)로 제시하고자 한다.
도시특성 요인이 7개인 것을 고려할 때, 물순환상
태추정모델의 오차를 최소화하기 위해서는 128(
)
개 모델을 분석하여야 한다. 모든 물순환상태추정모
델을 분석하기 어려우므로 Table 2와 같이 5개 물순환
상태추정모델을 집중적으로 분석하였다. 물순환 상태
지표와 상관성이 뚜렷한 불투수면적률과 기후변화를
고려할 수 있는 연강수량을 기본 도시특성 요인으로 적용하였고, 상관관계가 뚜렷한 요인을 순서대로 추 가하여 5개 모델을 Table 2와 같이 구축하였다.
3.2.1 표면유출율 추정모델
표면유출율을 산정하는 5개 모델 모두에서 유의확 률을 나타내는 p-값이 0.05 이하로 나타났다. 유의확 률이 0.05 이하인 것은 “도시특성 요인이 물순환 지표
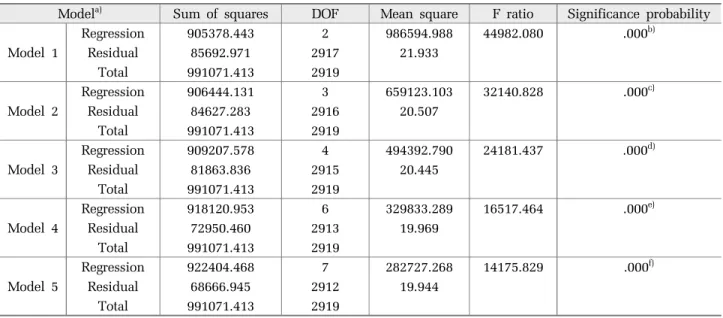
에 영향을 미치지 않는다”는 귀무가설을 기각하는 것 을 의미하므로 5개 모델 모두 물순환 표면유출율 산 정에 이용할 수 있다. 5개 모델의 변수에 대한 분산분 석 결과는 Table 3과 같다.
다중선형회귀분석 결과로서 표면유출율 추정할 수 있는 물순환상태추정모델의 도시특성 요인 상수값 산 정결과는 Table 4와 같다. SHER 모형의 표면유출율 모의값과 5개 물순환추정모델의 추정값 편차를 비교 Fig. 2. Scatterplot of water circulation index and urban characteristic factors.
Note) The numbers in parentheses are in the order of high correlation.
Table 2. Classification of models according to urban characteristic factors
Classification Model 1 Model 2 Model 3 Model 4 Model 5
Input variables of each model
- Impervious surface
ratio - Impervious surface
ratio - Impervious surface
ratio - Impervious surface
ratio - Impervious surface ratio
- Annual
precipitation - Annual
precipitation - Annual
precipitation - Annual
precipitation - Annual precipitation - Surface slope - Surface slope - Surface slope - Surface slope - Contact line length - Contact line length - Contact line length
- Saturated
permeability coefficient
- Saturated permeability coefficient
- Hydraulic gradient
of groundwater surface
- Hydraulic gradient of groundwater surface
- Watershed area
한 결과는 Fig. 3과 같다.
기존 SHER 모형 모의값과 물순환추정모델들 추정 값 간의 상관관계를 검토한 결과, 5개 물순환추정모델 들 모두 결정계수( R
)가 0.9686에서 0.9715로 뚜렷한 상관성을 나타냈다. Model 1에서 Model 5까지 순서대
로 도시특성 요인들을 추가함에 따라서 RMSE(Root Mean Square Error)는 4.56%에서 4.50%까지 지속적으 로 감소하였다. 특히 Model 3과 Model 4의 RMSE는 각각 4.56%, 4.50%으로서 상대적으로 크게 감소하는 것으로 나타났다 . RMSE는 측정값과 회귀값의 편차를 Table 3. ANOVA(Analysis of Variance) results of each model for calculating surface runoff rates
Model
a)Sum of squares DOF Mean square F ratio Significance probability
Model 1
Regression 905378.443 2 986594.988 44982.080 .000
b)Residual 85692.971 2917 21.933
Total 991071.413 2919
Model 2
Regression 906444.131 3 659123.103 32140.828 .000
c)Residual 84627.283 2916 20.507
Total 991071.413 2919
Model 3
Regression 909207.578 4 494392.790 24181.437 .000
d)Residual 81863.836 2915 20.445
Total 991071.413 2919
Model 4
Regression 918120.953 6 329833.289 16517.464 .000
e)Residual 72950.460 2913 19.969
Total 991071.413 2919
Model 5
Regression 922404.468 7 282727.268 14175.829 .000
f)Residual 68666.945 2912 19.944
Total 991071.413 2919
a)
Dependent variable: Surface runoff rate
b)
Predictor: (constant), annual precipitation, impervious surface ratio
c)
Predictor: (constant), annual precipitation, impervious surface ratio, Surface slope
d)
Predictor: (constant), annual precipitation, impervious surface ratio, Surface slope, contact line length
e)
Predictor: (constant), annual precipitation, impervious surface ratio, Surface slope, contact line length, hydraulic gradient of groundwater, saturated permeability coefficient
f)
Predictor: (constant), annual precipitation, impervious surface ratio, Surface slope, contact line length, hydraulic gradient of groundwater, saturated permeability coefficient, watershed area
Fig. 3. Analysis result of errors between the SHER model and the estimation models of Surface runoff rate.
나타내는 지표로써 RMSE가 적다는 것은 기존 모형 결과와 유사하다는 것을 의미한다.
7개 도시특성 요인들을 모두 적용한 Model 5가 도 시특성 요인 중 불투수면적율과 연강수량을 적용한 Model 1보다 RMSE가 0.06% 작은 것으로 나타났다.
표면유출율과 상관성이 낮은 도시특성 요인일지라도 모델의 정확도 개선에 기여할 수 있는 것으로 나타났 다. 편차가 최소인 표면유출율 추정모델인 Model 5의 회귀식을 정리한 결과는 식 (4)와 같다.
Index
surf′ Constant a
x
a
x
a
x
(4) a
x
a
x
a
x
a
x
x
x
×
x
x
x
여기서, Index
surf′ : 물순환상태추정모델의 지표면유 출율(%), a
i: 다중선형회귀분석 결과 계수값, x
i: 도시 특성 요인, i : 도시특성 요인 구분(1: 불투수면적률, 2: 연평균강수량, 3: 지표면경사, 4: 하류블록 접선연장, 5: 포화투수계수, 6: 지하수동수경사, 7: 유역면적) 3.2.2 증발산율 추정모델
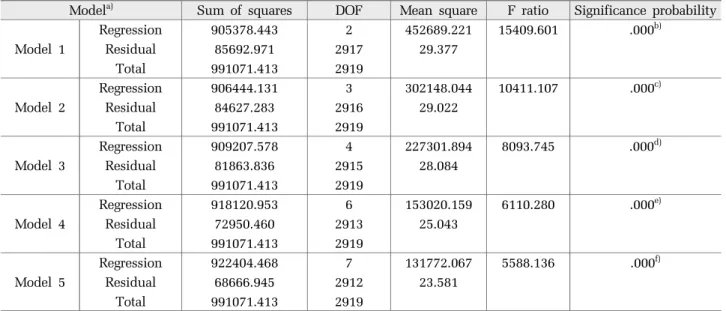
증발산율을 산정하는 5개 물순환상태추정모델의 유 의확률은 모두 0.00으로써 95% 수준의 유의확률에서 귀무가설을 기각함으로써, 7개 도시특성 요인을 이용 한 물순환상태추정모델은 유의할 수준의 증발산율을 추정할 수 있는 것으로 나타났다. 증발산율을 추정하 는 5개 모델의 분산분석 결과는 Table 5와 같다.
증발산율을 추정할 수 있는 물순환상태추정모델 도 시특성 요인의 상수값 산정을 위한 다중선형회귀분석 Table 4. Results of multiple linear regression analysis for calculating surface runoff rates
Model Coefficient t-statistic Significance probability
95.0% confidence interval for coefficient
Lower limit Upper limit
Model 1
Constant -5.010 -2.118 0.034 -9.647 -0.372
Impervious surface ratio 92.351 299.928 0.000 91.747 92.955
Annual precipitation 0.004 2.662 0.008 0.001 0.008
Model 2
Constant -3.192 -1.393 0.164 -7.683 1.299
Impervious surface ratio 91.505 301.425 0.000 90.910 92.100
Annual precipitation 0.004 2.753 0.006 0.001 0.008
Surface slope -27.084 -14.276 0.000 -30.804 -23.364
Model 3
Constant -3.059 -1.337 0.181 -7.544 1.426
Impervious surface ratio 91.409 300.025 0.000 90.811 92.006
Annual precipitation 0.004 2.757 0.006 0.001 0.008
Surface slope -24.725 -12.135 0.000 -28.721 -20.730
Contact line length -3.545E-05 -3.142 0.002 0.000 0.000
Model 4
Constant -1.870 -0.825 0.409 -6.313 2.574
Impervious surface ratio 91.241 299.564 0.000 90.644 91.838
Annual precipitation 0.004 2.790 0.005 0.001 0.008
Surface slope -20.077 -9.611 0.000 -24.173 -15.981
Contact line length -3.614E-05 -3.177 0.002 0.000 0.000
Saturated permeability coefficient -9548.999 -8.344 0.000 -11792.830 -7305.168 Hydraulic gradient of groundwater 25.020 1.308 0.191 -12.497 62.537
Model 5
Constant -1.876 -0.828 0.408 -6.317 2.565
Impervious surface ratio 91.213 299.375 0.000 90.615 91.810
Annual precipitation 0.004 2.792 0.005 0.001 0.008
Surface slope -19.437 -9.216 0.000 -23.573 -15.302
Contact line length -5.554E-05 -3.818 0.000 0.000 0.000
Saturated permeability coefficient -10350.578 -8.600 0.000 -12710.488 -7990.668 Hydraulic gradient of groundwater 23.654 1.236 0.216 -13.860 61.169
Watershed area 0.039 2.138 0.033 0.003 0.075
결과는 Table 6과 같다. 또한 SHER 모형 증발산율 모 의값과 물순환상태추정모델들 추정값의 편차를 비교 한 결과는 Fig. 4에 나타냈다.
5개 물순환상태추정모델의 추정값 모두가 SHER 모 형 모의값과 도시적으로 뚜렷한 상관관계를 보였으
며, 결정계수( R
)도 0.9135에서 0.9307로 높았다. 비 록, 물순환상태추정모델에서 고려하는 모델의 유효숫 자로 인하여 Model 3의 RMSE가 5.57%로 일시적으로 증가하지만, 도시특성 요인을 점진적으로 추가한 Model 1에서 Model 5까지 물순환상태추정모델의 Table 5. ANOVA results of each model for calculating evapotranspiration rates
Model
a)Sum of squares DOF Mean square F ratio Significance probability
Model 1
Regression 905378.443 2 452689.221 15409.601 .000
b)Residual 85692.971 2917 29.377
Total 991071.413 2919
Model 2
Regression 906444.131 3 302148.044 10411.107 .000
c)Residual 84627.283 2916 29.022
Total 991071.413 2919
Model 3
Regression 909207.578 4 227301.894 8093.745 .000
d)Residual 81863.836 2915 28.084
Total 991071.413 2919
Model 4
Regression 918120.953 6 153020.159 6110.280 .000
e)Residual 72950.460 2913 25.043
Total 991071.413 2919
Model 5
Regression 922404.468 7 131772.067 5588.136 .000
f)Residual 68666.945 2912 23.581
Total 991071.413 2919
a)
Dependent variable: Surface runoff rate
b)
Predictor: (constant), annual precipitation, impervious surface ratio
c)
Predictor: (constant), annual precipitation, impervious surface ratio, Surface slope
d)
Predictor: (constant), annual precipitation, impervious surface ratio, Surface slope, contact line length
e)
Predictor: (constant), annual precipitation, impervious surface ratio, Surface slope, contact line length, hydraulic gradient of groundwater, saturated permeability coefficient
f)