Korean Journal of Remote Sensing, Vol.37, No.3, 2021, pp.515~530
https://doi.org/10.7780/kjrs.2021.37.3.12 ISSN 1225-6161 ( Print )
ISSN 2287-9307 (Online)
Article
선행 강우를 고려한 Sentinel-1 SAR 위성영상과 다중선형회귀모형을 활용한 토양수분 산정
정지훈 1)·손무빈 2)·이용관 3)†·김성준 4)
Estimation of Soil Moisture Using Sentinel-1 SAR Images and Multiple Linear Regression Model Considering Antecedent Precipitations
Jeehun Chung
1)·Moobeen Son
2)·Yonggwan Lee
3)†Seongjoon Kim
4)Abstract: This study is to estimate soil moisture (SM) using Sentinel-1A/B C-band SAR (synthetic aperture radar) images and Multiple Linear Regression Model(MLRM) in the Yongdam-Dam watershed of South Korea. Both the Sentinel-1A and -1B images (6 days interval and 10 m resolution) were collected for 5 years from 2015 to 2019. The geometric, radiometric, and noise corrections were performed using the SNAP (SentiNel Application Platform) software and converted to backscattering coefficient of VV and VH polarization. The in-situ SM data measured at 6 locations using TDR were used to validate the estimated SM results. The 5 days antecedent precipitation data were also collected to overcome the estimation difficulty for the vegetated area not reaching the ground. The MLRM modeling was performed using yearly data and seasonal data set, and correlation analysis was performed according to the number of the independent variable. The estimated SM was verified with observed SM using the coefficient of determination (R
2) and the root mean square error (RMSE). As a result of SM modeling using only BSC in the grass area, R
2was 0.13 and RMSE was 4.83%. When 5 days of antecedent precipitation data was used, R
2was 0.37 and RMSE was 4.11%. With the use of dry days and seasonal regression equation to reflect the decrease pattern and seasonal variability of SM, the correlation increased significantly with R
2of 0.69 and RMSE of 2.88%.
Key Words: Backscattering Coefficient, Multiple Linear Regression Model, Sentinel-1, Synthetic Aperture Radar, Soil Moisture
요약 : 본 연구에서는Sentinel-1 C-band SAR(Synthetic Aperture Radar) 위성영상을 기반으로 다중선형회귀모형 을 활용하여 금강 유역 상류에 위치한 용담댐 유역의 토양수분을 산정하였다. 10 m 공간 해상도의 Sentinel-1A/B
Received May 25, 2021; Revised June 14, 2021; Accepted June 22, 2021; Published online June 24, 2021
1)
건국대학교 대학원 사회환경플랜트공학과 박사과정 (PhD Student, Graduate School of Civil, Environmental and Plant Engineering, Konkuk University)
2)
건국대학교 대학원 사회환경플랜트공학과 석사과정 (Master Student, Graduate School of Civil, Environmental and Plant Engineering, Konkuk University)
3)
건국대학교 대학원 사회환경플랜트공학과 박사수료 (PhD Candidate, Graduate School of Civil, Environmental and Plant Engineering, Konkuk University)
4)
건국대학교 공과대학 사회환경공학부 정교수 (Professor, Department of Civil and Environmental Engineering, Konkuk University)
†Corresponding Author: Yonggwan Lee ([email protected])
This is an Open-Access article distributed under the terms of the Creative Commons Attribution Non-Commercial License
(http://creativecommons.org/licenses/by-nc/3.0) which permits unrestricted non-commercial use, distribution, and reproduction in
any medium, provided the original work is properly cited.
1. 서론
토양수분은 현열 및 잠열의 비율 배분을 통해 전 지 구의 에너지 평형에 영향을 주며 , 물의 순환과정에서 강우유출과 침투량을 결정하는 중요도 높은 수문 인자 이다 (Falloon et al., 2011; Lee et al., 2017; Zhang and Zhou, 2016). 토양 내 수분함량의 파악은 일반적으로 Flux tower, TDR(Time Domain Reflectometry) 등의 장비를 이 용해 지상에서 측정되나, 인공위성 원격탐사기술이 토 양수분을 측정하는데 큰 잠재력을 보임에 따라 이를 활 용한 연구가 활발히 수행되고 있다 .
원격탐사 장비를 활용한 토양수분 추정은 인공위성 의 광학 (Optical) 및 열(Thermal)영상에서 얻어지는 정규 식생지수 (Normalized Difference Vegetation Index, NDVI), 지표면온도 (Land Surface Temperature, LST) 등의 인자와 토양수분 간 상관관계를 활용해 추정된다 (Gillies and Carlson, 1995; Jang et al., 2019; Jung et al., 2020; Lee et al., 2019; Sandholt et al., 2002). 또한, 수동(Passive) 및 능동 (Active)형 마이크로파(Microwave) 위성센서를 활용한 연구도 다수 진행되었다(Dubois and Engman, 1995;
Entekhabi et al., 2010; Kerr et al., 2010; Ulaby et al., 1978;
Ulaby et al., 1979; Zribi et al., 2005; Zribi and Dechambre, 2003). 마이크로파를 이용한 방법은 마이크로파와 토양 유전상수 (Dielectric constant) 사이의 관계를 기반으로 하 며 (Ulaby et al., 1986), 습윤한 토양에서 건조 토양보다 유 전상수가 높게 나타나 마이크로파의 세기가 증가하는 특성을 이용해 토양수분을 추정한다 (Dubois et al., 1995).
능동형 마이크로파 센서인 SAR(Synthetic Aperture Radar)는 기상 및 주야 관계없이 지표의 촬영이 가능하
고 고해상도인 장점을 가져 다양한 응용 분야에서 큰 관 심을 받고 있다 (Chung et al., 2020). SAR를 이용한 토양수 분 산출 모형은 크게 경험적 모형 , 물리적 모형, 통계적 모형으로 나눌 수 있다 . 경험적 모형을 활용한 연구는 (Baghdadi et al., 2002; Baghdadi et al., 2016; Holah et al., 2005; Mathieu et al., 2003; Wickel et al., 2001) 토양수분과 위성센서 간 신호의 물리적 관계를 고려하지 않은 경험 적 관계를 이용하며 , 해당 연구지역에 대해서만 적용 가 능하다 . 물리적 모형은 Fung et al. (1992)가 제시한 IEM (Integral Equation Model)이 대표적이며 이를 개선한 IEM_B, AIEM(Advanced Integral Equation Model)이 개 발된 바 있다 (Baghdadi et al., 2002; Baghdadi et al., 2015;
Chen et al., 2003). 일반적으로 각 모형은 표면 거칠기 (Surface roughness), 입사각(Incidence angle), 식생 피복 측면에서 특정 유효 범위를 가진다 (Fung et al., 1992;
Karam et al., 1992). 그러나, 실험실 환경이 아닌 광범위 한 현장의 표면 매개 변수의 실측은 자연에 의해 토양 이 계속 변화하기 때문에 특성화하기 어렵고 실측이 이 루어지지 않은 경우 모형의 적용이 어려운 한계점이 있 다 (Srivastava et al., 2008). 통계적 모형은 레이더의 후방 산란과 토양수분 간의 통계적인 관계를 이용하는 것으 로 선형회귀 (Linear regression), Nelder-Mead, Bayes 등을 활용한 연구가 진행되었고 (Hachani et al., 2019), 토양의 dry/wet condition에서의 후방산란값을 기준으로 변화 량을 토양수분의 증감량으로 가정하는 변화 감지 모형 인 TU-Wien 모형이 개발되기도 하였다(Wagner et al., 1999). 최근 인공지능을 활용한 기계학습의 성능이 비 약적으로 발전함에 따라 이를 활용한 연구가 점차 증가 하고 있다 . ANN(Artificial Neural Network), SVR(Support
SAR 영상은 6일 간격으로 2015년부터 2019년까지 5년 동안 구축하였고, SNAP(SentiNel Application Platform)을 사용하여 기하 보정, 방사 보정 및 잡음(Noise) 보정을 수행하고 VV 및 VH 편파 후방산란계수로 변환하였다.토양수분 산정 모형의 검증자료로TDR로 측정된 6개 지점의 실측 토양수분 자료를 구축하였으며, 수문학적 개념인 선행 강우를 고려하기 위해 동지점에 대한 강수량 자료를 구축하였다. 다중선형회귀모형은 전체 기간 및 계절별로 나누어 모의하였으며, 독립변수의 증감에 따른 상관성 분석을 진행하였다. 산정된 토양수분은 결 정계수(R2)와 평균제곱근오차(RMSE)를 활용하여 검증하였다. 초지 지역에서 후방산란계수만을 이용한 토양 수분 산정 결과R2가0.13, RMSE가 4.83%으로 나타났으며 선행강우를 5일까지 사용했을 경우 R2가0.37, RMSE 가4.11%로 상관성이 상승하는 모습을 보였다. 이 때, 토양수분의 계절별 변동성과 감소 패턴의 반영을 위해 무 강우누적일수의 적용과 계절별 회귀식을 작성한 결과R2가0.69, RMSE가 2.88%로 상관성이 크게 상승하였다.
SAR 기반 토양수분 추정 시 선행강우 및 무강우누적일수의 활용이 효과적이었다.
Vector Machine) 등 다양한 기법을 활용한 토양수분 산 정 연구가 진행되었고 , 기존의 회귀모형, Fuzzy logic, Bayes를 활용한 토양수분 산출 결과보다 좋은 정확도를 보이기도 하였다 (Lakhankar et al., 2006; Notarnicola et al., 2008; Pierdicca et al., 2008; Said et al., 2008).
SAR를 활용한 토양수분 산출 모형들은 대부분 나지 나 일부 농지 등 식생이 적고 평탄한 지역을 대상으로 하여 (Anguela et al., 2010; Dubois et al., 1995; Hoskera et al., 2020; Oh et al., 1992; Srivastiva et al., 2009) 이를 식생지역 에 직접 적용할 수 없다. 식생 지역에서 관측된 레이더 후방산란은 식생층에 의한 다중산란효과로 인해 비선 형적인 거동을 보이게 된다(Notarnicola et al., 2006). 이를 극복하기 위해 반경험적 모형인 Water Cloud Model (WCM)이 제시되었고, 이는 식생지역에서의 레이더 후 방산란을 식생 상층에 의한 후방산란과 지표면 하층의 식생 간섭으로 인해 이중으로 간섭을 받는 토양의 후방 산란으로 나누게 된다 (Attema and Ulaby, 1978). WCM에 서 식생을 고려하기 위한 매개변수로 VWC(Vegetation Water Content), LAI(Leaf Area Index), 식생 높이 등이 제시된 바 있다 (Champion and Gyot, 1992; Dabrowska- Zielinska et al., 2007; Ulaby et al., 1984). 하지만 이러한 매 개변수들은 식생 종류마다 다르고 , 이를 특성화하기 위 해 현장에서의 실측이 필요하다 (Prakash et al., 2012).
산지가 대부분을 차지하고 있는 우리나라에서의 SAR 기반 토양수분 산정을 위해서는 복잡한 지형뿐만 아니라 식생에 의한 영향이 고려되어야 한다 . 식생 영 향을 고려하기 위한 매개변수의 실측이 불가한 경우 , 식 생의 산란 효과를 배제하고 지상에서 지속적으로 관측 되고 있는 기상자료를 활용하여 지표의 토양수분을 직 접적으로 추정할 수 있다. 선행 연구(Jung et al., 2017; Jung
et al., 2020; Lee et al., 2016; Lee et al., 2019)에서는 MODIS(Moderate Resolution Imaging Spectroradiometer) 및 천리 안위성 (Communication, Ocean and Meteorological, COMS) 영상과 선행강우량을 활용하여 토양수분을 추정하는 접근방식을 제시한 바 있다 . 지상에 도달한 강우는 일 부 토양의 표면을 통해 침투하고 , 초과분은 토양의 표 면을 따라 유출되기 때문에 지표유출량의 변화는 침투 량에 크게 영향을 미친다 . 한 유역 내에서 강우가 일정 하게 내릴 경우 , 선행강우량이 많을 때 토양 내 수분량 이 많기 때문에 침투량이 감소하여 유출율이 높아지게
되며 , 반대로 선행 강우가 적거나 없다면 건조한 토양 으로 침투하는 강우량이 많아져 유출률이 감소한다 . 토 양의 초기 함수상태에 따라 침투량은 직접적으로 변화 하기 때문에 , 토양 내 초기함수율은 강수에서 발생하는 유출량을 결정하는 주요 요인이다 (Kim et al., 2007).
본 연구에서는 토양의 초기 함수상태가 선행강우에 큰 영향을 받는다는 점에 착안하여 , 기존 원격탐사 기 술과 수문학적 요소인 선행강우를 활용하여 식생에서 의 마이크로파 산란을 간접적으로 극복하여 보다 합리 적인 토양수분 추정을 수행하고자 한다 .
2. 재료 및 방법
본 연구는 Sentinel-1A/B C-band SAR 위성 영상을 기 반으로 수문학적 요소인 선행 강우를 도입하여 토양수 분을 추정하였다 . Sentinel-1 위성영상은2015년부터2019 년까지 6일 간격으로 총 5년간의 영상을 수집하였다. 동 기간에 대하여 토양수분량을 일별로 수집하고 선행 강 우의 적용을 위해 동 지점의 강우량 자료를 수집하였다 . 위성 영상의 전처리는 ESA(European Space Agency)에 서 제공하는 SNAP(SentiNel Application Platform)을 활 용하였고 , 편파별(VV/VH) 후방산란계수(Backscattering coefficient)로 변환하였다. 토양수분 추정 모형은 다중 선형회귀모형을 활용하였고 추정된 토양수분은 실측 토양수분과의 비교를 통해 검증을 실시하였다 (Fig. 1).
1) 대상 지역
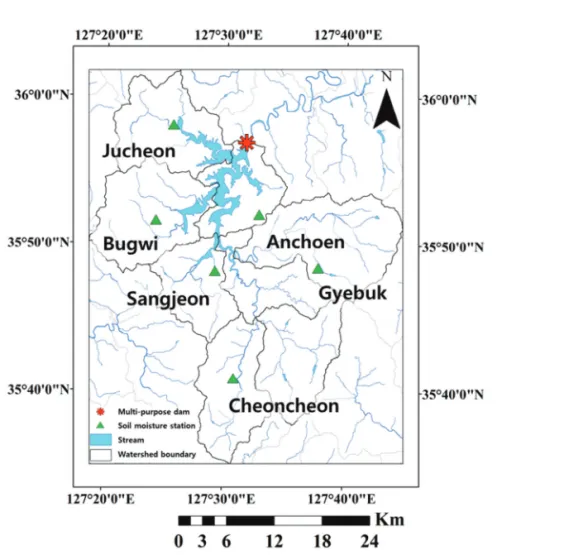
본 연구의 대상 지역은 전라북도 동부에 위치한 용담 댐 유역 (N35°35′~36°00′, E127°20~127°45′)이다(Fig. 2).
용담댐 유역은 금강유역의 전체 면적 중 약 9.5%인 930 km
2이며 , 토지 이용은 산림과 농업지역이 각 70%, 21%
로 지배적이다 . 유역의 연평균 기온은 11.6°C이며, 연평
균 강수량은 1,362.3 mm이다(Park et al., 2014). 용담댐 유
역은 UNESCO-IHP(International Hydrological Program)의
대표 시험 유역으로 한국수자원공사 (K-water)에서 6개
지점에 대한 수문 및 기상 관측자료를 수집하고 있다 .
본 연구에서 활용한 Sentinel-1 위성은 C-band(5.404 GHz)
SAR가 탑재되어 있어 약 2~5 cm의 투과성을 가지기 때
문에 (Ottinger and Kuenzer, 2020) 측정되는 토양수분 자
Fig. 1. Flowchart.
Fig. 2. Locations of study sites.
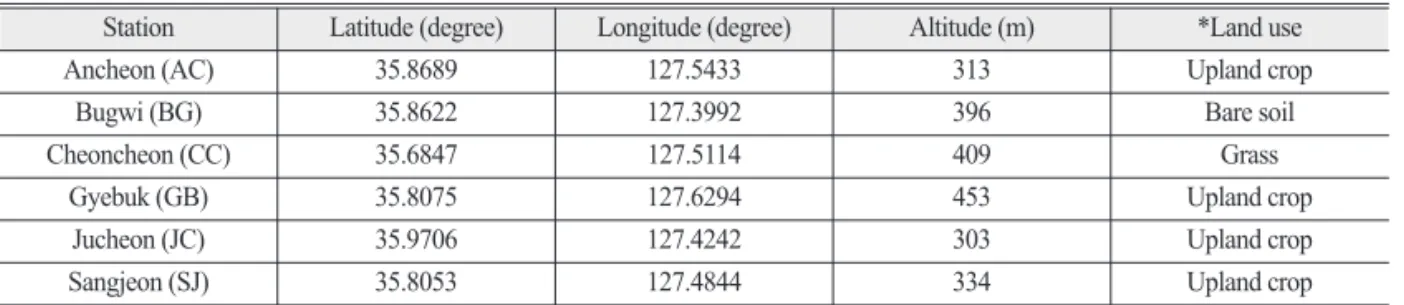
료 중 지면에서 가장 가까운 10 cm 깊이에 설치한 TDR 센서를 통해 측정된 토양수분 값을 사용하였으며 , 각 토 양수분 관측지점의 일반적인 정보는 Table 1과 같다.
2) Sentinel-1 C-band SAR
Sentinel-1은 ESA에서 상세한 전 지구 모니터링을 위 한 Copernicus Program의 일환으로 발사한 첫번째 위성 으로 , 2014년 4월에 발사된 Sentinel-1A와 2016년 6월에 발사된 Sentinel-1B 위성이 각각 12일 주기로 SAR 영상 을 제공한다 . 위성에서 쏘아진 마이크로파의 송신 및 수 신 방향에 따라 VV (Vertical Transmit – Vertical Receive), VH (Vertical Transmit– Horizontal Receive), HH (Horizontal Transmit – Horizontal Receive), HV (Horizontal Transmit – Vertical Receive)의 4가지 종류의 영상을 제공한다.
Sentinel-1A/B의 영상 취득 모드는 해상도와 주사폭에 따라 달라지는데, SM (Stripmap), IW (Interferometric Wide Swath), EW (Extra Wide Swath), WV (Wave)의 4가지 영 상 모드가 있다. 각 영상 모드에 따라 위상과 진폭 정보 가 포함된 SLC (Single Look Complex)와 진폭정보만이 포함된 GRD (Ground Range Detected)의 2가지의 product 를 제공하며 , 영상의 모드 별 자세한 제원은 다음과 같 다 (Table 2).
본 연구에서는 육지를 관측하는 Sentinel-1의 주요 모 드인 IW 모드의 GRD product를 연구에 활용하였으며, 위성 영상의 전처리는 궤도 보정 , 방사 보정, 열 잡음
(Thermal noise) 및 스펙클(Speckle) 보정, 지형 보정, dB
스케일 변환 순으로 진행하였다 . 최초로 제공되는
Sentinel-1 위성 영상은 정확한 궤도정보가 포함되지 않 아 제공일로부터 약 3주 후 제공되는 궤도정보(Precise orbit)를 활용해 보정하였다. 방사 보정은 각 화소의 강도 (Intensity)에서 후방산란계수를 산출하기 위해 수행되 었고 , 영상의 열 잡음은 SNAP의 열 잡음 보정(Thermal noise removal) 기능을 이용해 보정하였다.
SAR 시스템은 고해상도의 영상을 얻기 위해 송수신 신호를 coherent하게 처리하는 특성을 가져 생성된 영 상에 불확실성 및 화질의 열화를 유발하는 스펙클이 발 생하게 된다(Porcello et al., 1976). 스펙클을 감소시키기 위한 방법은 영상화 이전 단계에서 수행되는 Multi-look 처리 기법과 영상화 이후 영상을 필터링하는 방법이 있 다 (Koo et al., 2002). Multi-look 처리 기법은 SAR의 multi- look 데이터를 얻어낸 후, non-coherent하게 평균한 값 으로 영상화를 진행하는 방법이며 , 스펙클을 충분히 제 거하기 위해서는 레이더 영상의 해상도가 악화되는 단 점이 있다 (Zelenka, 1976). 영상 영역에서의 필터링 기법 은 Lee(Lee, 1980), Lee sigma(Lee et al., 2009), Frost(Yu and Acton, 2002) 등의 필터링 기법을 활용하여 스펙클을 감 소시킨다. 본 연구에서는 Multi-look 기법과 필터링 기 법을 통해 각각 도출된 후방산란계수와 토양수분간 상 관성 분석을 수행하여 각 기법의 적합성을 평가하였다 . 필터링 기법에 사용된 필터는 Lee sigma 필터로, 영상의
Table 1. Relevant information of the soil moisture observation sitesStation Latitude (degree) Longitude (degree) Altitude (m) *Land use
Ancheon (AC) 35.8689 127.5433 313 Upland crop
Bugwi (BG) 35.8622 127.3992 396 Bare soil
Cheoncheon (CC) 35.6847 127.5114 409 Grass
Gyebuk (GB) 35.8075 127.6294 453 Upland crop
Jucheon (JC) 35.9706 127.4242 303 Upland crop
Sangjeon (SJ) 35.8053 127.4844 334 Upland crop
* Each land use was classified using the 2019 level-3 land cover map of the Ministry of Environment
Table 2. Specifications by image acquisition mode of Sentinel-1
Acquisition mode Swath width (km) Single look resolution (m) Polarization
SM (Stripmap) 80 5 × 5 HH + HV or VV + VH
IW (Interferometric wide swath) 250 5 × 20 HH + HV or VV + VH
EW (Extra wide swath) 400 20 × 40 HH + HV or VV + VH
WV (Wave) 20 20 × 5 HH or VV
스펙클을 가우시안 분포로 가정하며 스캐닝 윈도우 (Scanning window)의 중심 픽셀을 기준으로 2σ 범위 이내 의 픽셀들의 평균으로 중심 픽셀을 대체하는 필터이다 (Lee et al., 2009). 2σ의 확률은 95.5%로 해당 범위를 벗어 나는 픽셀은 다른 모집단에서 비롯될 확률이 높아 평균 계산에서 제외된다 (Kimet al., 2019). 지형의보정은SRTM DEM(Shuttle Radar Topography Mission Digital Elevation Model)과 Range-Doppler 지형 보정 기능을 활용해 수행 되었으며 , dB 스케일 변환을 통해 최종적인 후방산란계 수를 생성하였다 .
3) 다중선형회귀모형
본 연구에서 토양수분을 추정하기 위해 활용한 다중 선형회귀모형 (Multiple Linear Regression Model)은 2개 이상의 독립변수를 가질 때, 종속변수의 변화를 설명하 는 회귀 모형이다 . 종속변수를 잘 설명하는 n개의 독립 변수 (X1, X2, …, Xn)를 가지는 다중선형회귀모형은 식 1과 같이 나타낼 수 있다.
Y = C + B
1X
1+ B
2X
2+ … + B
nX
n(1) 여기서 , Y는 종속변수, X
1, X
2, …, X
n은 종속변수에 영향 을 주는 n개의 독립변수, B
1, B
2, …, B
n은 각 독립변수 X
1, X
2, …, X
n에 해당하는 회귀 계수이며 , C는 상수항이다.
다중선형회귀모형을 활용한 토양수분의 산정은 입 력자료의 사용 유무에 따라 총 10개의 시나리오로 나누 었으며 , Sentinel-1 SAR 영상의 후방산란계수를 최우선 입력자료로 가정하고 고려할 수 있도록 시나리오를 선 정하였다 (Table 3). Table 3에서 Backscatter는 SAR 영상
의 각 편파 별(VH, VV) 후방산란계수, n-1, n-2 등은 모 의일로부터 전일 , 전전일의 선행 강우를 나타낸다. Dry days는 무강우누적일수를 나타내며, 강우가 지속되지 않는 기간의 토양수분 저하량을 반영하기 위해 선정한 변수로써 무강우누적일수의 기준은 10 mm 이하일 때 강우가 내리지 않은 것으로 간주하였다 . 1번부터 3번까 지의 시나리오는 편파별 후방산란계수만을 이용하여 토양수분을 산정하는 경우와 다중 편파자료를 모두 사 용했을 경우를 나타낸 것이다. 4번부터 8번 시나리오는 다중 편파자료를 사용한 3번 시나리오에서 5일까지의 선행강우를 추가로 고려하였을 때를 나타낸 것이다 . 9번
시나리오는 8번 시나리오에 무강우누적일수를 추가로
고려한 경우이며 , 10번 시나리오에서는 9번 시나리오 를 계절별 (봄: 3~5월, 여름: 6~8월, 가을: 9~11월, 겨울:
12~2월)로 구분해 회귀계수를 산정하여 입력자료의 계 절별 영향을 분석하고자 하였다 .
3. 결과 및 고찰
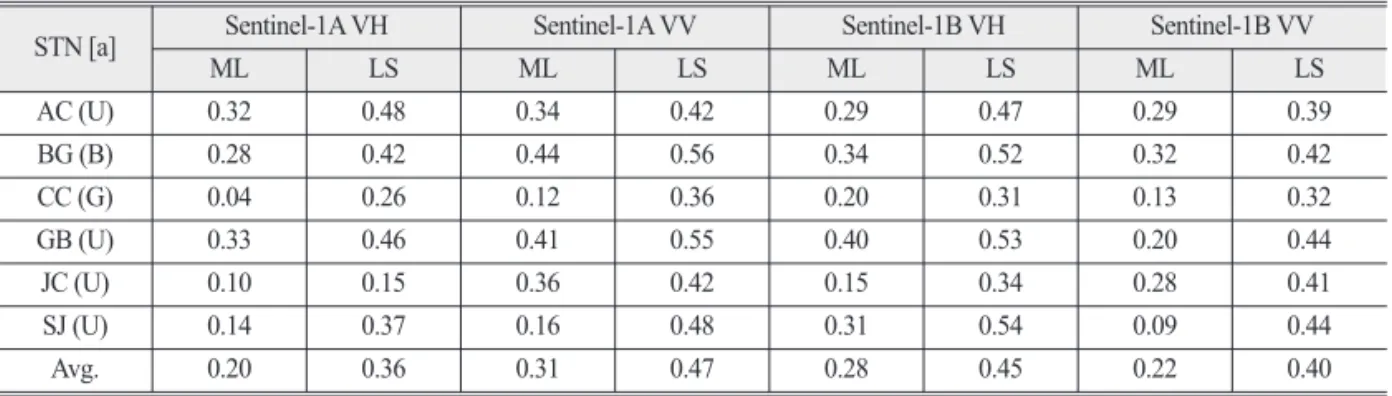
1) 후방산란계수와 토양수분간 상관관계 분석
Table 4에서는 스펙클 필터링 방법 별(Multi-look, Lee sigma) 각 관측소의 후방산란계수와 실측 토양수분간 상관계수 (Correlation coefficient, R)를 비교하여 나타내 었다 . Sentinel-1A에서는 VV 편파의 후방산란계수가 VH 편파의 후방산란계수보다 실측 토양수분과 상관성이 더 높았고 , Sentinel-1B에서는 반대의 경향이 나타났다.
이는 Sentinel-1A(Descending)과 Sentinel-1B(Ascending)의
Table 3. Scenario classification by input data for multiple linear regression modelScenario No. Backscatter Precipitation
VH VV n-1 n-2 n-3 n-4 n-5 Dry days
1 ○ – – – – – – –
2 – ○ – – – – – –
3 ○ ○ – – – – – –
4 ○ ○ ○ – – – – –
5 ○ ○ ○ ○ – – – –
6 ○ ○ ○ ○ ○ – – –
7 ○ ○ ○ ○ ○ ○ – –
8 ○ ○ ○ ○ ○ ○ ○ –
9 ○ ○ ○ ○ ○ ○ ○ ○
10 (Seasonal) ○ ○ ○ ○ ○ ○ ○ ○
궤도의 차이로 인해 발생하는 입사각 (Incidence angle) 의 차이로 각 위성영상에서 표면 거칠기가 달라져 나타 나는 현상 (F.Benninga et al., 2020) 또는 편파에 따른 후 방산란계수의 토양수분에 대한 민감도가 달라 나타나 는 현상인 것으로 판단된다 (Baghdadi et al., 2007). 실제 관측소별로 계산된 입사각 정보 (Table 5)를 확인해보면 Sentinel-1A 위성과 Sentinel-1B 위성에서의 입사각이 차 이가 나는 것을 확인할 수 있다 . 스펙클 필터링 방법별 로 살펴보면 Muiti-look 방법보다 Lee sigma 필터를 이용 했을 때 실측 토양수분과 전체적으로 상관성이 높아짐 을 알 수 있다 . 관측소별 평균 R은 Sentinel-1A에서는 VH 및 VV 편파에서 Lee sigma 방법이 Multi-look 방법에 비 해 각각 0.16 상승하였고 Sentinel-1B에서는 VH 편파에 서 0.17, VV 편파에서 0.18 상승하였다. 특히, 천천(CC) 관측소의 경우 Sentinel-1A VH 편파에서 R이 0.04에서 0.26으로 0.22, VV 편파에서는 0.12에서 0.36으로 0.24 상 승하였다 . Sentinel-1B에서는 상전(SJ)관측소에서 VH 편 파의 R이 0.31에서 0.54로 0.23, VV 편파에서는 0.09에서 0.44으로 0.35 상승하였다. 반대로, 주천(JC)관측소의 경 우 Sentinel-1A의 VH 편파에서 R이 0.05, VV 편파에서
0.06 상승하는 모습을 보여 스펙클 필터링 기법 간 큰 차 이가 나타나지 않았다 . 결과적으로 관측소별로 값의 차 이는 있지만 , 본 연구의 대상 지역 내에서 스펙클을 효 과적으로 제거하는 기법은 Lee sigma 필터를 이용한 필 터링 기법이라고 할 수 있다 . 선행 연구(Liu et al., 2021)에 서도 다양한 스펙클 필터링 방법을 비교하였을 때 Lee sigma 필터를 활용해 도출한 후방산란계수가 실측 토양 수분과 상관성이 가장 높다는 사실이 밝혀진 바 있다 .
Lee Sigma 필터링 기법으로 도출된 Sentinel-1A 위성 의 VV 편파 후방산란계수를 기준으로 토지이용별 특성 을 분석하였다 (Fig. 3). 식생의 거의 존재하지 않는 나지 인 부귀(BG)관측소의 경우 후방산란계수와 실측 토양 수분 간 강한 선형성(R=0.56)이 나타나는 것을 확인할 수 있다(Fig. 3b). 반면, 초지인 천천에서는 식생층으로 인한 산란으로 비선형적 거동을 보였다(Fig. 3c). 나머지 밭의 경우 안천 (AC)과 주천은 R이 0.42 상전은 0.48로 나 타났으며 계북 (GB)관측소에서는 부귀 관측소와 근접 한 (R=0.55) 상관성을 보이기도 하였다. 이는 밭마다 재 배하는 작물의 종류나 재배 밀도 , 또는 농경지와 휴경 지의 차이에서 기인하는 결과로 사료된다 .
Table 4. Comparison of correlation coefficient (R) between backscattering coefficient and observed soil moisture by speckle filtering method at each station
STN [a] Sentinel-1A VH Sentinel-1A VV Sentinel-1B VH Sentinel-1B VV
ML LS ML LS ML LS ML LS
AC (U) 0.32 0.48 0.34 0.42 0.29 0.47 0.29 0.39
BG (B) 0.28 0.42 0.44 0.56 0.34 0.52 0.32 0.42
CC (G) 0.04 0.26 0.12 0.36 0.20 0.31 0.13 0.32
GB (U) 0.33 0.46 0.41 0.55 0.40 0.53 0.20 0.44
JC (U) 0.10 0.15 0.36 0.42 0.15 0.34 0.28 0.41
SJ (U) 0.14 0.37 0.16 0.48 0.31 0.54 0.09 0.44
Avg. 0.20 0.36 0.31 0.47 0.28 0.45 0.22 0.40
STN: Station, ML: Multi-look, LS: Lee sigma [a] The alphabet in parentheses in the right of the stations represents the land use – U: upland crop, B: Bare field, G: Grass
Table 5. Incidence angle information for study sites
Station Sentinel-1A (Descending) Sentinel-1B (Ascending)
Ancheon (AC) 51°, 52°, 53°, 54° 29°, 30°, 31°, 32°
Bugwi (BG) 36° 42°, 43°
Cheoncheon (CC) 49°, 50°, 51° 31°, 32°
Gyebuk (GB) 43°, 44° 37°, 38°
Jucheon (JC) 43° 39°, 40°
Sangjeon (SJ) 36°, 37°, 38° 44°, 45°
2) 시나리오별 토양수분 산출 결과
Table 6은 토지이용이 초지로 분류되는 천천 관측소 의 Sentinel-1A 위성영상을 활용한 시나리오별 다중선 형회귀모형의 결과를 나타낸 것이다 . 여기서, Constant 는 회귀식의 상수항이며 , Backscatter와 Precipitation은 Table 3에서 설명한 위성영상의 후방산란계수와 강수 량 관련 매개변수 (선행강우량, 무강우누적일수)의 회귀 계수를 나타낸 것이다. 모든 자료를 활용한 9번 시나리 오는 식 2와 같이 나타낼 수 있다.
Soil moisture = 30.270 + -0.176 * VH + 0.928 * VV + … + -0.089 * Dry days (2) 모의 결과의 상관성 및 적합성은 결정계수 (Coefficient of determination, R
2)와 평균제곱근오차(Root Mean Square Error, RMSE)를 목적함수로 활용하여 평가하였다. 여 기서, R
2는 1에 가까울수록, RMSE는 0에 가까울수록 모 의 값과 실측 값의 상관성이 높음을 의미한다(Moriasi et
al., 2007).전체적으로 입력자료의 사용이 많아질수록 R
2가 상 승하고 RMSE는 줄어드는 양상을 보였으며, VH 편파 자료만을 이용한 시나리오 1에서 상관성이 가장 낮았다 (R
2=0.07, RMSE=5.01%). VH와 VV 편파자료를 모두 사 용한 3번 시나리오에서는 R
2가 0.13, RMSE가 4.83로 시
나리오 1에 비해 상관성이 소폭 상승하였으나 2번 시나 리오와 거의 차이가 없었다. 따라서, 식생 지역에서의 토양수분 산출에는 VV 편파가 VH 편파 자료보다 활용 성이 더 큰 것으로 판단되며 후방산란계수만으로는 토 양수분 산출이 충분하지 않음을 확인하였다. 선행 강우 를 활용한 4~8번 시나리오의 경우 이를 고려하지 않은 3번 시나리오에 비해 상관성이 상승하는 모습을 보였다 (R
2=0.26~0.37, RMSE=4.11%~4.56%). 특히, 하루 이전 의 선행 강우를 사용한 4번 시나리오가 3번 시나리오에 비해 R
2는 2배 상승한 0.26, RMSE는 0.27 감소한 4.56%
로 실측 토양수분과의 일치도가 증가하였다 . 5~8번 시 나리오의 상관성 증가는 3~4번 시나리오에 비해 크지 않았는데 , 이는 선행 강우 고려 시 회귀식의 독립변수 가 늘어나 생기는 상관성 증가 양상인 것으로 판단된다 . 8번 시나리오에 무강우누적일수를 추가로 고려한 9번 시나리오에서는 8번 시나리오 대비 상관성이 소폭 상승 하였으며(R
2=0.41, RMSE=3.99%), 이를 계절별로 나누 어 모의한 10번 시나리오에서 상관성이 크게 상승하였 다(R
2=0.69, RMSE=2.88%).
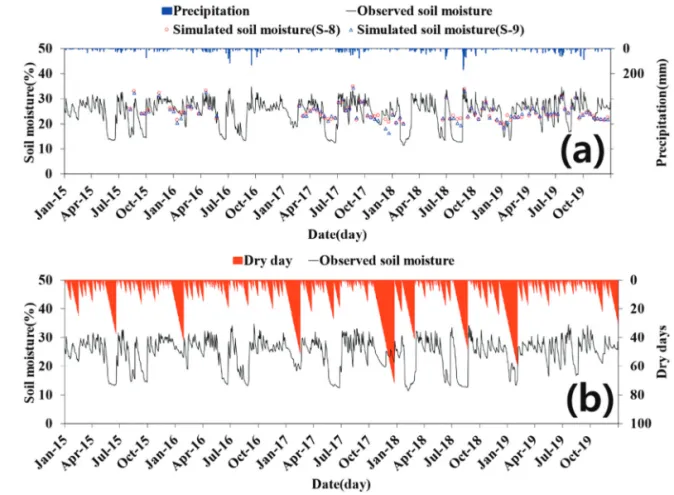
Fig. 4는 천천 관측소의 실측 토양수분과 시나리오 8, 9에서 도출된 모의 토양수분, 무강우누적일수를 시계 열로 나타낸 것이다 . Fig. 4a의 검은색 실선은 실측 토양 수분 , 빨간색 원은 시나리오 8, 파란색 삼각형은 시나리
Fig. 3. Relation between observed soil moisture and Sentinel-1A VV polarization backscattering coefficient for each station:(a) Ancheon, (b) Bugwi, (c) Cheoncheon, (d) Gyebuk, (e) Jucheon, and (f) Sangjeon.
Table 6. Regression values of the multiple linear regression model according to each scenario at Cheoncheon station
Scenario
Num. Season Constant
Backscatter Precipitation
*R
2*RMSE
VH VV n-1 n-2 n-3 n-4 n-5 Dry (%)
days
1 37.207 0.753 – – – – – – – 0.07 5.01
2 39.670 – 1.528 – – – – – – 0.13 4.84
3 40.772 0.144 1.395 – – – – – – 0.13 4.83
4 35.772 -0.070 1.330 0.275 – – – – – 0.26 4.56
5 35.258 0.033 1.139 0.229 0.129 – – – – 0.31 4.32
6 34.092 -0.047 1.178 0.228 0.116 0.059 – – – 0.34 4.21
7 34.090 -0.045 1.174 0.229 0.115 0.049 0.010 – – 0.34 4.21
8 33.501 -0.034 1.121 0.232 0.111 0.055 0.007 0.081 – 0.37 4.11
9 30.270 -0.176 0.928 0.215 0.088 0.049 0.006 0.070 -0.089 0.41 3.99
10 Spring 52.749 0.007 2.716 0.298 -0.024 0.049 0.357 -0.180 -0.287 0.79 1.85 Summer 26.295 0.520 -0.470 0.281 0.078 0.052 0.011 0.162 -0.299 0.75 3.59 Autumn 11.971 -1.737 1.220 0.199 0.027 -0.292 -0.162 -0.005 -0.260 0.58 2.35 Winter 56.758 1.556 0.617 0.099 0.574 4.790 -0.486 0.267 0.035 0.49 3.31
Annual – – – – – – – – – 0.69 2.88
*R
2: Coefficient of determination, RMSE: Root mean square error
Fig. 4. Time series graph of (a) observed soil moisture and simulated soil moisture in Scenario 8(S-8) and Scenario 9(S-9) at Cheoncheon station, (b) observed soil moisture and dry days at Cheoncheon station.
오 9의 결과이며 파란색 막대는 강수량이다. Fig. 4b의 검정색 실선은 실측 토양수분 , 빨간색 막대는 무강우누
적일수이다 . 무강우누적일수의 도입으로 토양수분의
감소 양상이 시나리오 8에 비해 근소하게 더 잘 나타나 는 모습을 볼 수 있다 (Fig. 4a). 하지만, 2017년 5~6월, 2018년 2월, 7월, 2019년 8월경 강우가 내리지 않아 급격 히 감소하는 토양수분의 감소량의 모의가 잘 이루어지 지 않았다. 반대로 2017년 12월경에는 약한 강우로 토양 수분량이 약간 상승하였으나 모의된 토양수분은 계속 감소하는 경향을 나타냈다 . Fig. 4b를 살펴보면, 무강우 누적일수의 심도와 증가 양상이 상기 기술된 2017년 5~6월, 2018년 2월, 7월, 2019년 8월경의 실측 토양수분 에 대비하여 과소하게 나타나고 2017년 12월경에는 과 대하게 나타나는 것을 확인할 수 있다 . 이러한 특성으 로 인해 해당 기간에는 모의 값과 실측 값의 차이가 나 타나는 것으로 판단되며 , 무강우누적일수의 무강우 기 준을 각 지역의 기상조건 , 토양속성, 지형 등을 고려하 여 재 산정할 필요가 있는 것으로 판단된다.
시나리오 9번과 계절별 회귀 시나리오인 10번 시나 리오의 비교를 위해 Fig. 5의 Boxplot에서 실측 토양수 분과의 기술 통계량을 분석하였다 . 실측 토양수분의 범 위는 11.5% ~ 33.6%, 시나리오 9는 16.4% ~ 34.3%로 나 타나 시나리오 9에서는 토양수분 감소량의 모의가 잘 이루어지지 않았음을 나타냈다 . 시나리오 10의 범위는 10.2% ~ 33.7%로 실측 토양수분과 매우 유사하였다. 사 분범위 (Interquartile Range, IQR)와 표준편차(Standard Deviation, SD)의경우실측토양수분은각각5.98%, 5.20%,
시나리오 9는 3.88%, 3.32%였으며 시나리오 10은 6.10%, 4.32%로 나타나 계절별 회귀계수 산정을 통한 토양수 분 모의가 정확도가 더 높은 것을 확인할 수 있었다.
Fig. 6는 9번 시나리오와 10번 시나리오의 Scatter plot 을 나타낸 것이다 . 계절별 회귀를 진행하지 않은 시나 리오 9에서는 봄철과 가을철에는 안정적인 거동을 보 이나 여름철과 겨울철에 토양수분량의 10%~20%의 낮 은 범위에서 나타나는 비선형적 거동 (Fig. 6a)이 확인되 었다 . 지표면의 수분이 충분하고 균질하게 분포할 경우 표면 간섭이 감소하여 안정적인 토양수분 산출이 가능 성이 높지만(Brocca et al., 2011), 반대의 경우 이러한 토 양수분의 비선형적인 거동이 산출되는 것으로 생각될
Fig. 5. Boxplots of observed soil moisture (Obs.), simulated result by scenario 9 (S-9), and scenario 10 (S-10).
Fig. 6. Scatter plots of observed soil moisture and simulated soil moisture by (a) scenario 9, and (b) scenario 10.
수 있다 .
시나리오 10에서 계절별로 회귀계수를 각각 산정하 는 경우 R
2가 0.41에서 0.69로 크게 상승하였고, 시나리 오 9에서 나타난 비선형적 거동이 선형적으로 잘 보정 된 것을 확인할 수 있다(Fig. 6b). 하지만, 일부 여름철 및 겨울철에 1:1 Line에서 벗어나는 경우도 존재하였다. 여 름철의 경우 온도가 증가하여 지면에서의 수분 증발이 활발해지고 식생의 활력도가 높아지면서 토양수분이 감소하게 되는데 (Park et al., 2014) 이 때, 높아진 식생 활 력도로 식생 피복이 증가함에 따라 산란되는 레이더 신 호를 포착하여 이를 활용한 토양수분 모의 시 상관성이 감소하는 것으로 판단된다 . 겨울철에는 강설이나 지표 면의 동결로 인해 모의 정확도가 감소하는 것으로 보이 며 , 기상청에서 제공하는 적설량 및 지중온도 자료의 활 용을 통해 해당 날짜를 제외하면 정확도 높은 토양수분 산출이 가능할 것으로 판단된다 .
Fig. 7은시나리오10을바탕으로Sentinel-1A및Sentinel- 1B 위성 영상을 모두 활용한 관측소별 모의 토양수분의 시계열 그래프이다 . 모든 관측소에서 R
2가 0.7 이상, RMSE가 1.62%~3.31%로 실측 토양수분과의 높은 상관 성을 보였다. RMSE의 경우 관측소의 토양수분 변동범 위의 차이가 클수록 높아지는 경향이 나타났다. RMSE 가 가장 높았던 안천(AC)관측소의 토양수분 변동 범위 는 11.8%~50.8%로 가장 컸고, 부귀(BG)관측소의 경우 토양수분의 최솟값과 최댓값이 3.6%~21.9%로 가장 낮 았고 , RMSE도 1.62%로 가장 낮았다. 전체적인 상관성 은 Fig. 3의 실측 토양수분과 후방산란계수와의 관계와 유사하게 나지인 부귀관측소에서 R
2가 0.77로 가장 높 았고 , 초지인 천천(CC)관측소에서 0.71로 가장 낮게 나 타났다 . 강수시의 모의 토양수분은 실측 토양수분의 변 동과 매우 유사하였으나 , 일부 여름철이나 겨울~봄철 의 가뭄 및 건조시기에는 다소 차이를 보였다 .
Fig. 7. Time series graph of observed soil moisture and observer soil moisture for each station: (a) Ancheon, (b) Bugwi, (c) Cheoncheon, (d) Gyebuk, (e) Jucheon, and (f) Sangjeon.
4. 결론
본 연구에서는 Sentinel-1A/B C-band SAR 위성영상 을 기반으로 토양수분 추정을 수행하였다. 대상 유역은 금강 상류의 산림지역인 용담댐 유역으로, 초지나 산림 에서의 식생으로 인한 마이크로파의 산란 효과를 간접 적으로 극복하기 위해 수문학적 개념인 선행 강우를 활 용하였다 . 토양수분 추정에 사용한 모형은 다중선형회 귀모형이며 , 토양수분 추정 시나리오를 각 입력자료의 활용 여부에 따라 총 10개의 시나리오로 나누어 SAR 영 상의 후방산란계수를 토양수분 산정을 위한 주요 입력 자료로 활용하였다 . 본 연구의 결과를 요약하면 다음과 같다 .
1. 위성영상의 전처리에 있어, 효과적으로 스펙클을 감소시켜 실측 토양수분과 상관성이 높았던 필터 링 기법은 Lee sigma 필터를 활용한 방법으로 나타 났다 . 도출된 후방산란계수와 토양수분과의 상관 성은 나지에서 가장 높았고 (R=0.56), 초지에서 가 장 낮았다 (R=0.36).
2. 초지를 대상으로 한 시나리오별 토양수분 산정 결과 , VH 편파보다 VV 편파가 토양수분 모의에 더 활용성이 높은 것으로 나타났으며 위성에서 얻 어진 후방산란계수만으로는 토양수분산출이 충 분치 않음을 확인하였다.
3. VH 및 VV 편파자료와 선행강우자료를 함께 사용 할 경우 상관성이 증가하였고 (R
2=0.13~0.37, RMSE
=4.11%~4.83%), 비강수시의 토양수분 저하량을 반영하기 위한 무강우누적일수를 추가로 고려할 경 우 토양수분의 감소를 근소하게 더 잘 반영하나 , 일 부 기간에서 무강우누적일수의 심도와 증가 양상 이 과소 혹은 과대하게 나타나 모의 값과 실측 값 에서 차이를 보였다 .
4. 계절별 모의에서는 이를 진행하지 않은 토양수분 모의에서 나타난 비선형적인 거동을 선형적으로 잘 보정하였으나, 일부 여름철 및 겨울철에 증발 및 식생의 활력도 증가 , 강설 및 토양 결빙으로 인 해 산란된 레이더 신호의 오류로 1:1 Line에서 벗 어나는 경우도 존재하였다 .
5. 연구지역 내 관측소 전체를 대상으로 계절별 토양 수분 모의를 진행한 결과 R
2가 0.7 이상, RMSE가
1.62%~3.31%로 실측 토양수분과의 높은 상관성 을 보였다 . RMSE는 관측소의 토양수분 변동범위 가 클수록 높아지는 경향이 나타났으며 , 강수시에 는 모의 결과가 실측 토양수분과 유사하나 일부 여름철이나 겨울 ~봄철의 가뭄 및 건조시기에는 다소 차이를 보였다 .
결론적으로 , 산림이나 초지 등 식생 분포 지역에서의 SAR 영상을 활용한 토양수분 추정 시 선행강우 및 무강 우누적일수의 활용이 효과적임을 확인할 수 있었다 . 하 지만 , 연구 지역내 관측소의 개수가 많지 않고, 다른 지 역을 대상으로 한 검증도 필요하다 . 추후 연구에서는 전 국단위 토양수분 실측자료를 활용하여 다양한 지역과 토지이용 /토양특성 간 분석을 진행하고 회귀모형 뿐 아니라 인공신경망 등 여러가지 기법의 검토를 통해 우 리나라를 대상으로 한 합리적이고 정확한 토양수분 산 출을 수행하고자 한다 .
사사
본 연구는 환경부의 물관리연구사업 (79617)에서 지 원받았습니다 .
References
Anguela, T.P., M. Zribi, N. Baghdadi, and C. Loumagne, 2010. Analysis of local variation of soil surface parameters with TerraSAR-X radar data over bare agriculture fields, IEEE Transactions on
Geoscience and Remote Sensing, 48(2): 874-881.Attema, E.P.W. and F.T. Ulaby, 1978. Vegetation modeled as a water cloud, Radio Science, 13(2): 357-364.
Baghdadi, N., C. King, A. Chanzy, and J.P. Wigneron, 2002. An empirical calibration of the integral equation model based on SAR data, soil moisture and surface roughness measurement over bare soils, International Journal of Remote Sensing, 23(20): 4325-4340.
Baghdadi, N., M. Aubert, O. Cerdan, L. Franchisteguy,
C. Viel, M. Eric, and J.F. Desprats, 2007. Opera - tional mapping of soil moisture using synthetic aperture radar data: application to the Touch basin (France), Sensors, 7(10): 2458-2483.
Baghdadi, N., M. Choker, M. Zribi, M. Hajj, S. Paloscia, N. Verhoest, H. Lievens, F. Baup, and F. Mattia, 2016. A new empirical model for radar scattering from bare soil surfaces, Remote Sensing, 8(11):
920.
Baghdadi, N., M. Zribi, S. Paloscia, N.E. Verhoest, H.
Lievens, F. Baup, and F. Mattia, 2015. Semi- empirical calibration of the integral equation model for co-polarized L-band backscattering,
Remote Sensing, 7(10): 13626-13640.Baghdadi, N., M.E. Hajj, M. Zribi, and I. Fayad, 2016.
Coupling SAR C-band and optical data for soil moisture and leaf area index retrieval over irrigated grasslands, IEEE Journal of Selected Topics in
Applied Earth Observations and Remote Sensing,9(3): 1229-1243.
Baghdadi, N., S. Gaultier, and C. King, 2002. Retrieving surface roughness and soil moisture from synthetic aperture radar (SAR) data using neural networks,
Canadian Journal of Remote Sensing, 28(5): 701-711.
Benninga, H.J.F., R. van der Velde, and Z. Su, 2020.
Sentinel-1 soil moisture content and its uncertainty over sparsely vegetated fields, Journal of Hydrology
X, 9: 100066Brocca, L., S. Hasenauer, T. Lacava, F. Melone, T.
Moramarco, W. Wagner, W. Dorigo, P. Matgen, J. Martinez-Fernandez, P. Llorens, J. Latron, C. Martin, and M. Bittelli, 2011. Soil moisture estimation through ASCAT and AMSR-E sensors:
An intercomparison and validation study across Europe, Remote Sensing of Environment, 115(12):
3390-3408.
Champion, I. and G. Gyot, 1991. Generalized formulation for semi-empirical radar models, Proc. of the
5th International Colloquium on the SpectralSignatures in Remote Sensing, Courchevel, FR,
Jan. 14-18, pp. 269-272.
Chen, K.S., T.D. Wu, L. Tsang, Q. Li, J. Shi, and A.K.
Fung, 2003. Emission of rough surfaces calculated by the integral equation method with comparison to three-dimensional moment method simulations,
IEEE Transactions on Geoscience and Remote Sensing, 41(1): 90-101.Chung, J., Y. Lee, and S. Kim, 2020. Research trends on estimation of soil moisture and hydrological components using synthetic aperture radar,
Journal of the Korean Association of Geographic Information Studies, 23(3): 26-67 (in Korean withEnglish abstract).
Dabrowska-Zielinska, K., J. Musial, A. Malinska, M.
Budzynska, R. Gurdak, W. Kiryla, M. Bartold, and P. Grzybowski, 2018. Soil Moisture in the Biebrza Wetlands Retrieved from Sentinel-1 Imagery, Remote Sensing, 10(12): 1979.
Dubois, P.C., J. van Zyl, and T. Engman, 1995.
Measuring soil moisture with imaging radars,
IEEE Transactions on Geoscience and Remote Sensing, 33(4): 915-926.Entekhabi, D., E.G. Njoku, P.E. O’Neill, K.H. Kellogg, W.T. Crow, W.N. Edelstein, J.K. Entin, S.D.
Goodman, T.J. Jackson, J. Johnson, J. Kimball, J.R. Piepmeier, R.D. Koster, N. Martin, K.C.
McDonald, M. Moghaddam, S. Moran, R. Reichle, J.C. Shi, M.W. Spencer, S.W. Thurman, L. Tsang, and J. Van Zyl, 2010. The soil moisture active passive (SMAP) mission, Proceeded of the IEEE, 98(5): 704-716.
Falloon, P., C.D. Jones, M. Ades, and K. Paul, 2011.
Direct soil moisture controls of future global soil carbon changes: An important source of uncertainty, Global Biogeochemical Cycles, 25(3): GB3010.
Fung, A.K., Z. Li, and K.S. Chen, 1992. Backscattering
from a randomly rough dielectric surface, IEEE
Transactions on Geoscience and Remote Sensing,30(2): 356-369.
Gillies, R.R. and T.N. Carlson, 1995. Thermal remote- sensing of surface soil-water content with partial vegetation cover for incorporation into climate- models, Journal of Applied Meteorology and
Climatology, 34(4): 745-756.Hachani, A., M. Ouessar, S. Paloscia, E. Santi, and S.
Pettinato, 2019. Soil moisture retrieval from Sentinel-1 acquisitions in an arid environment in Tunisia: application of Artificial Neural Networks techniques, International Journal of Remote
Sensing, 40(24): 9159-9180.Holah, N., N. Baghdadi, M. Zribi, A. Bruand, and C.
King, 2005. Potential of ASAR/ENVISAT for the characterization of soil surface parameters over bare agricultural fields, Remote Sensing of
Environment, 96(1): 78-86.Hoskera, A.K., G. Nico, M. Irshad Ahmed, and A.
Whitbread, 2020. Accuracies of soil moisture estimations using a semi-empirical model over bare soil agricultural croplands from Sentinel-1 SAR data, Remote Sensing, 12(10): 1664.
Jang, W., Y. Lee, J. Lee, and S. Kim, 2019. RNN-LSTM based soil moisture estimation using Terra MODIS NDVI and LST, Journal of Korean Society of
Agricultural Engineers, 61(6): 123-132 (in Koreanwith English abstract).
Jung, C., Y. Lee, J. Lee, and S. Kim, 2020. Performance Evaluation of the Multiple Quantile Regression Model for Estimating Spatial Soil Moisture after Filtering Soil Moisture Outliers, Remote Sensing, 2020, 12(10): 1678.
Jung, C., Y. Lee, Y. Cho, and S. Kim, 2017. A study of spatial soil moisture estimation using a multiple linear regression model and MODIS land surface temperature data corrected by conditional merging,
Remote Sensing, 9(8): 870.Karam, M.A., A.K. Fung, R.H. Lang, and N.S. Chauhan, 1992. Microwave scattering model for layered vegetation, IEEE Transactions on Geoscience
and Remote Sensing, 30(4): 767-784.
Kerr, Y.H., P. Waldteufel, J.P. Wigneron, S. Delwart, F.
Cabot, J. Boutin, M.J. Escorihuela, J. Font, N.
Reul, C. Gruhier, S.E. Juglea, M.R. Drinkwater, A. Hahne, M. Martin-Neira, and S. Mecklenburg, 2010. The SMOS mission: new tool for monitoring key elements of the global water cycle, Proceeded
of the IEEE, 98(5): 666-687.Kim, M., K. Cho, S. Park, J. Cho, H. Moon, and S.
Han, 2019. Development of Landslide Detection Algorithm Using Fully Polarimetric ALOS-2 SAR Data, Economic and Environmental Geology, 52(4): 313-322 (in Korean with English abstract).
Kim, J., Y. Park, J. Jeon, B. Engel, J. Ahn, Y. Park, K.
Kim, J. Choi, and K. Lim, 2007. Evaluation of L-THIA WWW direct runoff estimation with AMC adjustment, Journal of Korean Society on
Water Quality, 23(4): 474-481 (in Korean withEnglish abstract).
Koo, P., D. Do, J. Kwon, and W. Song, 2002. Speckle filtering based on adaptive edge sharpening algorithm, Proc. of the Annual Conference of
Institute of Electronics and Information Engineers:Signal Processing Society, Seoul, KR, Sep. 28,