Ⅰ. Introduction
Currently, the need for the electric power supply with 765(KV) of power transmission voltage and high
reliability is increasing. Accordingly, error diagnosis that detects abnormal conditions in electric ower equipment to prevent accident and disability becomes more important.
For diagnosis methods for modern power equipment, chemical detection via gas analysis, mechanical detection via ultrasound measure or vibration measurement, RF measurement for detecting partial discharge, and electrical detection such as UHF measurement method are suggested.[1∼2]
In this study, it offers a FBDS developed to detect partial discharge of power cable. By applying this sensor, it analyzes partial discharge data in the domain of time and frequency.
논문 2017-54-1-19
주파수대역 검출센서를 이용한 전력케이블의 부분방전 진단 시스템
(A Partial Discharge Diagnostic System for Power Cable Using FBDS(Frequency Band Detection Sensor))
이 철 희*, 최 형 기**, 홍 수 미***, 정 의 붕****, 박 기 영*****
( Chul-hee Leeⓒ, Hyung-ki Choi, Soo-mi Hong, Eui-bung Jeoung and Kee-Young Park )
요 약
본 논문은 주파수대역검출센서(FBDS)를 이용하여 전력 케이블에서 부분방전(PD)가 발생했을 때 이것을 검출하고 진단하는 시스템 개발에 관한 논문이다. 주파수대역검출센서는 각 주파수대역에서 발생하는 부분방전을 음향학적으로 변환하여 검출한 다. 부분방전은 그 음향학적 신호 형태로 잡음과 유사하다. 따라서 본 논문에서 상대적 레벨교차율(RLCR)과 주파수에너지 스 펙트럼을 이용하여 정상과 비정상을 구별하여 부분방전을 검출하였다.
Abstract
This system is a diagnosis system that checks whether it causes a partial discharge of a power cable or not.
PD(Partial Discharge) is detected by FBDS(Frequency Band Detection Sensor). That is, it means a acoustic sensor capable of detecting each frequency band. The wave shape of PD sound is similar to noise and is systematically generated by partial discharge. Therefore, in this paper, we could discriminate between normal and abnormal case using relative level crossing rate(RLCR) and spectrogram of frequency energy rate.
Keywords : FBDS(Frequency Band Detection Sensor), PD(Partial Discharge) Diagnostic System, RLCR algorithm
*정회원, ㈜다인스 (DAINS Co., Ltd.)
**정회원, 썬메디텍(주) (SUNMEDITEC Co., Ltd.)
***정회원, 전주비전대학교 보건행정학과
(Public Health Adminstration, VISION College of Jeonju)
****정회원, 호원대학교 자동차기계공학과
(Dept. of Automotive & Mechnical Engineering, Howon University)
*****정회원, 전주비전대학교 디지털전자정보과
(Department of Digital Electronics & Information, VISION College of Jeonju)
ⓒCorresponding Author(E-mail : [email protected]) Received ; October 19, 2016 Revised ; December 16, 2016 Accepted ; December 26, 2016
across the surface of the insulation which is exacerbated by airborne contamination and moisture leading to erosion of the insulation. Internal partial discharge occurs within the bulk of insulation materials and is caused by age, poor materials or poor quality manufacturing processes.[3∼5]
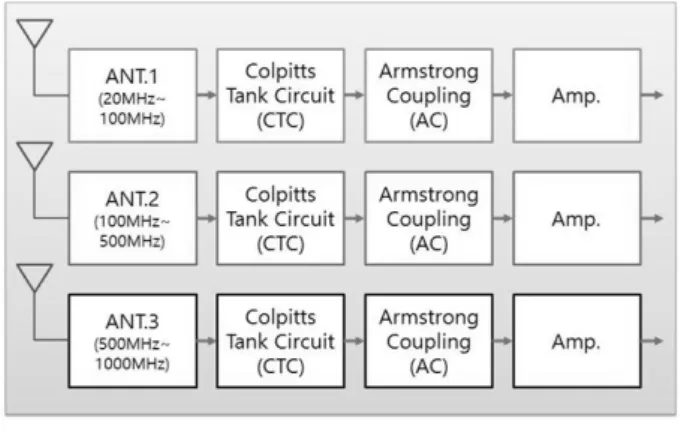
Thus, this study offers a FBDS to measure partial discharge of power cable and analyze, diagnose the data collected from it. Fig. 1 displays the diagram of the FBDS. The reason for the multiple band antenna is that the frequency range variations(20, 100, 1000 MHz).
그림 1. 주파수대역센서의 블록도
Fig. 1. Block Diagram of FBDS.
FBDS detects abnormal signal sound generated from the power cable, and it detects discharge frequency induced by electric field. The electric field generated by partial discharge is very high. Thus, this study offers a sensor to measure partial discharge of power cable and analyze, diagnose the data collected from it. Fig. 2 displays the diagram of acoustic sensor.
In order to detect abnormal condition inside of power cable, it consists of frequency band sensor to collect data.
Frequency band sensor detects resonance frequency (Colpitts Tank Circuit) of the PD from the 3 antennas induced by electric field. Three antennas have the three frequency bands(20∼100(MHz), 100∼500(MHz),
그림 2. 음향센서의 블록도.
Fig. 2. Block diagram of Acoustic Sensor.
500∼1000(MHz)). In the PD carrier frequency, acoustic frequency is created by Armstrong coupling. It detects the induced current through FBDS, amplifies it, and convert the current to voltage to send to microprocessor. The microprocessor performs Fourier transform (FFT) bigger signal voltage among the two, and ANR (Ambient Noise Rejection) by covering it with Hamming Window. The filter bank selects the optimum PD signal to transform in digital format (ADC). This data is sent to the computer in order to analyze and diagnose at time and frequency domains in real time.
2. PD sound data collection
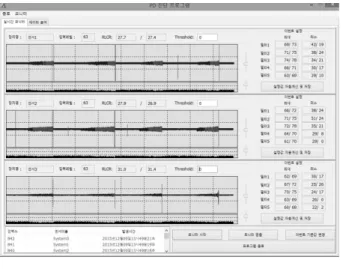
For collecting PD Acoustic Data, the system in Fig. 2 utilized partial discharge sound analysis software designed via Visual C++ in Fig. 3 to gather data from the detected digital signal through the system in Fig. 2. Partial discharge sound entered by the sensor pass through the hard filter in the PD detecting system in Fig. 2 and then, through ADC to the USB port of the computer while being converted from analog to digital. In here, the data was recorded in 16bit, 20KHz.
The data on partial discharge sound generated from three channels (CH1, CH2, and CH3) was collected for analysis and diagnosis. Fig. 3 represents the normal status (no partial discharge), the wave form of time domain.
그림 3. 부분방전 수집과 분석 프로그램 Fig. 3. PD Collection and Analysis Software.
Fig. 4 shows the partial discharge in the time domain. And the PD waveform is displayed as spectrogram in the frequency domain by the FBDS acoustic data analysis. Based on this, it confirms that partial discharge can be detected in real-time
그림 4. 스파크 방전실험에 의한 부분방전
Fig. 4. Partial Discharge by Spark of Lab.
3. FBDS acoustic data analysis algorithm In order to analyze the FBDS acoustic data, the process in Fig. 5 was performed. Hamming window was utilized as window and its size is 300 samples.
The frequency analysis used 1024 point FFT.
As for the relative level cross rate (RLCR), it set a threshold figure for each frame, and counted the number of the signal wave form crossed the threshold as shown in the formula (1).
그림 5. 주파수대역센서에 의한 음향데이터 분석흐름도
Fig. 5. Flow Chart of FBDS Acoustic Data Analysis.
≥
(1)
In this formula, N is the number of the samples in the section to be analyzed, R(m) is the RLCR of current sample m, Lth is the constant experimentally determined, w(n) is Hamming window constant, and x(n) is the signal to obtain RLCR. This formula(1) can be used to clearly distinguish between the acoustic signal and the noise.
Also, the frequency range is divided into three steps for spectrogram analysis of FBDS acoustic data. First, in the FBDS acoustic data, the frequency energy in the low range 0(Hz)~2(KHz) was set as Low spectral energy, and the frequency energy in 2(KHz)~5(KHz) was set as Medium spectral energy.
The frequency energy in the range of 5(KHz)~
10(KHz) was set as High spectral energy. With the spectral energies set as above, the formula (2) extracted the parameters of dbML and dbHL.
dbML Low Spectral Energy Medium Spectral Energy
dbH L Low Spectral Energy
High Spectral Energy (2)
Based on these parameters of dbML and dbHL, it determines dbML parameter and dbHL parameter calculated from the sound signal of normal condition as normal or abnormal whether the figures exist in the error range or not. The determined parameters were shown in color (spectrogram).
그림 6. 변압기오일 방전기에 의한 부분방전
Fig. 6. Partial Discharge Test by Transformer oil spark.
그림 7. 스파크 방전
Fig. 7. Partial Discharge by spark.
Fig. 8 and 9 are the PD waveform shown by the test results above Fig. 6 and 7.
그림 8. 시간영역에서 부분방전
Fig. 8. Partial Discharge in the time domain.
그림 9. 주파수영역에서 부분방전
Fig. 9. Partial Discharge in the frequency domain.
Fig. 10 is the FBDS acoustic of the three channels (CH1, CH2, and CH3) in PD spark Lab. It shows the relation of RLCR and spectrogram energy. With the data collected from each channel, the formula (1) calculated RLCR figures in order to display in the graph.(Fig. 10)
그림 10. RLCR 레벨값 비교 Fig. 10. Comparison of RLCR level.
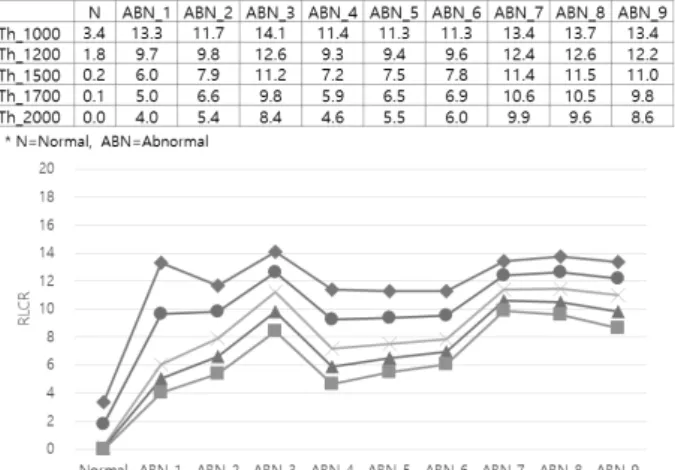
Fig. 11 displays RLCR values in the normal section and abnormal section (where partial discharge (PD) occurred) in terms of the three channels.
그림 11. 3 채널 내에서 RLCR 레벨값의 변화 Fig. 11. Variation of RLCR level in 3 channels.
RLCR values in the normal data frame were ranged from 0 to 3.4, and the RLCR values in the abnormal section (PD) were ranged from 4.0 to 14.1.
Figure 12 is the graph that compares the RLCR figures of three channels. In this graph, it confirms that the partial discharge was occurred according to the RLCR values in real time.
그림 12. 문턱값과 RLCR 값 비교
Fig. 12. Comparison of RLCR and threshold value.
The data displayed the spectrogram in the frequency range. The energy figures in the three domains were calculated by the formula (2). The
그림 13. 문턱값과 평균 RLCR 값 비교.
Fig. 13. Comparison of average RLCR and threshold level value.
Ⅳ. Conclusion
In terms of the realization, the system designed to analyze and diagnose the PD and the sensors in Fig. 6.
In this research, it investigated a constant diagnosis for FBDS based on the normal FBDS acoustic data and the analysis of the data from outside noise and discharge inside of FBDS.
Conventional partial discharge detection method for the PD of power cable was in the filter system.
However, it was difficult to distinguish between the PD signal and noise.
In this paper, we present a new RLCR algorithm and spectral energy analysis method. PD is detected by an acoustic signal of FBDS.
As a result, it found out that the average RLCR has high values over 4.0~14.1. Also, by determining partial discharge in real-time, it is expected to contribute to the prevention and preservation of electric power.
This research was supported by Korea Electric Power Corporation through Korea Electrical Engineering
& Science Research Institute.[grant number R14XA02-19].
REFERENCES
[1] F. H. Kreuger, E. Gulski and A. Krivda,
“Classification of Partial Discharges”, IEEE Trans. on Elect. Insul., Vol. 28, No. 6, pp. 917-931, 1993.
[2] K.Y. Park, J.H. Lee, S.J. Cho, H.K. Choi and E.B. Jung, “A study on a intelligent GIS monitoring system using the preventive diagnostic technology”, Journal of IEEK, Vol. 51, NO. 6, pp.
1372-1379, June 2014.
[3] Neil Davies, Simon Goldthorpe, “Testing distribution Switchgear for Partial Discharge in the Laboratory and the Field”, 20th International Conference on Electricity Distribution, pp. 8-11, 2009. 6.
[4] Momiyama Giyoaki, “Development of a high performance portable PD detection device”, Product and Electrics, 2006. 12.
[5] June Young Lee, Bok Ki Kim, “RF front-end Module for On-Line UHF Partial-discharge Monitoring System”, ICEIC 2004, Vol. 2, 2004. 8
저 자 소 개 이 철 희(정회원)
1997년 2월 원광대학교 제어계측공 학과 공학사
2001년 2월 전북대학교 전자공학과 공학석사
2009년 8월 전북대학교 전자공학과 공학박사
2015년~현재 (주)다인스
<주관심분야 : 신호처리, 융복합소재>
최 형 기(정회원)
1995년 2월 전북대학교 전자공학과 공학사
1997년 2월 전북대학교 전자공학과 공학석사
2009년 8월 전북대학교 전자공학과 공학박사
2011년~현재 썬메디텍(주)기술이사
<주관심분야 : 신호처리, 응용 소프트웨어>
홍 수 미(정회원)
2003년 5월 Purdue University 보 건과학 졸업
2008년 2월~현재 전주대학교 영어 영문학과 TESOL석사 2012년 3월~현재 전주비전대학교
보건행정학과 교수
<주관심분야 : u-Healthcare system, IoT>
정 의 붕(정회원)
1992년 건국대학교 대학원 전자공 학과 공학박사
1992년 호원대학교 자동차기계공학 과 교수
2005년~현재 전주정보영상산업진 훙원 이사
2005년~2016년 호원대학교 산학협력단장
<주관심분야 : 디지털신호처리, IoT>
박 기 영(정회원)
2002년 2월 전북대학교 전자공학 공학박사
1982년~현재 전주비전대학교 디지털전자정보과 교수 2004년~현재 썬메디텍(주)
대표이사
<주관심분야 : 신호처리 및 시스템(음성), Bio processor>