ORIGINAL ARTICLE
Usefulness of F-18 FDG PET/CT in the Evaluation of Early Treatment Response After Interventional Therapy
for Hepatocellular Carcinoma
Sung Hoon Kim & Kyoung Sook Won &
Byung Wook Choi & Il Jo & Seok Kil Zeon &
Woo Jin Chung & Jung Hyeok Kwon
Received: 9 December 2011 / Accepted: 1 April 2012 / Published online: 28 April 2012
# Korean Society of Nuclear Medicine 2012
Abstract
Purpose This retrospective study investigated the useful- ness of F-18 fluorodeoxyglucose (FDG) positron emission tomography/computed tomography (PET/CT) after inter- ventional therapy for hepatocellular carcinoma (HCC).
Methods Between March 2007 and November 2010, 31 patients (24 men, 7 women; mean age, 61.8±11.0 years) with 45 lesions underwent PET/CT within 1 month after interven- tional therapy for HCC. Twenty-six patients with 40 lesions underwent transcatheter arterial chemoembolization (TACE), two patients with 2 lesions underwent radiofrequency ablation (RFA), and three patients with 3 lesions underwent percutane- ous ethanol injection therapy (PEIT). Patients with a history of previous interventional therapy were excluded. Visual analysis was graded as positive when FDG was observed as an eccen- tric, nodular, or infiltrative pattern, and negative in case of isometabolic, hypometabolic, or rim-shaped uptake. For quan- titative analysis, the standardized uptake value (SUV) was measured by region of interest technique. Maximum SUV (SUVmax) was assessed, and the ratio of SUVmax of tumor
to mean SUV of normal liver (TNR) was calculated. The patients were divided into two groups, with and without resid- ual tumor, based on 6-month clinical follow-up with serum alpha-fetoprotein and contrast-enhanced abdominal CT.
Results Of the 45 lesions, 24 were classified in the residual tumor group and the other 21 lesions in the no residual tumor group. No residual tumor was detected after RFA or PEIT. By visual analysis, the respective values for sensitivity, specific- ity, positive predictive value, negative predictive value, and accuracy were 87.5, 71.4, 77.8, 83.3, and 80.0 %. However, there were no significant differences in the SUVmax and TNR between the two groups.
Conclusions It is suggested that FDG PET/CT may play a role in the evaluation of early treatment response after interventional therapy for HCC. The results indicate that FDG PET/CT visual analysis may be more useful than quantitative analysis. Further prospective studies with a large number of patients and established protocol are needed to substantiate our results.
Keywords F-18 FDG . PET/CT . Hepatocellular
carcinoma . Interventional therapy . Locoregional therapy . Response
Introduction
Hepatocellular carcinoma (HCC) is one of the most common cancers worldwide and ranks fifth globally in frequency [1, 2].
Hepatic resection and liver transplantation are the optimum treatments for patients with HCC. However, fewer than 20 % of patients are surgical candidates because of advanced or multifocal disease, poor functional hepatic reserve, or short- age of organ donors [3 – 5]. Therefore, interventional therapy S. H. Kim : K. S. Won ( *) : B. W. Choi : I. Jo : S. K. Zeon
Department of Nuclear Medicine, Keimyung University, School of Medicine,
56 Dalseong-ro,
Jung-gu, Daegu 700-712, Republic of Korea e-mail: [email protected]
W. J. Chung
Department of Internal Medicine, Keimyung University, School of Medicine,
Daegu, Korea J. H. Kwon
Department of Radiology, Keimyung University, School of Medicine,
Daegu, Korea
DOI 10.1007/s13139-012-0138-8
has gained an increasing role in the treatment of HCC. This HCC therapy is based on radiofrequency ablation (RFA), percutaneous ethanol injection therapy (PEIT), and transcath- eter arterial chemoembolization (TACE), with RFA and PEIT being effective in relatively small HCC and TACE being the main interventional therapy in large or advanced intrahepatic HCC [2, 6, 7].
Assessment of tumor response after interventional therapy is important to determine whether the tumor is completely treated or needs additional treatment. Conventional imaging modalities, such as computed tomography (CT) or magnetic resonance imaging (MRI), have been widely used for the evaluation of treatment response after interventional therapy for HCC. The determination of treatment response using size criteria, based on the Response Evaluation Criteria in Solid Tumors (RECIST), does not necessarily apply well to inter- ventional therapy in HCC. Hence, most investigators have relied on the presence or absence of contrast enhancement for the evaluation of therapeutic response as well as changes in tumor size [4, 8, 9]. More recently, modified RECIST has been proposed. However, further studies are needed to con- firm the accuracy of this method [10].
Positron emission tomography (PET) with F-18 fluoro- deoxyglucose (FDG) is a functional imaging modality that reflects glucose metabolism of the region of interest. It is widely used for staging and restaging of a malignancy, monitoring therapeutic response, and detection of recurrent tumors of various cancers. Integrated PET/CT provides superior performance in the evaluation of the malignancy over PET or CT alone. However, FDG PET/CT is less suitable for the detection of primary HCC because of variable FDG uptake. The relatively low sensitivity (50–55 %) is attributable to the degree of glucose-6-phosphatase in HCCs [11–15].
Several studies have reported variable FDG accumulation in the diagnosis of primary HCC [11, 12, 14–17]. However, there are few reports on the efficacy of FDG PET/CT in follow-up of early therapeutic response after interventional therapy of HCC [2, 12, 18]. In addition, no reports have focused on the FDG uptake pattern.
The aim of the present study was to investigate retrospec- tively the usefulness of FDG PET/CT in the evaluation of early treatment response after interventional therapy for HCC using visual analysis including FDG uptake pattern as well as quantitative analysis.
Materials and Methods
Patients
Between March 2007 and November 2010, we retrospectively analyzed data of 108 patients with HCC who underwent interventional therapy and a follow-up FDG PET/CT scan at
our institution. Inclusion criteria in the current study were the first use of interventional therapy (TACE, RFA, or PEIT) for HCC and FDG PET/CT within 1 month after interventional therapy. Patients with a history of the previous interventional therapy or an interval from interventional therapy to FDG PET/CT longer than 1 month were excluded.
Finally, 31 patients (24 men, 7 women; mean age, 61.8±
11.0 years) with 45 lesions were enrolled. All patients con- formed to the diagnostic guidelines of HCC set by the Korean Liver Cancer Study Group [19]. The characteristics of the patients are shown in Table 1. Twenty-six patients with 40 lesions underwent TACE, two patients with 2 lesions underwent RFA, and three patients with 3 lesions underwent PEIT. The time interval between interventional therapy and FDG PET/CT was 0–31 days (mean 9.0±
8.8 days). None of these patients received pretreatment FDG PET/CT examination. All patients received follow-up contrast-enhanced CT (CECT) after interventional therapy to evaluate the treatment response. Serum alpha-fetoprotein (AFP) was evaluated before and after therapy. The study protocols were approved by the Institutional Review Board of our hospital (IRB number: 11-112).
PET/CT Study
FDG PET/CT was performed using an integrated PET/CT system (Discovery STE, GE Healthcare, Milwaukee, WI,
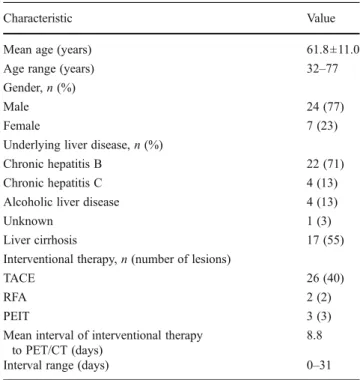
Table 1 Characteristics of the 31 patients
Characteristic Value
Mean age (years) 61.8±11.0
Age range (years) 32 –77
Gender, n (%)
Male 24 (77)
Female 7 (23)
Underlying liver disease, n (%)
Chronic hepatitis B 22 (71)
Chronic hepatitis C 4 (13)
Alcoholic liver disease 4 (13)
Unknown 1 (3)
Liver cirrhosis 17 (55)
Interventional therapy, n (number of lesions)
TACE 26 (40)
RFA 2 (2)
PEIT 3 (3)
Mean interval of interventional therapy to PET/CT (days)
8.8
Interval range (days) 0 –31
TACE Transcatheter arterial chemoembolization, RFA radiofrequency
ablation, PEIT percutaneous ethanol injection therapy, PET/CT posi-
tron emission tomography/computed tomography
USA). The patients fasted for more than 6 h before under- going scanning. The blood glucose level of all patients was below 150 mg/dL prior to the FDG injection. Patients were encouraged to rest during the FDG uptake period. Images were acquired 60 min after intravenous injection of 7.0 MBq/kg of FDG. The data acquisition protocol was as follows: craniocaudal CT scan, with 60–150 mA adjusted to the patient’s body weight, 120 keV, and 3.75 mm section thickness (adjusted for PET section thickness) was per- formed for attenuation correction and localization. No oral or intravenous contrast was injected. Immediately after CT scanning, a caudocranial PET scan was obtained. Six to
eight positions from the base of the skull or top of the brain to the proximal thigh were imaged for 3 min per table bed.
The data were reconstructed iteratively by the ordered sub- set expectation maximization method. Finally, co-registered images were displayed on a workstation.
Image Interpretation
PET/CT images were retrospectively reviewed by two ex- perienced nuclear medicine physicians with all available clinical and imaging information. These reviewers reached a consensus in cases of discrepancy. Dynamic CECT images
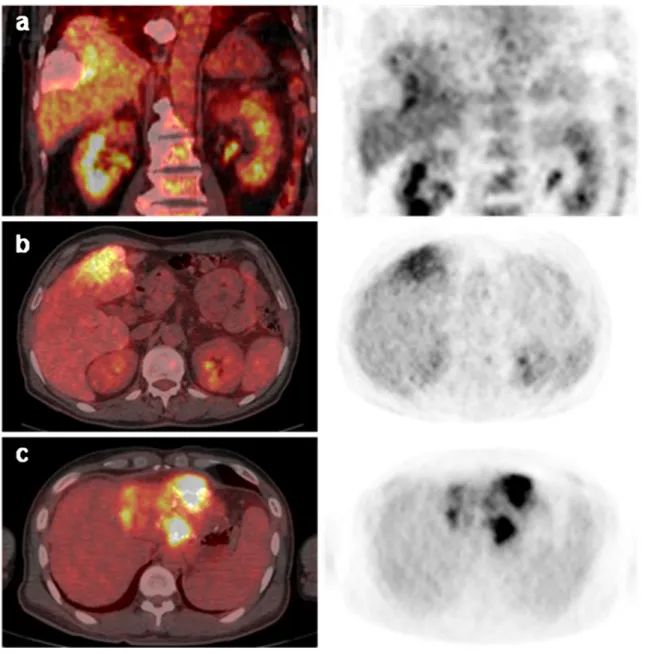
Fig. 1 a –c Representative cases of residual tumor. a A 69-year-old man received transcatheter arterial chemoembolization (TACE). Coronal images of the PET and fused PET/CT obtained 1 day after TACE reveal eccentric FDG uptake along the margin of Lipiodol accumulation at the right hepatic lobe. b A 69-year-old man received TACE. Scattered pattern
of FDG uptake is noted in segment 4 on the axial plane of PET and fused PET/CT images obtained 3 days after treatment. c A 42-year-old man with infiltrative hepatocellular carcinoma (HCC) in the left hepatic lobe.
The PET and fused PET/CT axial images obtained 29 days after TACE
show nodular and scattered increased FDG activity
were interpreted by an experienced radiologist. The PET data were initially visualized using arbitrary window and level values defined subjectively to ensure proper image interpretation. Visual analysis was graded as positive when FDG uptake was observed as an eccentric, nodular, or scattered pattern on both attenuation-corrected and noncor- rected images (Fig. 1). If the lesion showed FDG uptake equal to or lower than that in the surrounding liver paren- chyma or uniform and regular rim-shaped uptake pattern, the diagnosis was defined as negative (Fig. 2). For quanti- tative analysis, the standardized uptake value (SUV) was measured by the region of interest (ROI) technique. Maxi- mum SUV (SUVmax) was assessed, and the ratio of SUV- max of tumor to mean SUV (SUVmean) of normal liver (TNR) was calculated. The contralateral hepatic lobe with- out tumor component was regarded as a normal liver re- gardless of cirrhotic liver disease. The normal liver ROI was drawn as a 2.8-cm-diameter spherical shape and located in the central portion of the lobe contralateral to the individual tumor location. ROI was drawn in the central portion of segment 7-8 in the case of HCCs of the left lobe, for example. In case of HCC in the right lobe, the normal liver ROI was drawn in the central portion of segment 2-3.
Data Analyses
The patients were divided into two groups, with and without residual tumor, based on 6-month clinicoradiologic follow-
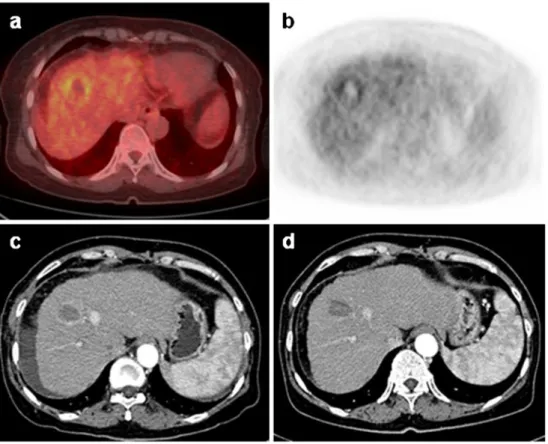
up of CECT with/without serum AFP. When the lesion showed enhancement in the arterial phase of post- treatment CECT, it was considered to be residual tumor. If all tumors of a patient were diagnosed as negative on CECT, serum AFP was considered as a gold standard indicator as well as CECT. However, when all tumors of the patient were not fully treated and some still remained, were aggravated, or showed the presence of the newly developed metastasis, serum AFP level was not regarded as a reliable indicator Fig. 2 a –d Representative case
of rim-shaped FDG uptake. A 63-year-old women who had hepatocellular carcinoma (HCC) in segment 8 received radiofrequency ablation (RFA) treatment. The fused PET/CT (a) and PET (b) images per- formed 1 day after RFA show rim-shaped increased FDG activity surrounding the abla- tion zone. The uniform periph- eral enhancement is noted on contrast-enhanced arterial- phase CT 1 day after RFA (c). On follow-up, a CT image obtained 39 days after RFA (d) demonstrates loss of
enhancement, which is indicative of benign periablational enhancement
Table 2 Diagnostic values of post-treatment FDG PET/CT using visual analysis
Number of lesions PET/CT
Positive Negative
Positive
a21 3
Negative
b6 15
Sensitivity (%) 87.5
Specificity (%) 71.4
Positive predictive value (%) 77.8 Negative predictive value (%) 83.3
Accuracy (%) 80.0
PET/CT Positron emission tomography/computed tomography
a
Positive: residual tumor based on clinicoradiologic evidence
b
Negative: no residual tumor based on clinicoradiologic evidence
because it can not reflect the individual tumor status. Thus, in these cases, CECT alone was used for follow-up of the individual primary lesions. Tumor size was measured by the longest diameter on the axial plane in the arterial phase of the pretreatment abdominal CT or MRI.
All data are expressed as mean ±SD. Statistical analysis was done using Predictive Analytics SoftWare (PASW) version 18.0 (IBM, Somers, NY). A p-value <0.05 was considered significant. The difference in quantitative param- eters between the two groups was compared using Mann- Whitney U test. Wilcoxon signed rank test was used to compare serum AFP levels before and after interventional therapy. The average measure of the intraclass correlation coefficient (ICC) was assessed for the interobserver reliabil- ity. The PET/CT results were classified as true-positive, true-negative, false-positive, and false-negative based on clinicoradiologic evidence. Also, Mann-Whitney U test was used to compare the interval between interventional therapy and PET/CT for true and false results. The sensitiv- ity, specificity, positive predictive value (PPV), negative predictive value (NPV), and accuracy of PET/CT were evaluated.
Results
Table 2 shows the diagnostic values of post-treatment FDG PET/CT using visual analysis. The respective values for sensitivity, specificity, PPV, NPV, and accuracy were 87.5, 71.4, 77.8, 83.3, and 80.0 %. The interobserver reliability was high, with an ICC value of 0.907, and the result was statistically significant (p<0.001).
Two lesions after TACE revealed discrepancies between attenuation-corrected and noncorrected PET images. Both lesions showed increased FDG uptake at iodized oil (Lipiodol, Guerbet, Aulnay-sous-Bois, France) accumulation on attenuation-corrected PET/CT images, but no uptake on non- attenuation-corrected PET images, and so were defined as negative with overestimation artifact (Fig. 3).
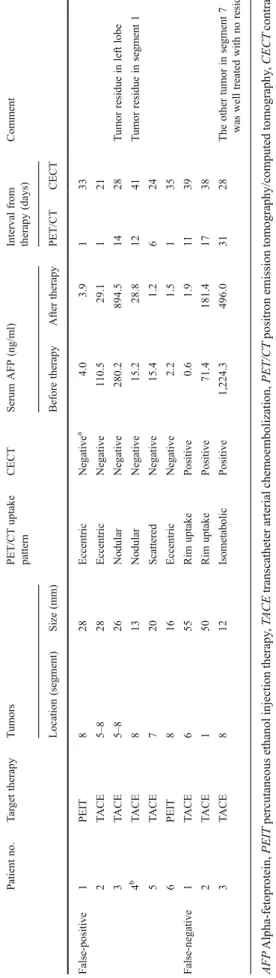
Six tumors (four lesions with TACE and two lesions with PEIT) were positive on PET/CT images. However, all of these lesions were diagnosed as negative on clinicoradio- logic evidence (Fig. 4). On the other hand, three tumors with TACE were negative on PET/CT and positive based on clinicoradiologic evidence. The clinical characteristics of these cases are summarized in Table 3.
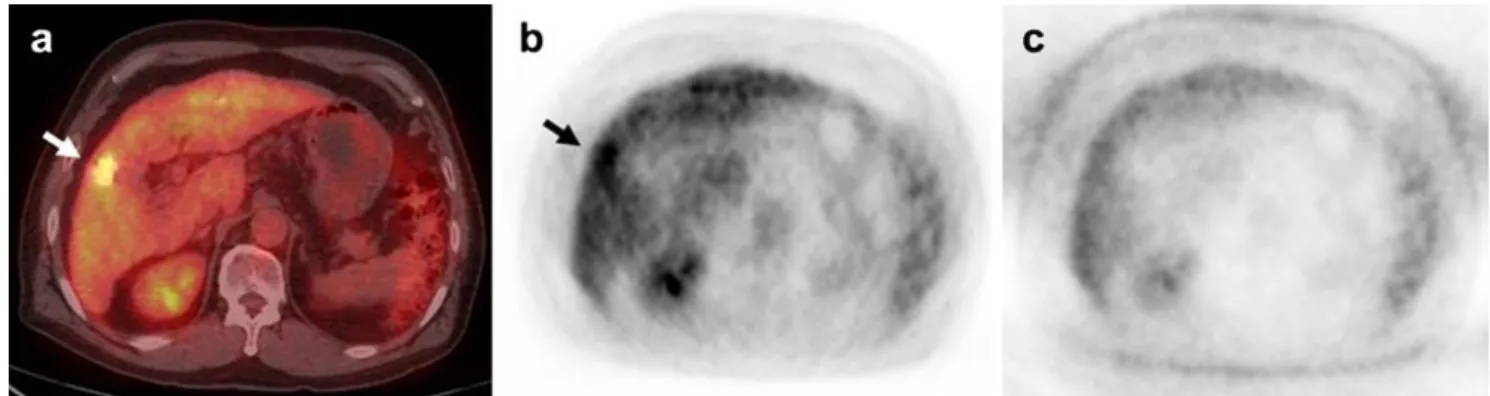
Fig. 3 a –c Attenuation-correction artifact due to chemoembolization agent. A 69-year-old man received transcatheter arterial chemoembo- lization (TACE). Attenuation-corrected PET/CT images (a, b) reveal increased FDG uptake within Lipiodol deposition in segment 5
(arrows), but non-attenuation-corrected PET image (c) shows no ab- normal FDG uptake and is indistinguishable from normal liver paren- chyma. These findings provide an example of an overestimation artifact from Lipiodol
Fig. 4 a –c An example of a false-positive case on FDG PET/CT obtained immediately after PEIT. A 55-year-old man received percu- taneous ethanol injection therapy (PEIT) in segment 8. The fused PET/
CT (a) and PET (b) coronal images obtained 1 day after PEIT show
increased FDG activity (arrow) along the medial aspect of the ablation
zone (asterisk). No contrast enhancement is noted in the necrotic mass
(asterisk) on a contrast-enhanced arterial-phase CT image 33 days after
therapy (c), 3-month and 6-month follow-up CT (not shown)
Of the 45 lesions, 24 were classified in the residual tumor group and the other 21 lesions in the no residual tumor group. No residual tumor was detected after RFA or PEIT.
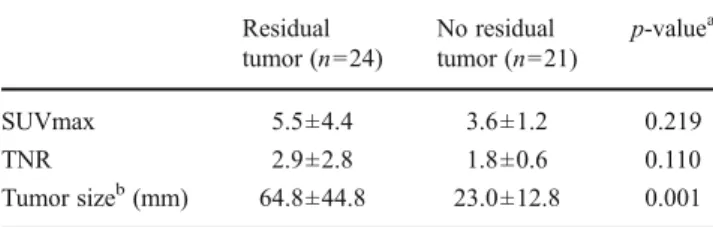
The results of quantitative analysis between the two groups are summarized in Table 4. Tumor size of the residual tumor group was significantly higher than that of the no residual tumor group (64.8±44.8 vs. 23.0±12.8 mm, p00.001). No significant differences were noted in the SUVmax and TNR between the two groups (p>0.05).
Table 5 shows the intervals between interventional ther- apy and PET/CT for true and false results. The intervals for true and false results were 8.8 ± 8.3 and 10.4 ± 9.8 days.
There was no significant difference in the interval between the two groups (p00.689).
The differences in serum AFP level in patients with and without residual tumor are shown in Table 6. Of the 31 patients, 20 were classified in the residual tumor group and 11 were classified in the no residual tumor group. There were significant differences in post-therapeutic serum AFP between the two groups and in pre- and post-therapeutic serum AFP in the no residual tumor group (25,203.8 ± 84,153.7 vs. 24.5±41.2 ng/ml, p00.022; 142.6±220.4 vs.
24.5±41.2 ng/ml, p00.025, respectively). There were no significant differences in pretherapeutic serum AFP between the two groups (p00.220),or in serum AFP over time in the residual tumor group (p00.528).
Discussion
The diagnostic success of FDG PET is based on the increased glycolytic rate seen in most tumors [20]. FDG is transported into cancer cells by glucose transporter proteins and then phosphorylated by hexokinase to FDG-6-phosphate. FDG-6- phosphate cannot be further metabolized in most cancer cells, and so it selectively accumulates in cancer tissues [16]. How- ever, different degrees of glucose-6-phosphatase, which vary widely in different types of HCC, produce variable FDG accu- mulation in HCCs [2, 21]. Thus, the feasibility of PET in diagnosis of HCC is limited due to lower sensitivity [14, 15].
However, only a few studies have dealt with the role of FDG PET/CT in the evaluation of early treatment response after interventional therapy for HCC [2, 12, 18]. Furthermore, no report has focused on both FDG uptake pattern and intensity.
Increased FDG accumulation in inflammatory and infec- tious processes is well recognized [22, 23]. Reactive tissue changes, such as focal hyperemia and inflammation, are depicted in the periphery of the ablated lesion soon after RFA, PEIT, and TACE, and show a uniform and peripheral FDG uptake [9, 24 – 26]. Therefore, the authors regarded a rim-shaped FDG uptake surrounding a target lesion after interventional therapy as negative, despite the greater activity
than normal liver. T able 3 Clinical characteristics of false-positive and false-negative cases on FDG PET/CT Patient no. T ar get therapy T umors PET/CT uptake CECT Serum AFP (ng/ml) Interval from Comment pattern therapy (days) Location (segment) Size (mm) Before therapy After therapy PET/CT CECT
aFalse-positive 1 PEIT 8 28 Eccentric Negative 4.0 3.9 1 33 2 T ACE 5– 8 28 Eccentric Negative 1 10.5 29.1 1 21 3 T ACE 5– 8 26 Nodular Negative 280.2 894.5 14 28 T umor residue in left lobe
b4 T ACE 8 13 Nodular Negative 15.2 28.8 12 41 T umor residue in segment 1 5 T ACE 7 20 Scattered Negative 15.4 1.2 6 24 6 PEIT 8 16 Eccentric Negative 2.2 1.5 1 35 False-negative 1 T ACE 6 55 Rim uptake Positive 0.6 1.9 1 1 39 2 T ACE 1 50 Rim uptake Positive 71.4 181.4 17 38 3 T ACE 8 12 Isometabolic Positive 1,224.3 496.0 31 28 The other tumor in segment 7 was well treated with no residue AFP Alpha-fetoprotein, PEIT percutaneous ethanol injection therapy ,T ACE transcatheter arterial chemoembolization, PET/CT positron emission tomography/computed tomography ,CECT contrast- enhanced computed tomography
aNegative: no residual tumor
bSpontaneous resolution of nodular FDG uptake in segment 8 of the liver on follow-up PET/CT after 8 months
Visual analysis of the present study showed high sensitivity but moderate specificity. Kim et al. reported that sensitivity, specificity, PPV, NPV, and accuracy of FDG PET/CT for viable HCC during early post-embolic period were 100, 63, 84, 100, and 88 %, respectively [11]. In a study of FDG PET/
CT after TACE combined with RFA for HCC, Zhao et al.
demonstrated the high efficacy of early post-therapeutic PET/
CT with 90.9 % positive detection rate [27]. These findings are similar to our results. In the pattern-based analysis, 8 of the 10 rim-shaped uptake lesions were determined as true nega- tive. This result strongly demonstrated that not all hypermet- abolic lesions could be considered residual tumor, even if they showed greater FDG activity than the surrounding liver. It will be necessary to consider FDG uptake pattern to provide more accurate treatment response. Furthermore, of the 27 lesions with eccentric, nodular, or scattered patterns, 21 lesions were diagnosed as true positive.
There were six false-positive and three false-negative results in the present study. One false positive showed an eccentric FDG uptake in the lateral aspect of the ablation zone, but no evidence of residue on clinical follow-up. This may have been due to a benign inflammatory lesion in the needle track, as mentioned in an earlier study [28]. The other false-positives were also regarded as inflammatory changes during the early post-procedure period. When FDG PET is negative after the interventional therapy, although the causes are not clear, it means that tumors lie dormant with temporary dysfunction,
but can survive [2]. Veit et al. reported that detection of residual tumors in the rim-like area remains challenging, as increased glucose metabolism due to tissue regeneration may superim- pose on small areas of residual tumor, resulting in false- negative results [23]. Several studies have demonstrated that tissue regeneration and inflammation in the periphery of the necrotic zone can be seen as early as 2 days after ablation [21, 23, 29]. The observations support the recommendation to perform follow-up PET/CT early or at least within 2 days.
However, three of the six patients with false-positives in our study underwent PET/CT within 24 h after treatment. Never- theless, no statistically significant difference was noted in the time interval of therapy to PET/CT between true and false results. This indicates that a false result may not be associated with the interval from therapy to PET/CT scan. Further large population studies are required to define the time frame of tissue regeneration and to set the ideal time point of early follow-up PET/CT scan after interventional therapy.
In this study, we observed Lipiodol-induced attenuation- correction artifacts in two patients, which were positive on attenuation-corrected images and negative on noncorrected images. Chemoembolization materials cause an overestima- tion of PET activity when using CT information for PET attenuation correction [30]. Thus, non-attenuation-corrected PET images should be considered to avoid a misdiagnosis in patients treated with TACE.
All residual tumors, 24 lesions of 20 patients, were diag- nosed after TACE. On the other hand, none of the patients showed residual tumor after RFA or PEIT. The patients with relatively small HCC may undergo RFA and PEIT as cura- tive treatment. TACE, in contrast, can be used as a bridge to liver transplantation or as a palliative treatment in large or advanced intrahepatic HCC [5, 7]. From this perspective, our results are considered to be reasonable.
No significant differences were presently observed in the SUVmax and TNR between the residual and no residual tumor groups. True causes remain uncertain but may relate to the relatively higher background activity of the liver and inflammatory change during the early post-therapeutic period Table 5 Interval between therapy and PET/CT for true and false
results
Subgroups Interval (days)
True results
a(n036) 8.8±8.3
False results
b(n09) 10.4±9.8
p-value
c0.689
PET/CT Positron emission tomography/computed tomography
a
Both true-positive and true-negative
b
Both false-positive and false-negative
c
Mann-Whitney U test
Table 6 Comparison of serum AFP level (ng/ml) in patients with and without residual tumor
Residual tumor group (n020)
No residual tumor group (n011)
p-value
aBefore therapy 38,846.9±111,989.7 142.6±220.4 0.220 After therapy 25,203.8±84,153.7 24.5±41.2 0.022
p-value
b0.528 0.025
AFP Alpha-fetoprotein
a
Mann-Whitney U test
b
Wilcoxon signed rank test Table 4 Comparison of quantitative parameters between residual and
no residual tumor groups Residual tumor (n024)
No residual tumor (n021)
p-value
aSUVmax 5.5±4.4 3.6±1.2 0.219
TNR 2.9±2.8 1.8±0.6 0.110
Tumor size
b(mm) 64.8±44.8 23.0±12.8 0.001 SUVmax Maximum standardized uptake value, TNR ratio of SUVmax of tumor to SUVmean of normal liver
a
Mann-Whitney U test
b