AN EFFICIENT METHOD FOR VELOCITY ESTIMATION OF MOVING TARGET IN SAR IMAGE
USING TIME-FREQUENCY TRANSFORM
Jeong-Won Park and Joong-Sun Won
Department of Earth System Sciences, Yonsei University 134 Shinchon-dong, Seodaemun-gu, Seoul 120-749, Korea
ABSTRACT: Velocity estimation of moving target in SAR image is a challenging task. To retrieve a velocity of moving object, it is necessary to estimate the speeds of the object in two-dimensions, range and azimuth. Here we present an efficient method for Doppler parameter estimation from SAR data in the time-frequency domain. Wigner-Ville transform is used for the time-frequency transform. A core idea is based upon the fact that signal spectra are mainly distributed around a Doppler history line in the time- frequency domain. We first re-construct the distribution of signal spectrum by picking-up maximum values at each time and frequency dimension. Both test results from simulations and an actual TerraSAR-X are presented. It was very successful to estimate both Doppler centroid and Doppler frequency rate of moving objects. The measurement errors were less 5%. The maximum measurement error depends on the type of source data (range compressed or SLC), signal-to-noise ratio of the signal and the quality of range-migration correction. Range compressed data promises better result, but precise range migration correction plays a key role for estimating Doppler parameters. An experiment using truck-mounted corner reflectors and TerraSAR-X demonstrates the effectiveness of the proposed method.
KEY WORDS: SAR, moving target, Doppler parameters, velocity estimation, time-frequency transform
1. INTRODUCTION
Detection and velocity estimation of moving targets from a SAR image is still a challenging work. In general, either single or multi channel SAR system can be used for this purpose.
Although multi-channel SAR systems such as along-track interferometric (ATI) systems [1] or displaced phase center antenna (DPCA) systems [2] provide a better accuracy, most of these systems are mounted on airborne platform, not on spaceborne. Concerning single-channel spacebonre SAR systems, there are several spaceborne SAR sensors in operation including RADARSAT-1/2, ERS-2, ENVISAT, ALOS, TerraSAR-X and so on.
Both azimuth and range (line of sight) component of target moving motion changes the Doppler history of the moving target in comparison to the clutter [3]. A target motion in the range direction causes Doppler frequency shift and consequently results in a positional shift in azimuth direction.
The range velocity component produces an azimuth displacement of the target in the focussed image, due to a shift of Doppler centroid. The azimuth velocity component causes changes in a Doppler frequency rate resulting in a blurring in the focussed image.
A number of algorithms have been proposed for moving target indication (MTI), and most of them are based on sensing the difference in Doppler parameter between the moving target and the fixed clutter. Freeman and Currie [4] proposed a Doppler filtering method which needs PRF four times larger than the clutter bandwidth. Barbarossa and Farina [5] retrieved the target velocity by estimating the parameters of the chirp signal of moving target in a time-frequency domain. Another way that proposed by Moreira and Keydel [6] is to utilize a Doppler rate map and the range migration for estimating the azimuth and range component of moving velocity, respectively.
Recently, joint time-frequency analysis (JTFA) has been applied to measure the target motion directly from the chirp signal, and it has demonstrated the potential to extract a time sequence of motion parameters [7,8]. Kersten et al.
demonstrated the effectiveness of time-frequency distriburion series (TFDS) for measuring chirp parameters directly from the time-frequency domain compared to short-time fourier transform (STFT) [9]. Sparr showed that the time-frequency signature of a moving target is significantly different from the signatures of a stationary target, even when the SAR images of the two are similar [10].
This study focuses on the velocity estimation of moving target with single-channel spaceborne SAR system particularly using a time-frequency transform. Here we present an efficient method of Doppler parameter estimation from SAR image in time-frequency domain. A core idea is based upon the fact that signal spectra are mainly distributed around a Doppler history line in the time-frequency domain. Since the line of Doppler history slightly varies according to movement of the object, it is not possible to anticipate an exact slope of the line. Instead of searching the exact line, we first reconstruct the distribution of signal spectrum by picking-up maximum values at each time and frequency dimension. It is very efficient and effective to estimate both Doppler centroid and Doppler frequency rate of a moving object. Compared with the conventional JTFA algorithms, the proposed algorithm has the advantage that an improved SNR can be achieved by reconstructing the time- frequency distribution of the target signal along the expected Doppler history.
The remainder of this paper is organized as follows: In section 2, an analytic representation of the Doppler parameter of received radar echo from a moving target is briefly discussed, and a method to measure the parameters in time-frequency domain is addressed. In section 3, simulation results with ENVISAT and TerraSAR-X system parameters are presented for accuracy assessment. In section 4, an experiment using truck-mounted corner reflectors and TerraSAR-X stripmap mode demonstrates the application capability of the proposed method followed by conclusions in Section 5.
2. TIME-FREQUENCY DISTRIBUTION OF SIGNAL FROM MOVING TARGET
2.1 Effect of Target Motion on SAR Imaging
For a stationary target, the Doppler shift is induced only by the radar motion, and consists of two parts [11]: the Doppler centroid
0
2 0
R u fDC x
−λ
= (1)
and the Doppler frequency rate
0
2 2
R fDR u
= λ (2)
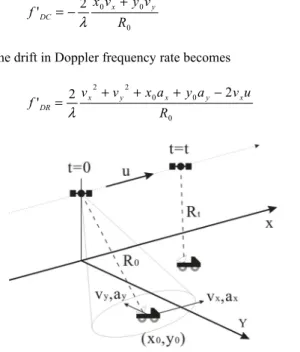
Given a radar velocity u and an initial range R0, the Doppler centroid of the stationary target is determined by its initial location x0 in azimuth direction (or squint angle from sensing geometry, see Figure 1). However, for a moving target, an additional Doppler shift is induced by the target motion (vx,vy).
The Doppler drift induced by the moving target becomes
0 0
2 0
' R
v y v
f DC x x+ y
−
= λ (3)
and the drift in Doppler frequency rate becomes
0 0 0 2
2 2
' 2
R
u v a y a x v
f DR vx + y + x+ y− x
= λ (4)
Figure 1. Geometry of SAR and moving target In the case of satellite SAR system, (3) and (4) can be approximated as below, because R0 and y0 are much bigger than other terms.
0
2 0
' R
v
f DC y y
−λ
= (5)
0
0 2
' 2
R u v a f DR y y − x
=λ (6)
Assuming that acceleration is negligible during target exposure, then (6) can be further approximated as
0
' 4
R u f DR vx
−λ
= (7)
To extract the target motion (vx,vy), the Doppler centroid and the Doppler frequency rate must be calculated independently.
2.2 Wigner-Ville Distribution and the Target Signal in Time-Frequency Domain
The Fourier transform of the signal cannot depict how the spectral content of the signal changes with time, which is critical in many non-stationary signals in practice [12]. The time-frequency transform, however, would provide direct information about the frequency components occurring at given time by combining the local information of instantaneous frequency spectrum with the global information of the temporal behaviour of the signal [13]. Although several time-frequency transformations are available, the Wigner-Ville distribution (WVD) is chosen in this work because it presents some important features concerning estimation issues: (a) the square modulus of two scalar product is equal to the scalar product between their distributions, (b) the mean conditional frequency of the distribution is equal to the signal instantaneous frequency [14]. Thus, it is possible to measure the Doppler parameters directly from WVD.
Figure 2 illustrates, as an ideal case, the difference in energy distribution of stationary target and moving target in time- frequency domain. The center positions of the energy distribution on frequency and time axis indicate the Doppler centroid and azimuth time (ie. the time of closest approach to the target.), respectively. After the proper signal spectrum from WVD is reconstructed along the Doppler history, it is possible to retrieve the target motion parameters from (5) and (7).
Figure 2. Energy distribution of stationary target and moving target in time-frequency domain
The real WVD, however, suffers from cross-term interference and aliasing which makes difficulties on extracting the proper signal. Furthermore, since the line of Doppler history slightly varies according to motion of the object, it is not possible to anticipate an exact slope of the line. Instead of searching the exact line, we first reconstruct the distribution of signal spectrum by picking-up maximum values at each time and frequency within only neighbouring areas of the expected Doppler history line, not entire range. By this approach, the aliased signal is placed in the proper position and the full Doppler history can be restored. A linear fit to this curve provides the Doppler frequency rate of a moving target, and hence the target moving velocity in azimuth direction can be retrieved.
The power spectrum of the restored Doppler history has a Gaussian-like distribution. In fact, the shape of spectrum depends on the window function in time domain (i.e. a
correlation of the time window function.). When no additional window is applied to the raw signal in azimuth dimension, the natural window function of SAR is a square of sinc function due to two-way antenna beam pattern. A correlation of sinc squared function is not an exact Gaussian function, but the shape is close enough to be modelled by a Gaussian function.
Curve-fitting to the projected power spectrum on frequency domain leaves also a Gaussian-like distribution, and the location of its center indicates the shifted Doppler centroid by target moving velocity in range direction. The maximum location of the projected power spectrum on time domain indicates, similarly, the original azimuth position of the moving target.
3. SIMULATION TEST AND ACCURACY ASSESSMENT
We simulated RAW data of SAR images of a moving target, and tested the proposed method to determine performance.
ENVISAT ASAR and TerraSAR-X stripmap mode were used for a point-target simulation, and their parameters are summarized in Table 1. Notice that a random noise was also added to the simulated data.. The noise power was set as 3dB below the peak of the signal. The simulated target is supposed moving at constant velocity from -30 m/s to 30 m/s (negative sign for heading toward the radar and positive for heading away as shown in Fig. 1), in 45° oblique direction with respect to the azimuth. Each simulation and estimation was repeated 10 times and the results were averaged, to exclude the randomness in measurement.
Table 1. Sensor model parameters for simulation.
Parameter ENVISAT ASAR TerraSAR-X
Carrier frequency 5.331 GHz 9.65 GHz Chirp bandwidth 1.6e+7 Hz 1.0e+8 Hz
Altitude 789 km 513 km
Look angle 20.1 deg. 35.6 deg.
PRF 1652.5 Hz 3815.5 Hz
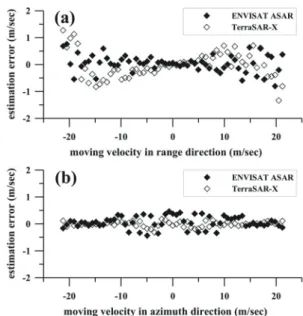
Figure 3. Simulation results for RAW data
It is the best to use range-compressed signals for the application. However, the raw signals or range-compressed signals are not always available according to the data
distribution sources. Two scenarios can be considered. The first case is that RAW data is available. Under this condition, the RAW data is range compressed first and the range migration is corrected using the migration factor of stationary target. From the azimuth line where the moving target resides, WVD is calculated. By measuring the centre of Doppler spectrum and the slope of Doppler history, range and azimuth component of target motion are retrieved, respectively. Figure 3 shows the estimation results on two velocity components, (a) in range direction and (b) in azimuth direction. For both cases, the absolute errors of the retrieved velocity are less than 5%. As the moving velocity increases, the errors also increase linearly due to the incomplete range migration correction. The residual range-migration results in asymmetry of the Doppler spectrum, which leads to a mismatch in a fitted curve of Gaussian model.
Second, if SLC product is given only, it is necessary to perform an azimuth decompression to the azimuth line in which a target resides. By this approach, the small amount of residual chirp induced by incomplete azimuth compression is restored into the full chirp signal. Concerning on the target bandwidth, the effect of Doppler windowing, which is normally done for image enhancement at the final stage of SAR processing just before the azimuth IFFT, is critical on this algorithm. If the windowing cuts the shifted target bandwidth induced by target motion in range direction, the information about target motion is distorted. Assuming that the Doppler windowing is not applied, we simulated SLC images and estimated two velocity components in the same way as the case of RAW data (see Figure 4). For both cases, the absolute errors are still less than 5%. Compared to the case of RAW data, the amount of errors in range direction are slightly increased, however, the linear trend of increasing error in azimuth direction is disappeared. This is due to the fact that the range bin containing the target in SLC is not coincident with the range bin containing largest energy distribution of the target (so-called range walk phenomenon).
As a result, when the range migration is strong due to the target’s fast moving motion, signals from SLC inversion would contain more accurate information about the target motion, especially on the Doppler frequency rate.
Figure 4. Simulation results for SLC data
4. PERFORMANCE OBTAINED ON REAL DATA We applied the proposed method to actual TerraSAR-X taken over Yeongjong Island, South Korea, on July 3rd, 2009.
To prevent the Doppler bandwidth loss during SAR image formation, the TerraSAR-X SLC image was exclusively processed with two specifications: A full azimuth processing bandwidth and without any windowing in Doppler dimension.
Truck-mounted corner reflectors were used as objects running straight along a coast road (see Figure 5). The truck was supposed to run 60 km/h based on the speedometer of the car dashboard without acceleration, while the speed measured by GPS car navigation system was 54 km/h. According to the sensor-target geometry, the velocity components in ground range and azimuth direction are 48.7 km/h and 23.4 km/h, respectively.
Figure 5. TerraSAR-X of July 3, 2009 when two truck-mounted corner reflectors were running at a speed of 54 km/h.
Note that the truck was imaged at a shifted position The extracted Doppler spectrum of target has an asymmetric distribution due to the partially overlapped signal centered at near zero Doppler induced from clutter bandwidth. The Doppler centroid of the target is measured by applying a partial Gaussian fit model at near the peak of the target spectrum, and the retrieved velocity in ground range is 45.72 km/h. For the estimation of Doppler frequency rate, an iterative linear fitting approach by excluding erroneous sample points over two sigma of standard deviation from initial fitting yields better result, and the retrieved velocity in azimuth was 22.62 km/h. In summary, the proposed method has a superb capability of retrieving a moving point with a significant backscattering contract with background.
5. CONCLUSIONS
This paper presents a novel method to retrieve velocity of moving targets on satellite SAR image. The method exploits the linear dependency of the Doppler parameters with the target moving motion deduced from analytic description of sensor- target geometry. A modified estimator of the target’s Doppler history in time-frequency domain is proposed and its effectiveness is illustrated through simulation tests and actual TerraSAR-X test. The accuracy depends on the precision of range migration correction. Basically, this is due to the fact that range migration is not only a function of target-sensor geometry, but also of the target motion and, therefore, the residual range migration after the correction leads to asymmetric Doppler spectrum. The proposed method gives promising results with errors less than 5% even when the residual range migration is exist.
ACKNOWLEDGEMENT
This work was funded by Korea Aerospace Research Institute within the framework of Development of KOMPSAT- 5 system. The TerraSAR-X data were provided to the author J.- S. Won as a TerraSAR-X Science Team Project (PI No.
COA0047). Authors sincerely appreciate the DLR TerrSAR-X Science Team for an exclusive signal processing of the TerraSAR-X data for this study.
REFERENCES
[1] Goldstein, R. M. and H. A. Zebker, 1987, Interferometric radar measurement of ocean surface currents, Nature, 328(20), pp. 707-709
[2] Shnitkin, H., 1994, Joint stars phased array radar antenna, IEEE Aerospace and Electronic Systems Magazine, 9(10), pp. 34-40.
[3] Barbarossa, S., 1992, Detection and imaging of moving objects with synthetic aperture radar - part I: optimal detection and parameter estimation theory, IEEE Proceedings of Radar and Signal Processing, 139(1), pp.
79-88.
[4] Freeman, A. and A. Currie, 1987, Synthetic aperture radar (SAR) images of moving targets, GEC Journal of Research, 5(2), pp. 106-115.
[5] Barbarossa, S. and A. Farina, 1994, Space-time-frequency processing of synthetic aperture radar signals, IEEE Aerospace Electronic Systems, 30(2), pp. 341-358.
[6] Moreira, J. R. and W. Keydel, 1995, A new MTI-SAR approach using the reflectivity displacement method, IEEE Geoscience and Remote Sensing, 33(5), pp. 1238-1244.
[7] Kersten, P. R., R. W. Jansen, K. Luc, and T. L. Ainsworth, 2006, Scene analysis of SAR images using joint time- frequency analysis, IEEE Proceeding of International Geoscience and Remote Sensing Symposium (IGARSS), Denver, Colorado, 31 July–4 August 2006, pp. 4176-4179.
[8] Chen, V. C., 2007, Joint time-frequency analysis for radar signal and imaging, IEEE Proceeding of International Geoscience and Remote Sensing Symposium (IGARSS), Barcelona, Spain, 23-27 July 2007, pp. 5166-5169.
[9] Kersten, P. R., R. W. Jansen, K. Luc, and T. L. Ainsworth, 2007, Motion analysis in SAR images of unfocussed objects using time-frequency methods, IEEE Geoscience and Remote Sensing Letters, 4(4), pp. 527-531
[10] Sparr, T., 2005, Moving target motion estimation and focusing in SAR images, IEEE Proceeding of Radar Conference, Arlington, VA, 9-12 May 2005, pp. 290-294 [11] Chen, V. C. and H. Ling, 2002, Time-frequency transforms
for radar imaging and signal analysis, Artech house, Inc.
[12] Sejdić, E., I. Djurović, and J. Jiang, 2009, Time-frequency feature representation using energy concentration: An overview of recent advances, Digital Signal Processing, 19(1), pp. 153-183.
[13] Gröchenig, K., 2001, Foundations of time-frequency analysis, Birkhäuser, Boston.
[14] Barbarossa, S. and A. Farina, 1990, A noble procedure for detecting and focussing moving objects with SAR based on the Wigner-Ville distribution, IEEE Proceeding of International Radar Conference, Arlington, VA, 7-10 May 1990, pp. 44-50.