1.
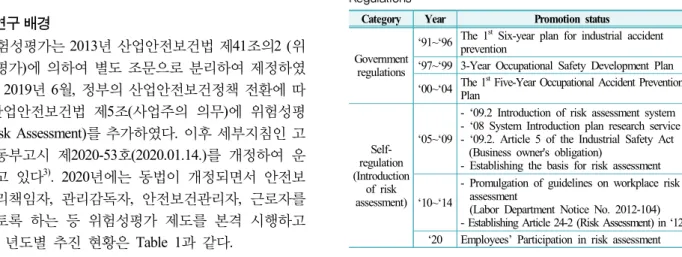
서 론 1.1 연구 배경위험성평가는 2013년 산업안전보건법 제41조의2 (위 험성평가)에 의하여 별도 조문으로 분리하여 제정하였 다1,2). 2019년 6월, 정부의 산업안전보건정책 전환에 따 라 산업안전보건법 제5조(사업주의 의무)에 위험성평 가(Risk Assessment)를 추가하였다. 이후 세부지침인 고 용노동부고시 제2020-53호(2020.01.14.)를 개정하여 운 영하고 있다3). 2020년에는 동법이 개정되면서 안전보 건관리책임자, 관리감독자, 안전보건관리자, 근로자를 참여토록 하는 등 위험성평가 제도를 본격 시행하고 있다. 년도별 추진 현황은 Table 1과 같다.
Table 1. Changes in Korea Occupational Safety and Health Regulations
Category Year Promotion status
Government regulations
‘91~‘96 The 1
stSix-year plan for industrial accident prevention
‘97~‘99 3-Year Occupational Safety Development Plan
‘00~‘04 The 1
stFive-Year Occupational Accident Prevention Plan
Self- regulation (Introduction
of risk assessment)
‘05~‘09
- ‘09.2 Introduction of risk assessment system - ‘08 System Introduction plan research service - ‘09.2. Article 5 of the Industrial Safety Act
(Business owner's obligation)
- Establishing the basis for risk assessment
‘10~‘14
- Promulgation of guidelines on workplace risk assessment
(Labor Department Notice No. 2012-104) - Establishing Article 24-2 (Risk Assessment) in ‘12
‘20 Employees’ Participation in risk assessment
***한국교통대학교 안전공학과 박사과정 (Department of Safety Engineering, Korea National University of Transportation)
***숭실대학교 안전⋅보건융학공학과 박사과정 (Department of Safety and Health Convergence Engineering, Soongsil University)
***한국교통대학교 안전공학과 교수 (Department of Safety Engineering, Korea National University of Transportation)
Vol. 36, No. 4, pp. 80-87, August 2021
https://doi.org/10.14346/JKOSOS.2021.36.4.80
ISSN 2383-9953 (Online) http://www.kosos.or.kr/jkosos
산업재해통계기반 Risk 산정에 관한 연구
우종권*⋅이미정*⋅설문수**⋅백종배***†
A Case Study on the Estimation of the Risk based on Statistics
Jong-Gwon Woo*⋅Mi-Jeong Lee*⋅Mun-Su Seol**⋅Jong-Bae Baek***†
†
Corresponding Author Jong-Bae Baek Tel : +82-43-841-5337 E-mail : [email protected] Received : July 6, 2021 Revised : August 6, 2021 Accepted : August 24, 2021
Abstract : Risk assessment techniques are processes used to evaluate hazardous risk factors in construction sites, facilities, raw materials, machinery, and equipment, and to estimate the size of risk that could lead to injury or disease, and establish countermeasures. The most important thing in assessing risk is calculating the size of the risk. If the size of the risk cannot be calculated objectively and quantitatively, all members who participated in the evaluation would passively engage in establishing and implementing appropriate measures. Therefore, this study focused on predicting accidents that are expected to occur in the future based on past occupational accident statistics, and quantifying the size of the risk in an overview. The technique employed in this study differs from other risk assessment techniques in that the subjective elements of evaluators were excluded as much as possible by utilizing past occupational accident statistics. This study aims to calculate the size of the risk, regardless of evaluators, such as a manager, supervisor, safety manager, or employee.
The size of the risk is the combination of the likelihood and severity of an accident. In this study, the likelihood of an accident was evaluated using the theory of Bud Accident Chainability, and the severity of an accident was calculated using the occupational accident statistics over the past five years according to the accident classification by the International Labor Organization.
Key Words : risk assessment, risk assessment system, risk, risk access, industrial safety and health regulatory policy, risk assessment
Copyright@2021 by The Korean Society
of Safety All right reserved.
사업장(기업)의 특성에 따라 위험성평가의 세부적인 방법과 절차 등이 다를 수 있기 때문에 정부의 지침으 로 규정하는 것은 어렵다. 특히, 위험성평가 절차 중 리스크를 산출하는 방법은 평가자마다 기준이 다르다. 따라서 사업장 특성을 고려한 리스크 산출 방법에 대 한 기준이 필요하다4-6). 따라서 신뢰성 있는 데이터를 사용하여 정량적으로 위험기준을 설정할 필요가 있다.
현재의 위험성평가 방법의 주요 문제점은 다음과 같다7).
• 이미 완료된 위험성평가 결정사항을 확인하기 위 한 위험성 평가 수행
• 사업장 현실에 맞지 않은 위험성 평가 수행
• 여러 요인을 고려하지 않고 한가지 위험만 고려
• 모든 구성원, 특히 관련 지식을 가진 직원을 포함 하지 않음
• 잠재된 위험을 식별하지 못함
• 발생 가능한 모든 결과를 완전히 이해하지 못함
• 부적절한 데이터 사용
• 위험의 기준을 잘못 설정
• 평가 결과에 대한 대책을 수립하지 않음
• 현장실정에 맞지 않은 대책 수립
위에서 언급한 위험성평가의 가장 큰 문제점은 ‘부 적절한 데이터 사용 및 잘못된 기준 설정’이다. 이는 실효성 등의 문제로 확대되어 위험성평가 결과의 신뢰 성을 떨어뜨릴 수 있다. 나아가 사업장에 존재하는 유 해위험요인을 방치하는 결과를 초래할 수 있다8).
고용노동부고시 제2020-53호(2020.01.14.) 지침에 따 라 리스크를 추정할 때에는 산재발생 통계자료를 활용 토록 하고 있다. 그러나 평가에 유의한 자료를 확보하 는 것이 어렵다. 즉, 사업장에서 활용이 가능한 자료가 적절하게 제시하고 있는지 자원의 활용성 측면에서 볼 때 아직 부족하다. 따라서, 고용노동부의 산업재해발생 통계자료를 이용하여 리스크를 산출하는 방법론을 연 구하고자 한다.
2.
연구 방법 2.1. 리스크 산출 방법론선행 연구를 검토한 결과, 정량적 위험성의 산출에 관한 연구는 확인하기 어려웠으며, 방법론에 대한 구 체적 기준 제시는 찾아보기 어렵다. 이와같이 리스크 를 객관적으로 정량화하는 것은 쉬운 일이 아니다9,10). 산업재해통계 기반 리스크 산출방법은 과거 산업재 해 발생 실태를 분석하여 리스크를 산출한다. 이때 주 의할 점은 설비, 장비, 기계 등 위험성평가 전에 방호
조치 설치 여부에 상관없이 리스크를 산출한다는 점이 다. 즉 기존 설비 등의 방호조치 실시 여부에 상관없이 재해통계를 기반으로 리스크를 산출한 후, 그에 맞는 대책을 수립해야 한다11).
산업재해보상보험법 적용사업체에서 발생한 4일 이 상 요양을 요하는 산업재해발생 통계 자료 중 충남지 역에서 발생한 과거 5년간(2015년~2019년) 산업재해 자료를 분석하여 리스크를 산출하였다12). 충남지역 제 조업 사업장수 14,476개소, 근로자수 250,669명이며, 그 중 충남 “전체 제조업” 재해발생건수 5,163건, “화학제 품제조업”에서 발생한 재해발생건수 611건을 대상으로 분석하였다.
먼저, 재해발생건수 611건을 각 발생형태별, 기인물 별, 재해발생비율을 조사한다. 가능성의 경우, 발생형 태를 감전, 깔림, 끼임, 넘어짐, 동물상해, 떨어짐, 무너 짐, 물체에 맞음, 부딪힘, 무리한 동상, 익사, 교통사고, 산소결핍, 이상온도 접촉, 절단, 베임, 폭발, 화재, 화학 물질 접촉 등으로 분류한다. 사고발생 기인물은 화합 물제조설비, 에너지, 지게차, 사람, 계단, 금속재료 등 131종으로 분류한다. 중대성은 재해발생형태에 따른 기인물 별 근로손실일수로 확인한다.
이 연구에서는 충남지역의 “화학제품제조업”에서 발생한 재해발생유형 분석에 초점을 맞추었다. 만약,
“화학제품제조업” 중에서 판정하고자 하는 유용한 재 해자료가 없는 경우, 충남지역 전체 제조업 중에서 발 생한 재해 유형을 참조하였다. 연구 범위를 충남지역 으로 한정한 것은 재해발생의 지역별. 업종별 특성을 고려한 것이다. 따라서 이 연구는 “충남지역 화학제품 제조업”의 위험성 산출에 적용한다.
2.2. 가능성(빈도)을 구하는 방법
가능성은 버드의 사고 연쇄성 이론을 적용하였다. 버드는 641건 중에서 상해·손실도 없는 사고 600건, 물 적손해 30건, 인적재해 10건, 경상 1건의 비율로 발생 한다고 신 연쇄성 이론을 주장하였다. 손실제어요인이 연쇄반응의 결과로 재해가 발생된다는 연쇄성이론을 제시하여 관리철저와 기본원인을 제거해야만 사고 예 방이 된다고 강조하였다13,14). 따라서 이 연구에서는 버 드이론의 역순인 사고가 발생할 가능성이 높은 사고 비율에 높은 등급의 점수를 부여하였다. 물적, 인적손 실별 건수보다는 전체 사고의 발생빈도에 따라 버드이 론적용을 적용하였다. 상해 등 중상을 발생시키지 않 기 위해서는 사고발생 빈도가 높은 상해·손실도 없는 사고가 발생하지 않아야 한다. 즉 발생건수가 높기 때 문에 가능성을 높이 평가하는 것이다. 아래 Table 2는
Table 2. Types of industrial accidents in the chemical and manufacturing industries
likeli
-hood Total types of accidents in chemical and manufacturing
industries over the past five years (2015~2019) Bird theory Application 5 The accident type which is more than 93.6% in chemical
and manufacturing industries in the last 5 years
600/641
*100
4 The accident type which is within the range of 4.68%
in chemical and manufacturing industries in the last 5 years
30/641
*100
3
The accident type which is within the range of 1.56%
in chemical and manufacturing industries in the last 5 years
10/641
*100
2 The accident type which is one or within the range of 0.16% in chemical and manufacturing industries in the last 5 years
1/641
*100
1 The accident type has not occurred in chemical and manufacturing industries in the last 5 years No
Accident
Table 3. Likelihood (frequency) grade base (%) Apply as a ratio to the possibility rating and
the number of accidents example
1/641*
100(%)
1 2 3 4 5
~0.16 0.17~1.56 1.57~4.66 4.67~93.60 93.67~100
충남지역 화학업종의 버드이론을 적용한 가능성 등급 이고, Table 3은 1~5등급으로 구분하기 위한 기준비율 이다.
2.3. 중대성(강도)을 구하는 방법
중대성(강도)의 개념은 재해 1건당 발생할 수 있는 근로손실일수로 정하였다. 근로손실일수 산정기준은 국제노동기구(ILO : International Labour Organization)의 재해구분에 따라 영구 전 노동불능, 영구 일부 노동불능, 일시 전 노동불능, 일시 일부 노동불능, 구급처치 상해 로 구분할 수 있다. 국제노동기구(ILO)에 의한 구분에 따라 영구 전 노동불능(사망 및 1~3등급)은 가장 높은
Table 4. Accident classification by the international labor organization (ILO)
Category Rating guideline
Injury resulting permanently entire incapacity for work
Completely loss of labor function as a result of injury (Physical disability grades 1 to 3)
Injury resulting permanently some incapacity for work
Loss some parts of the body and parts of the work function as a result of injury
(Physical disability grades 4 to 14) Injury resulting
temporary entire incapacity for work
As per the results of a doctor's diagnosis, can not work for a certain period of time (Away from work without physical disability)
Injury resulting temporary some incapacity for work
Cases other than away from work (Injury resulting temporarily away from work for the medical treatment during working hours)
First-Aid injury Injury can be covered by first aid or medical treatment
Table 5. Consequence based on severity (number of work losses) Consequence level Physical disability grade Labor loss days
4 Death and grades 1 to 3 7,500days
3 grades 4 to 14 50~5,500days
2 temporary or some parts of
incapacity for work 7~49days 1 First-aid injury or No injury 0~6days
4등급, 영구일부노동불능(4~14등급)은 3등급, 일시일부 노동불능, 응급조치 및 미상해로 구분하여 근로손실일 수를 정하였다. Table 4는 위험성 등급을 분류하기 위 한 기준이며, Table 5는 등급분류기준에 따른 1~4등급 의 분류 결과이다.
2.4. 리스크 산출(중대성과 가능성을 조합)
파악된 리스크는 피해의 중대성과 가능성의 결과이 다. 산재통계기반 위험성평가도 다른 위험성평가 개념 은 같다. 따라서 리스크 매트릭스도 다른 위험성평가 개념과는 유사하다. 다만 리스크를 산업재해통계를 기
Likelihood
1 2 3 4 5
No Accident 1/641*100 10/641*100 30/641*100 600/641*100
Severity (consequences)
1
First-aid injury and No injury
(0~6days) 1 2 3 4 5
2
temporary or some parts of incapacity for work
(7~49days) 2 4 6 8 10
3 Serious Injury
(50~5,500days) 3 6 9 12 15
4 Death
(7,500days) 4 8 12 16 20
Table 6. Risk assessment metrics(1/2)
반으로 객관적으로 반 정량화하였다는 점에서 다른 위 험성크기 산출과는 다르다고 할 수 있다. Table 6은 중 대성과 가능성 매트릭스이며, Table 7은 매트릭스를 조 합한 결과이다.
앞에서 언급한 위험성크기 산출방법론을 요약하면 다음과 같으며, 절차는 Fig. 1과 같다.
① 충남지역 및 전국 “화학제품제조업” 산업재해 통 계를 분석한다.
- 충남지역 화학제품제조업에서 구하고자 하는 대상(기인물)이 없을 경우 더 큰 모수집단이 전체 제조업에서 대상을 찾는다.
② 가능성(빈도)을 산출한다
- 버드의 사고 연쇄성 이론을 적용한다.
- 1:10:30:600의 사고 비율에 따른 발생비율을 계 산한다.(600/641*100, 30/641*100, 10/641*100, 1/641*100, No Accident)
- 위험도계산을 위한 백분율을 확인(기인물/발생 형태*100)한 후 등급을 산정한다.
- 빈도 등급은 발생비율에 따라 각각 1~5등급으 로 분류한다.
- 등급선택 기준 : 1순위 –화학제조업 / 2순위 – 전체제조업(화학제조업에 해당 없을 시)
③ 중대성(강도)을 산출한다.
- ILO의 재해 구분에 따라 재해 1건당 발생할 수 있는 근로손실일수 기준으로 한다.
- 신체장애 등급에 따라 사망 및 1~3등급(7500 일), 4등급~ 14 등급(30~5500일), 일시일부 노 동불능(7일~ 49일), 응급조치 및 미상해(0~6일) 등으로 구분한다.
- 위 등급기준에 따라 각각 1~4등급으로 구분한다.
- 등급선택 기준 : 1순위 – 화학제조업 / 2순위 – 전체 제조업(화학제조업에 해당 없을 시)
④ 가능성과 중대성을 조합하여 리스크를 산출한다.
Fig. 1. Risk assessment methodology based on industrial accident statistics.
3.
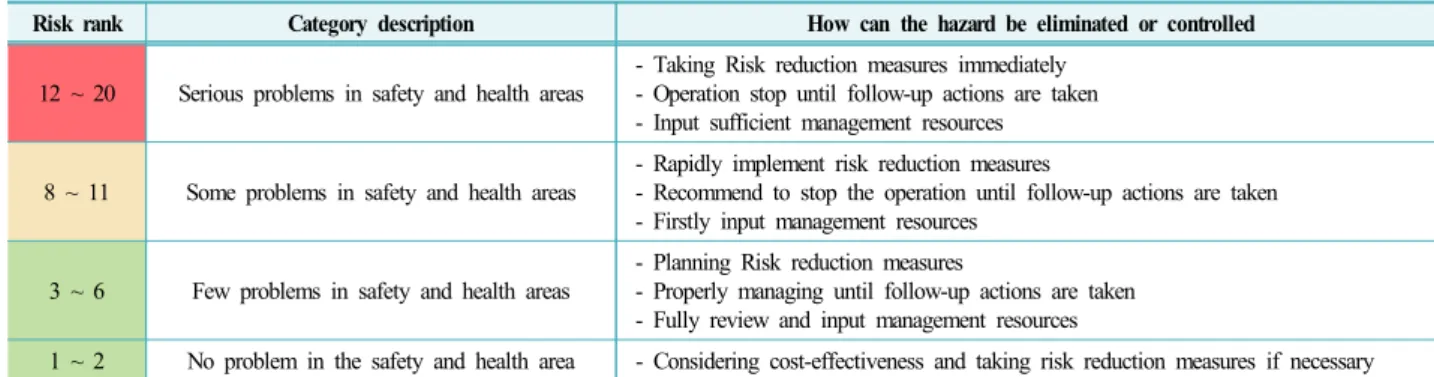
사례연구가능성은 노출빈도, 시간, 유해⋅위험한 사건의 발생 확률, 피해의 회피⋅제한 등을 고려하고, 중대성은 부
Risk rank Category description How can the hazard be eliminated or controlled
12 ~ 20 Serious problems in safety and health areas
- Taking Risk reduction measures immediately - Operation stop until follow-up actions are taken - Input sufficient management resources
8 ~ 11 Some problems in safety and health areas
- Rapidly implement risk reduction measures
- Recommend to stop the operation until follow-up actions are taken - Firstly input management resources
3 ~ 6 Few problems in safety and health areas
- Planning Risk reduction measures
- Properly managing until follow-up actions are taken - Fully review and input management resources
1 ~ 2 No problem in the safety and health area - Considering cost-effectiveness and taking risk reduction measures if necessary
Table 7. Risk assessment metrics(2/2) : Initial risk actions/risk acceptance authority
상의 정도, 후유장해 유무, 피해의 범위 등을 고려하여 판단한다. 위험성평가의 성공여부는 잠재된 유해위험 요인의 확인 및 대책의 적정성이다. 즉 리스크 여부에 대한 평가실시 사업장의 구성원 간 공감대 형성이다.
3.1. 가능성(빈도) 산출
만약 어느 사업장에서 평가자가 “지게차에 부딪힘”
사고 발생 잠재 위험성을 발견하였다면, 가능성(빈도) 결정은 다음과 같이 구한다.
① 화학제품제조업 중 과거 5년간 재해통계결과에 따라 화학제품제조업 중 전체 부딪힘 재해 49건 중 지게차에서 부딪힌 재해 20건을 확인한다.
② 기인물 및 발생유형에 대한 백분율을 계산한다.
(지게차 부딪힘 기인물/발생유형*100=40.8%)
③ 백분율 값에 적용된 등급을 확인한다.
④ 빈도 결정 후 위험성평가 항목에 40.8%에 해당하 는 등급을 Table 3에서 찾아 4등급으로 판정한다.
위 내용을 정리하면 Table 8과 같다.
아래 Table 9는 충남지역 화학제품제조업에서 기인 물 전체 재해 611건 중 “지게차에서 부딪힘” 재해 49 건을 나타낸 것이고, Table 10은 충남지역 전체 제조업 재해 5,163건 중 “지게차에서 부딪힘” 380건을 나타낸 다. 만약 Table 9의 화학제품제조업 중 지게차에서 부
딪히는 재해가 없다면 Table 10에서 전체 제조업 중에 서 지게차에서 부딪히는 재해를 찾아가는 것이다. 화 학제품제조업에서 발생한 재해가 없는 경우에도 더 큰 모수인 전체 제조업에서는 재해발생 근거를 확보할 수 있기 때문이다.
3.2. 중대성(강도) 산출
중대성은 가능성을 구할 때와 같은 방법으로 Table 11의 화학제품제조업 지게차에서 부딪히는 재해를 찾 고, 유용한 자료가 없다고 가정하면 Table 12의 전체 제조업 중 지게차에서 부딪힌 재해를 찾아 근로손실일 수를 찾아가는 것이다. “지게차에 부딪혔을 경우” 평균 근로손실 일수는 Table 11에서 166일이므로 위 Table 5 의 등급기준에 따라 3등급으로 판정한다.
3.3. 리스크 산출
결론적으로 화학제품제조업의 “지게차에 부딪히는 재해”에 대한 리스크는 가능성(빈도) 등급은 4이며, 중 대성(강도) 등급은 3이다. 따라서 Table 6, 7의 조합된 매트릭스에 따라 평가점수가 12점 이상이므로 위험성 감소조치를 즉시 실시, 개선 조치를 실시할 때까지 작 업을 중지, 충분한 경영자원을 투입 등 안전대책을 신 속하게 해야 한다.
① Checking accident-caused objects and types in the chemical manufacturing
▸ Rank 1 chemical manufacturing industry
▸ Rank 2 Overall Manufacturing (If not applicable to chemical manufacturing)
② Checking the percentage figure of accident-caused objects and types
▸ Accident-caused objects / types * 100
▸ example) Forklift_Collision (20/49*100 = 40.8%)
③ Checking the rating of the frequency applied to the percentage figure
④ Risk assessment item rating after frequency determination
Likelihood Sum Collision
Total (Number of cases) 611 49
Work Plate 7 1
electricity Facilities 1 0
Forklift 31 20
Conveyor 14 0
Table 9. Number of accidents by types of chemical industries(Chungcheongnam –do)
Likeli
-hood Total Electric shock Etc
Falling
&
flipping Entrap
-ment Falling Dropped CollapseFits an
objectCollisionUnclassi -fied
Unbalanced andunreason ablebehavior
Traffic accident s
Abnor mal temp.
contact Work related Illness
Cutting
&
stabbing Occupa-
tional Disease
Pneumo -coniosis Sport
event An act of violenceExplosion
&rupture Fire Chemical leakage &
contact
Total 611 3 1 15 252 48 50 3 36 49 2 7 9 20 35 45 2 1 7 1 5 9 11
Forklift 31 2 2 6 1 20
Table 10. Number of accidents by types of manufacturing industries(Chungcheongnam–do)
Likeli -hood Total
Electri c shock
Buildi ng, Struct ure &
Surfac es
Trans portat on
Etc Fallin
g &
flippin g
Entrap mentFalling
Anima l injury
Dropp ed Collap
se Fit an objectCollisi
on Materi als Uncla
ssified Unbal anced
&
unreas onable behavi or
Anima ls
Traffic accide
nts outsid
e Traffic accide nts in the workp
lace) Oxyge
n deficie
ncy Facilit ies&m achine ry
Contai ners, suppli es, furnitu re&ap pliance
Abnor mal temp.
contac t
Cuttin g, cuttin
g, stabbi
ng Sport event
An act of violen
ce Explo
sion
&rupt ure
Fire Chemi
cals and Chemi
cals Chemic
al leakage
&
contact Portabl
e and Human Mecha
nical Instru ments
Total 5,163 18 218 47 2 126 1,606 391 7 332 13 321 380 244 20 93 10 4 57 1 538 75 102 296 76 12 17 24 2 26 105
Forklift 197 7 38 1 17 1 13 73 1 45 1
Table 8. Likelihood (frequency) determination flowchart
4.
연구결과 및 고찰위험성평가가 사업장에 뿌리내리기 위해서는 신뢰 성 있는 데이터를 통한 잠재된 유해위험요인 파악이다. 즉 신뢰성 있는 데이터 활용하여 리스크의 적정성을 확보하고 공감대를 형성해야한다15). 그리고, 대책을 수 립하고 시행하는 것이 위험성평가를 활성화하는 것이 다. 재해통계를 기반 리스크 산출 결과의 신뢰성 제고 를 위한 주요 수행방법은 다음과 같다.
첫째, 재해가 반복되는 특성을 고려하여 과거의 산업 재해 발생 기인물별, 발생형태별 분석을 통하여 기계기 구, 설비 등 작업특성과 부상의 유형을 분석하였다.
둘째, 가능성과 중대성의 크기를 판단할 수 있는 기 준을 제시하였다. 버드이론을 이용 빈도율을 산출하고, ILO 재해구분에 따른 근로손실일수에 따라 강도율을 산출하여 리스크를 정량화하였다.
셋째, 사례연구에서 나타난 것과 같이 기계적, 전기 적 요인보다 화학적 요인의 위험성을 크게 평가하는 것과 같은 평가자의 주관적 요소를 가급적 배제하였다.
사례연구를 통한 연구결과는 Table 13과 같다. 기계 적 요인 10건, 전기적 요인 2건, 화학적 요인 4건 등 총 16건에 대한 위험성평가를 실시하였다. 그 결과 재해 통계기반 위험성평가 방법이 기존의 평가방법(4M, KRAS)보다 리스크가 높게 나타났다16). 기존의 방법이 나 재해통계기반 평가 방법 중 어느 것이 맞다고 할 수 없다. 각 평가방법마다 장단점이 있기 때문이다. 특이 한 점은 화학적 요인 평가는 평가대상 4건의 유해위험 요인 중 3건이 기존의 방법으로 평가한 결과가 높게 나타났다. 이러한 결과는 화학사고의 위험성, 언론보 도, 피해범위 등 평가자의 주관적인 요소가 평가에 반 영되고 있는 결과임을 확인하였다.
Table 13. Risk assessment examples
Identifying Hazardous Risk Factors
4M(3*3) KRAS(Korea Riskassessments
ystem)(5*4)
Risk assessment based on industrial
accident statistics(5*4) Classification Cause Hazardous Risk
Factors likeli hood Sev
erity Risklikeli hood Sev
erity Risk
1. Mechanical (Facility)
Factors
Dangerouspart softhemachine (equipment)
(fall, rain, rollover, collapse, evangelism)
Falling into vehicle movement during
loading 1
2 2
3 2
6 2 3 6
Loaded while unloading tank lorry 1
2 2
3 2
6 4 2 8
PumpCompressorTr appedinRotation 3
5 1
1 3
5 2 3 6
Adhesion/Cutting by
Cutter 3
5 1
1 3
5 2 3 6
PumpRotation/Roun d-RoundSqueeze 3
5 1
1 3
5 3 2 6
Upper Temperature Contact Around
Reactor
12 2
3 2
6 2 2 4
Workshop Hazardous Part
Pipingjamonworksh op(outdoor)floor 3
5 1
1 3
5 4 3 12
Conduction by contaminated floors. 3
5 1
1 3
5 4 4 16
Forklift Hazardous Part
Forklift truck hit object in motion 3
5 1
1 3
5 3 3 9
Loads Falling During
Travel 3
5 1
1 3
5 4 3 12
Forklift Collision 3
5 1
1 3
5 4 3 12
Carried on forklift 3
5 1
1 3
5 4 4 16
Forklift Truck
Falling 3
5 1
1 3
5 2 3 6
2. Electrical Factors
Electrostatic Hazardous
Parts electrical work dangerous part
Staticignitionduringl oading :Flammableliquid(or
ganicsolvent) 1
2 2
3 2
6 3 2 6
Electric shock caused by electrical
equipment 1
2 2
3 2
6 4 3 12
3. Chemical (material)
factors
Chemical Work Hazardous Part
Ignition of Flammable Liquid
Vapor In-Reactor Contact
23 3
5 6
15 2 3 6
Fire from outside into
tank 2
3 3
5 6
15 3 3 9
Firearms work in the workplace. 2
3 3
5 6
15 3 3 9
Contact at high temperature, etc. in a gas welding system.
1
2 2
3 2
6 4 3 12
Severity Total Electric shock Etc Falling
&
flipping Entrap
-ment Falling Dropped CollapseFits an
object CollisionUnclassi -fied
nbalanced andunreas onablebeh avior
Traffic accidents
Abnormal temp.
contact Work related Illness
Cutting
&
stabbing Occupa-
tional Disease
Pneumo -coniosisSport
event An act
of violenc
e Explosion
&rupture Fire Chemical leakage &
contact
Total 450 2,551 614 646 501 127 334 109 347 201 75 1,254 212 1,246 137 103 2 126 21 112 1,757 85
Forklift 398 3,804 176 166 68 166
Table 12. Number of working loss days by type of manufacturing industries(Chungcheongnam –do)
Likeli -hood Total
Electri c shock
Buildi ng, Struct ure &
Surfac es
Trans portati
on Etc Fallin g&flip ping
Entrap mentFallin
g Anim
al injury
Dropp ed Collap
se Fit an objectCollisi
on Materi als Uncla
ssified Unbal anced
&unre asona ble behavi
or Anim
als Traffi
c accide
nts outsid
e Traffi
c accide
nts in the workp
lace) Oxyge
n deficie
ncy Facilit ies&m achine ry
Contai ners, suppli es, furnit ure&a pplian ce
Abnor mal temp.
contac t
Cuttin g&
stabbi ng
Sport event
An act of violen
ce Explo
sion
&rupt ure
Fire Chemi
cals and Chemi
cals Chemi
cal leakag
e &
contac t
Portab le and Human Mecha nical Instru ments Total 311 533 192 485 387 530 345 147 118 329 1,833 214 227 143 2,372 119 112 255 1,2727,500 410 232 210 159 329 721 581 1,697 168 127 152
Forklift 480 3,307 197 53 190 7,500 146 461 361 374 318
Table 11. Number of working loss days by type of chemical industries(Chungcheongnam–do)
즉 작업과 관련된 익숙한 부분은 과소평가하고 그렇 지 않은 부분은 과대평가로 나타날 수 있다. 또 과대평 가 되는 것이 반드시 나쁜 것은 아니다. 폭발, 화재와 같은 사고유형은 빈도가 낮지만 강도는 높게 나타날 수 있다. 이러한 결과는 위험성평가 결과 후 추가로 사 업장 내 또는 외부의 전문가의 판단이 반영되어 한층 더 작업에 주의할 수 있기 때문이다.
기존의 위험성평가 방법과 재해통계 방법의 가장 큰 차이점은 중대성과 가능성의 등급기준의 적용이다. 기 존의 방법에 의한 중대성은 등급기준 적용 시 치명적, 중대, 중등정도, 경상으로 분류하였다, 가능성은 매우높 음, 높음, 보통, 낮음, 매우낮음으로 분류하여 평가자마 다 주관적이다. Table 14는 기존의 일반적인 방법이다.
재해통계기반 위험성평가는 과거 재해발생통계를
Table 14. Estimation and determination table of right-hand estimates by multiplication formula
Likelihood(Example)
Sortation Likelihood Content
Very high Very unlikely 5 Very likely to cause damage Medium Unlikely 4 Damage is likely to occur Medium Possible 3 Carelessness can cause damage
Low Likely 2 Less likely to cause damage Very low Very likely 1 Very unlikely to cause damage
Consequence(Example)
Sortation Consequence Content
Maximum Death (Disability Occurred) 4 Very likely to cause damage Large Closed (Injury/Dis-ease) 3 Damage is likely to occur Medium Hospital Treatment 2 Carelessness can cause damage
Small Untreated 1 Less likely to cause damage
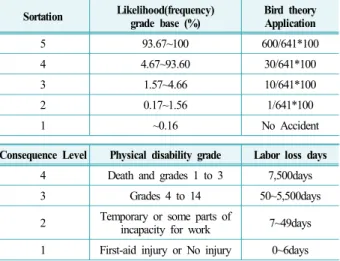
Table 15. Risk Rating Criteria Based on Industrial Accident Statistics
Sortation Likelihood(frequency) grade base (%)
Bird theory Application
5 93.67~100 600/641*100
4 4.67~93.60 30/641*100
3 1.57~4.66 10/641*100
2 0.17~1.56 1/641*100
1 ~0.16 No Accident
Consequence Level Physical disability grade Labor loss days
4 Death and grades 1 to 3 7,500days
3 Grades 4 to 14 50~5,500days
2 Temporary or some parts of
incapacity for work 7~49days 1 First-aid injury or No injury 0~6days
기반으로 한다. 가능성은 버드의 사고 연쇄성 이론을 적용한 재해발생건수에 등급적용, 중대성은 ILO의 재 해구분에 따라 평균근로손실일수로 등급을 적용한 점 이다. Table 15는 재해통계기반에 의한 방법이다.
5.
결 론재해발생 매카니즘 중 작업자의 지식의 결여, 태도 불량, 불안전한 속도조작 등 불안전한 행동으로 인한 잠재재해는 위험성평가에 반영하기 어렵다. 이러한 경 우에는 유사한 기인물을 찾아 리스크를 산출하거나, 자체적으로 갖고 있는 유의한 자료, 경험 등을 고려하 여야 한다. 즉 위험성이 통계자료가 있지 않은 경우에 도 일정한 근거가 있는 경우에는 그 근거를 기초로 하여 위험성이 존재하는 것으로 리스크를 산출하여야 한다.
산재통계기반 위험성평가의 특징은 과거 재해사례 를 바탕으로 실질적인 잠재위험의 크기를 숫자로 표 현한다. 위험성 기준을 가급적 명확히 설정하고자 하 는 것이다. 즉 위험성의 상대적 크기를 예측하는 것까 지를 포함한다. 재해는 반복되는 특성이 있다. 그러나 사업장에서 활용이 가능한 자료가 적절하게 사용되고 있는지에 대한 검토가 필요하다. 재해통계기반 위험성 평가는 기존의 작업 위험성평가 보다 구체적으로 리 스크를 산정할 수 있다. 즉 중대성과 가능성의 크기를 과거 발생한 산업재해통계를 기반으로 어느정도 정량 화 하였다는 점에서 다른 위험성평가와 다르다고 할 수 있다.
이 연구는 사업장에서 사용하는 작업과 관련된 위험 성평가의 한 예이다. 향후 더 많은 위험성 평가 기준 자료를 기반으로 하는 위험성평가 사례 연구 또 다른 척도를 사용할 수 있는 근거자료를 찾아서 보완되어야 할 것이다.
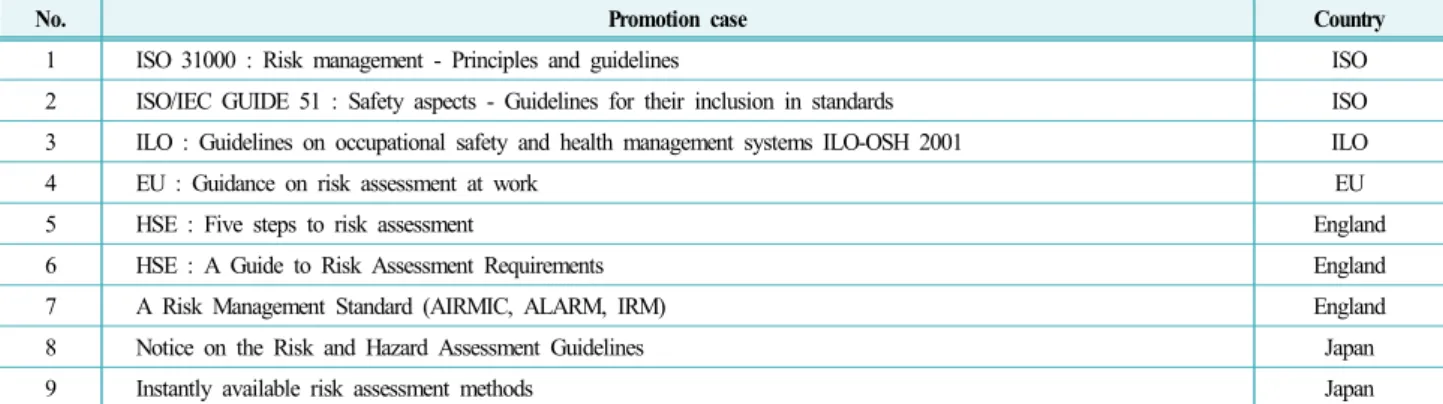
위험성평가는 국제적으로 표준화된 안전관리기법으 로 자리 잡았다고 할 수 있다. 외국의 경우 정부에서 중대성과 가능성의 등급기준을 제시하고 각 사업장에 서 그 특성에 맞는 매트릭스를 사용 위험성을 결정한 다. 예를 들어 “A”사의 경우, 위험이 미치는 영역을 크 게 사람, 자산, 환경, 평판 4가지로 분류한다. 각 영역 별 분류기준은 과거 발생된 사고들의 정량적 분석을 통해 구축된 Database를 통하여 가능성과 중대성의 기 준을 수립한다. 해당 가중치 별로 각 단계별 최종 승인 권자를 직급별로 다르게 둔다. 책임자의 승인을 통해 즉각적인 위험 제거 및 위험 통제 범위를 정한다. 그리 고 위험을 수반한 상태에서의 실행 가능 여부를 확정
하게 구성한 것이 특징이다. 따라서 우리나라도 이러 한 국제적 흐름에 맞게 위험성평가가 사업장의 자율적 안전보건활동을 활성화하는 수단이 될 수 있도록 사업 장 실정에 맞는 평가 방법이 필요할 것이다. Table 16 은 주요국의 추진사례이다.
References
1) N. K Park, Korea Occupational Safety and Health Agency, A Study on the Development of Risk Assessment System for Risk Assessment “Presentation data”
2) J. B. Baek, “A Study on Reinforcing Method of Risk Assessment”, Korea Occupational Safety and Health Agency, p. 59, 2015.
3) Ministry of Employment and Labor Notice, Guidelines on the Risk Assessment of Business Sites 2020-53 (Amendment 2020.1.4.)
4) J. W. Jung, “A Study on the Implementation of Risk Assessment System at Workplace in Korea”, J. Korean Soc. Saf., Vol. 29, No. 3, pp. 121-126, 2014.
5) Georgi Popov, Bruce K, Lyon, “Risk Assessment: A practical Guide to Assessing Operational Risk”, Wiley, 2015.
6) J. T. Song, “Risk Assessment and Analysis Techniques”, Seongandang, pp. 101-344, 2017.
7) Step Change in Safety, Task Risk Assessment Guide GUIDE, 2007.(ISBN-10 : 1905743122)
8) D. Y. Park et, “Development and Introduction of an OSH
Regulatory Framework Based on Risk Assessment for Korean OSH Regulation Systems and Policy”, Korea Occupational Safety and Health Agency, pp. 309-310, 2009.
9) J. G. Kang, “A Study on the Practical Application of Risk Assessment for Medium and Small-sized Manufacturing Industry”, Master's Thesis of Korea National University of transportation, pp. 43-49, 2018.
10) The Korea Occupational Safety and Health Agency, “Risk Assessment Guidelines Manual”, 2020.
11) Kawakami Tsuyoshi, “Risk Assessment At Workplace”, Hanwool Academy, pp. 94-101, 2009.
12) Ministry of Employment and Labor, Current status of industrial accidents Statistics, 2015-2019.
13) Martin Anderson and Michael Denkl, “The Heinrich Accident Triangle - Too Simplistic A Model For HSE Management in The 21st Century?”, Society of Petroleum Engineers, 2018.
14) Hughes, Phil and Ferrett, “Introduction to Health and Safety at Work”, Elsevier, p. 86, 2009.(ISBM-10 : 1856176681)
15) I. J. Shin, “Comparative Study on the Institutional Framework of Risk Assessment between German, UK and Korea, Japan in Asian Countries”, J. Korean Soc. Saf., Vol.
28, No. 1 pp. 152-153, 2013.
16) The Korea Occupational Safety and Health Agency,
“KRAS Risk Assessment Support System”, Kras.kosha.or.kr