Background and Purpose The risks of falls and fractures increase after stroke. Little is known about the prognostic significance of previous falls and fractures after stroke. This study examined whether having a history of either event is associated with poststroke mortality.
Methods We analyzed stroke register data collected prospectively between 2003 and 2015.
Eight sex-specific models were analyzed, to which the following variables were incrementally added to examine their potential confounding effects: age, type of stroke, Oxfordshire Commu- nity Stroke Project classification, previous comorbidities, frailty as indicated by the prestroke modified Rankin Scale score, and acute illness parameters. Logistic regression was applied to investigate in-hospital and 30-day mortality, and Cox proportional-hazards models were ap- plied to investigate longer-term outcomes of mortality.
Results In total, 10,477 patients with stroke (86.1% ischemic) were included in the analysis.
They were aged 77.7±11.9 years (mean±SD), and 52.2% were women. A history of falls was present in 8.6% of the men (n=430) and 20.2% of the women (n=1,105), while 3.8% (n=189) of the men and 12.9% of the women (n=706) had a history of both falls and fractures. Of the out- comes examined, a history of falls alone was associated with increased in-hospital mortality [odds ratio (OR)=1.33, 95% confidence interval (CI)=1.03–1.71] and 30-day mortality (OR=1.34, 95%
CI=1.03–1.73) in women in the fully adjusted models. The Cox proportional-hazards models for longer-term outcomes and the history of falls and fractures combined showed no significant re- sults.
Conclusions The history of falls is an important factor for acute stroke mortality in women. A previous history of falls may therefore be an important factor to consider in the short-term stroke prognosis, particularly in women.
Key Words stroke, falls, fractures, mortality, prognosis.
A History of Falls is Associated with a Significant Increase in Acute Mortality in Women after Stroke
INTRODUCTION
Stroke and falls have a large impact on society. Stroke is the second largest cause of death and the leading source of disability,1 and the lasting neurological symptoms of stroke could increase the risk of falls.2,3 It is well established that falls are associated with increased mor- bidity and mortality. People who experience falls are also more likely to have other chronic conditions such as diabetes, arthritis, osteoporosis, and indeed stroke,4,5 all of which contrib- ute to a pre-existing increased risk of falls,3 with some of these morbidities also being risk factors for stroke.
While it is recognized that falling after stroke increases mortality, little is known about the effects of previous falls or low-trauma fractures on mortality after stroke. While low bone mineral density has been linked to stroke incidence6 and is a strong factor associated with fracture risk,4,5,7 the links between previous falls and low-impact fractures on mortali- Emma J. Fostera
Raphae S. Barlasa Adrian D. Wooda
Joao H. Bettencourt-Silvab,c Allan B. Clarkc
Anthony K. Metcalfb,c Kristian M. Bowlesb,c John F. Potterb,c Phyo K. Myinta,c
a Institute of Applied Health Sciences, School of Medicine, Medical Sciences &
Nutrition, University of Aberdeen, Aberdeen, UK
b Norfolk and Norwich University Hospital, Norwich, UK
c Norwich Cardiovascular Research Group, Norwich Medical School,
University of East Anglia,
Norwich Research Park, Norwich, UK
pISSN 1738-6586 / eISSN 2005-5013 / J Clin Neurol 2017;13(4):411-421 / https://doi.org/10.3988/jcn.2017.13.4.411
Received December 19, 2016 Revised June 29, 2017 Accepted June 29, 2017 Correspondence Phyo K. Myint, MD
Institute of Applied Health Sciences, School of Medicine, Medical Sciences &
Nutrition, University of Aberdeen, Room 4:013 Polwarth Building, Foresterhill, Aberdeen, AB25 2ZD, UK Tel +44 (0) 1224 437841
Fax +44 (0) 1224 437911 E-mail [email protected]
cc This is an Open Access article distributed under the terms of the Creative Commons Attribution Non-Com- mercial License (http://creativecommons.org/licenses/by-nc/4.0) which permits unrestricted non-commercial use, distribution, and reproduction in any medium, provided the original work is properly cited.
JCN
Open Access ORIGINAL ARTICLEHistory of Falls and Poststroke Mortality
JCN
ty outcomes after stroke remain unclear. Identifying such links may have important prognostic implications, including for identifying those patients with stroke who require targeted in- tervention.
The aim of the current study was therefore to determine whether a history of falls or a history of falls and fractures is associated with immediate mortality and predicts longer- term mortality after stroke.
METHODS
Study population
The study population was drawn from the Norfolk and Nor- wich University Hospital Stroke and Transient Ischaemic At- tack Register (NNSTR) in East Anglia, UK, which has a catch- ment population of approximately 750,000 people. The NNSTR was set up in late 1996, with regular annual record linkage of comorbid conditions and mortality status after stroke, thereby providing a unique opportunity to examine the outcomes of these patients over a long-term follow-up. The register re- ceived research database ethical approval from the Newcastle and Tyneside National Health Service and the Research Eth- ics Committee (approval no. 12/NE/0170). The study proto- col was approved by the Steering Committee of the Register.
Data collection
The data collection methods have been described previous- ly.8-10 In brief, the data entry team entered paper and elec- tronic records into the stroke register database prospective- ly, under supervision by clinicians. Patients were included if they had a confirmed ischemic or hemorrhagic stroke based on clinical examinations, the medical history, and neuroim- aging results. Only the first recorded stroke in the database was used in the analysis of each patient. The prestroke modi- fied Rankin Scale (mRS) score is commonly used to mea- sure the level of disability (with 0 indicating no disability, 5 indicating severe disability and requiring constant nursing care, and 6 indicating being dead), and it was confirmed from medical records or from the history as reported by patients and relatives.
The predicting variables used in the study were a history of falls and a history of falls and fractures. A history of falls or fractures was defined as either event occurring before the date of the stroke event. This indicated that falls occurred in women at a median of 1.44 years before their stroke [inter- quartile range (IQR)=3.72 years] while fractures occurred at a median of 2.24 years (IQR=4.54 years); the corresponding values for men were 1.16 years (IQR=3.21 years) and 1.50 years (IQR=4.24 years), respectively. The International Clas- sification of Diseases tenth revision (ICD-10) codes for the
occurrence of falls were W00 to W19, while those for frac- tures were ICD-10 codes S82, S72, S62, S52, S42, S32, S22, S12, S02, T14.2, and T10. Patients who had a history of frac- tures were only included if they also had a history of falls, since the fractures were then more likely to be associated with low-trauma (i.e., fractures associated with falls and therefore frailty, not high energy trauma).
Statistical analysis
The statistical analysis was performed using SPSS Statistics (version 24, IBM Corp., Armonk, NY, USA). In the analysis we used sex-specific data to fully examine the effects of a his- tory of falls and fractures stratified according to sex, since women are more likely to fall than men and are also more prone to osteoporosis.3,4 Descriptive statistics were calculat- ed separately for men and women, with and without a history of falls or a history of falls and fractures. Continuous variables are presented as mean±SD values, while categorical variables are presented as number and percentage values. Characteristic data were compared between patient groups using indepen- dent-samples t-tests for continuous variables and chi-squared tests for categorical variables.
We investigated the effects of a history of either falls alone or of both falls and fractures on the stroke prognosis in terms of mortality at six different time periods for men and wom- en separately. The outcomes were defined by mortality at these time points: in-hospital, 0–30, 31–90, 91–365, 366–
1,095 (1–3 years), and 1,096–3,650 days (3–10 years). These time points were selected to allow the in-hospital and short-, medium-, and long-term effects of a history of either falls alone or falls and fractures on poststroke mortality to be examined accurately, without deaths during the previous time points dis- torting the results. Binary logistic regression was used to ob- tain odds ratios (ORs) for the short-term analysis of in-hospital mortality and mortality up to 30 days, while Cox proportion- al-hazards model regression was used to obtain hazard ratios for the longer-term analysis of mortality from day 31 onward.
The variables included in regression models examining mortality outcomes were chosen based on our own work and that of others that have shown impacts on stroke mortality.
We incorporated the identified variables in eight models that were analyzed separately for men and women: Models A–F, where Model F was the fully adjusted model, and Models C2 and G were used for two sensitivity analyses. These models were constructed to fully analyze, in a step-by-step approach, the complex relationships between falls, fractures, and stroke mortality in order to examine the potential confounding ef- fects of variables incrementally added to the following ad- justed models:
A) Not adjusted.
Foster EJ et al.
JCN
B) Adjusted for age, stroke type (ischemic or hemorrhagic), and Oxfordshire Community Stroke Project (OCSP) classifi- cation (lacunar stroke, partial anterior circulation stroke, pos- terior circulation stroke, and total anterior circulation stroke).
C) Further adjusted for the presence of pre-existing co- morbidities before stroke (previous strokes, transient isch- emic attacks, congestive heart failure, coronary heart disease, atrial fibrillation, myocardial infarction, diabetes, hyperten- sion, peripheral vascular disease, chronic kidney disease, chronic obstructive pulmonary disease, dementia, hyperlip- idemia, and cancer).
C2) Used in a sensitivity analysis to examine the effects of a previous history of stroke on the results, adjusting for the same variables as in Model C but excluding patients who had a previous history of stroke.
D) Further adjusted for prestroke disability (mRS score=
0–5).11,12
E) Further adjusted for the acute illness parameters of the admission white blood cell count and C-reactive protein.13,14
F) Further adjusted for the acute illness parameters of the admission serum sodium, albumin, and glucose.15-17
G) Used in a sensitivity analysis to examine the impact of the prestroke mRS score (a measure of frailty) on outcomes by removing this variable from the final adjusted model (Model F).
Missing data were excluded from each successive model.
RESUlTS
In total, 11,729 stroke cases were recorded between January 2003 and April 2015. Applying the exclusion criteria of the study as detailed in Supplementary Fig. 1 (in the online-only Data Supplement) resulted in 10,477 cases for inclusion in the analysis. Although set up in 1996, cases before 2003 were excluded since electronic record linkage for some variables (e.g., blood tests and extensive comorbidity linkage through electronic records) was not available before this time. Six stroke events were excluded due to the patients being young- er than 18 years, and 990 were excluded due to them being related to the second or third admission of the same patient during the study period (to avoid duplicate data, we only in- cluded stroke cases that were the first recorded in the regis- ter for each patient). A further 102 were excluded because they were lost to follow-up, and lastly 154 were excluded be- cause they had a history of fractures but not a history of falls.
Therefore, 10,477 people with stroke recorded for the first time in the register during the study period were included in the analysis.
The cohort was aged 77.7±11.9 years (mean±SD); 47.8%
were men (n=5,003) and 52.2% women (n=5,474). A histo-
ry of falls was observed in 14.7% of cases (n=1,535), 72.0% of which involved women. A history of falls and fractures com- bined was observed in 8.5% of cases (n=895), most of which (78.9%) involved women. Ischemic stroke occurred in 86.1%
of the cases, with the most common OCSP stroke classifica- tion (31.0%) being partial anterior circulation stroke. Most (59.0%) of the patients had a prestroke mRS score of 0. The prevalence of a history of both falls and falls and fractures in- creased with age and was significantly higher in women: 20.2%
of the women had a history of falls compared with only 8.6%
of the men, and 12.9% of the women had a history of both falls and fractures compared with 3.8% of the men. The dis- tribution of stroke types was similar between those with and without a history of falls.
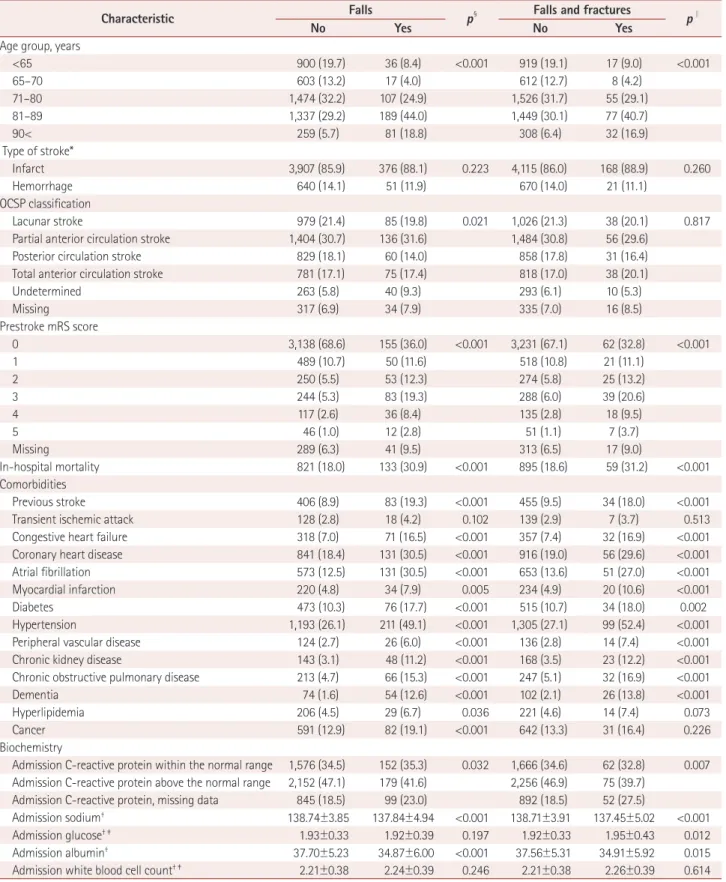
Tables 1 and 2 list the basic data characteristics for those with and without a history of falls or a history of falls and fractures in men and women, respectively. The prestroke mRS score was higher in the presence of a history of falls in both men and women. The prevalence rates of dementia, hy- pertension, previous stroke, congestive heart failure, coro- nary heart disease, atrial fibrillation, diabetes, chronic kidney disease, and chronic obstructive pulmonary disease were higher in patients with a history of falls or a history of falls and fractures than in nonfallers (p<0.05). A history of tran- sient ischemic attacks was more common in women with a history of falls or a history of falls and fractures (p<0.001), while there was no such association in men. Peripheral vas- cular disease was associated with a history of falls alone in both men (p<0.001) and women (p=0.018) and with a history of falls and fractures in men only (p<0.001). In women, hyper- lipidemia was only associated with a history of falls (p=0.011), as was myocardial infarction (p=0.007). In men, hyperlipid- emia was also associated with a history of falls (p=0.036), and a history of myocardial infarction was associated with both a history of falls and a history of falls and fractures (p=0.005 and <0.001 respectively). Cancer was not signifi- cantly associated with a history of falls or a history of falls and fractures in women (p≥0.377), while it was significantly asso- ciated with a history of falls (p<0.001) but not with history of both falls and fractures (p=0.226) in men.
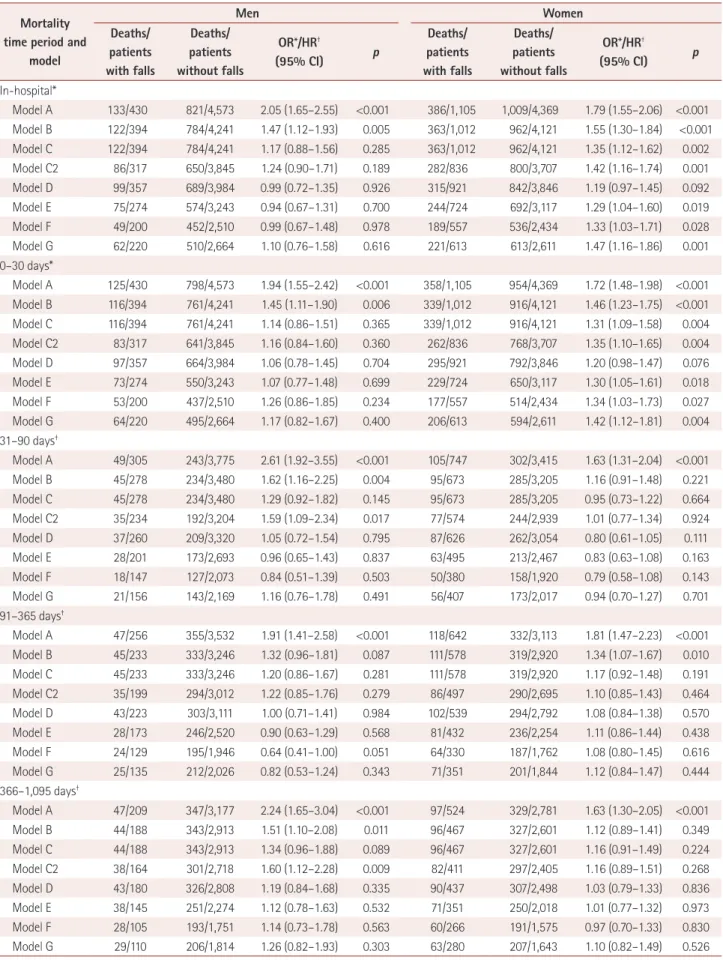
Table 3 presents the effects of a history of falls on mortal- ity in both men and women. The patients were divided into two categories for the analysis: those with and without a his- tory of falls. The analyzed event was the number of deaths occurring during the specified time period, and this was di- vided by the total number of patients in that period. The total number of cases examined in the models decreased as the number of adjusted variables increased, which was due to any cases with missing data being excluded from the analy- sis. The in-hospital mortality rate was significantly higher in
History of Falls and Poststroke Mortality
JCN
Table 1. Characteristics of men with stroke and a history of falls alone or of both falls and fractures compared with no history
Characteristic Falls
p§ Falls and fractures
p∥
No Yes No Yes
Age group, years
<65 900 (19.7) 36 (8.4) <0.001 919 (19.1) 17 (9.0) <0.001
65–70 603 (13.2) 17 (4.0) 612 (12.7) 8 (4.2)
71–80 1,474 (32.2) 107 (24.9) 1,526 (31.7) 55 (29.1)
81–89 1,337 (29.2) 189 (44.0) 1,449 (30.1) 77 (40.7)
90< 259 (5.7) 81 (18.8) 308 (6.4) 32 (16.9)
Type of stroke*
Infarct 3,907 (85.9) 376 (88.1) 0.223 4,115 (86.0) 168 (88.9) 0.260
Hemorrhage 640 (14.1) 51 (11.9) 670 (14.0) 21 (11.1)
OCSP classification
Lacunar stroke 979 (21.4) 85 (19.8) 0.021 1,026 (21.3) 38 (20.1) 0.817
Partial anterior circulation stroke 1,404 (30.7) 136 (31.6) 1,484 (30.8) 56 (29.6)
Posterior circulation stroke 829 (18.1) 60 (14.0) 858 (17.8) 31 (16.4)
Total anterior circulation stroke 781 (17.1) 75 (17.4) 818 (17.0) 38 (20.1)
Undetermined 263 (5.8) 40 (9.3) 293 (6.1) 10 (5.3)
Missing 317 (6.9) 34 (7.9) 335 (7.0) 16 (8.5)
Prestroke mRS score
0 3,138 (68.6) 155 (36.0) <0.001 3,231 (67.1) 62 (32.8) <0.001
1 489 (10.7) 50 (11.6) 518 (10.8) 21 (11.1)
2 250 (5.5) 53 (12.3) 274 (5.8) 25 (13.2)
3 244 (5.3) 83 (19.3) 288 (6.0) 39 (20.6)
4 117 (2.6) 36 (8.4) 135 (2.8) 18 (9.5)
5 46 (1.0) 12 (2.8) 51 (1.1) 7 (3.7)
Missing 289 (6.3) 41 (9.5) 313 (6.5) 17 (9.0)
In-hospital mortality 821 (18.0) 133 (30.9) <0.001 895 (18.6) 59 (31.2) <0.001
Comorbidities
Previous stroke 406 (8.9) 83 (19.3) <0.001 455 (9.5) 34 (18.0) <0.001
Transient ischemic attack 128 (2.8) 18 (4.2) 0.102 139 (2.9) 7 (3.7) 0.513
Congestive heart failure 318 (7.0) 71 (16.5) <0.001 357 (7.4) 32 (16.9) <0.001
Coronary heart disease 841 (18.4) 131 (30.5) <0.001 916 (19.0) 56 (29.6) <0.001
Atrial fibrillation 573 (12.5) 131 (30.5) <0.001 653 (13.6) 51 (27.0) <0.001
Myocardial infarction 220 (4.8) 34 (7.9) 0.005 234 (4.9) 20 (10.6) <0.001
Diabetes 473 (10.3) 76 (17.7) <0.001 515 (10.7) 34 (18.0) 0.002
Hypertension 1,193 (26.1) 211 (49.1) <0.001 1,305 (27.1) 99 (52.4) <0.001
Peripheral vascular disease 124 (2.7) 26 (6.0) <0.001 136 (2.8) 14 (7.4) <0.001
Chronic kidney disease 143 (3.1) 48 (11.2) <0.001 168 (3.5) 23 (12.2) <0.001
Chronic obstructive pulmonary disease 213 (4.7) 66 (15.3) <0.001 247 (5.1) 32 (16.9) <0.001
Dementia 74 (1.6) 54 (12.6) <0.001 102 (2.1) 26 (13.8) <0.001
Hyperlipidemia 206 (4.5) 29 (6.7) 0.036 221 (4.6) 14 (7.4) 0.073
Cancer 591 (12.9) 82 (19.1) <0.001 642 (13.3) 31 (16.4) 0.226
Biochemistry
Admission C-reactive protein within the normal range 1,576 (34.5) 152 (35.3) 0.032 1,666 (34.6) 62 (32.8) 0.007 Admission C-reactive protein above the normal range 2,152 (47.1) 179 (41.6) 2,256 (46.9) 75 (39.7)
Admission C-reactive protein, missing data 845 (18.5) 99 (23.0) 892 (18.5) 52 (27.5)
Admission sodium† 138.74±3.85 137.84±4.94 <0.001 138.71±3.91 137.45±5.02 <0.001
Admission glucose† ‡ 1.93±0.33 1.92±0.39 0.197 1.92±0.33 1.95±0.43 0.012
Admission albumin† 37.70±5.23 34.87±6.00 <0.001 37.56±5.31 34.91±5.92 0.015
Admission white blood cell count† ‡ 2.21±0.38 2.24±0.39 0.246 2.21±0.38 2.26±0.39 0.614
Normal C-reactive protein range=0–10 mg/L . Data are n (%) or mean±SD values.
*Missing data were removed from this analysis since there were no missing cases, †Independent t-test, ‡Natural logarithm of values used so as to pro- duce a normal distribution, §p values for differences between patients with and without a history of falls (overall p for categorical data), ∥p values for differences between patients with and without a history of falls and fractures (overall p for categorical data).
mRS: modified Rankin Scale, OCSP: Oxfordshire Community Stroke Project.
Foster EJ et al.
JCN
Table 2. Characteristics of women with stroke and a history of falls alone or of both falls and fractures compared with no history
Characteristic Falls
p‡ Falls and fractures
p§
No Yes No Yes
Age group, years
<65 452 (10.3) 28 (2.5) <0.001 463 (9.7) 17 (2.4) <0.001
65–70 363 (8.3) 33 (3.0) 376 (7.9) 20 (2.8)
71–80 1,221 (27.9) 175 (15.8) 1,291 (27.1) 105 (14.9)
81–89 1,667 (38.2) 517 (46.8) 1,848 (38.8) 336 (47.6)
90< 666 (15.2) 352 (31.9) 790 (16.6) 228 (32.3)
Type of stroke
Infarct 3,768 (86.2) 974 (88.1) 0.136 4,128 (86.6) 614 (87.0) 0.886
Hemorrhage 585 (13.4) 125 (11.3) 621 (13.0) 89 (12.6)
Missing 16 (0.4) 6 (0.5) 19 (0.4) 3 (0.4)
OCSP classification
Lacunar stroke 928 (21.2) 211 (19.1) 0.001 1,004 (21.1) 135 (19.1) 0.108
Partial anterior circulation stroke 1,362 (31.2) 342 (31.0) 1,488 (31.2) 216 (30.6)
Posterior circulation stroke 647 (14.8) 129 (11.7) 691 (14.5) 85 (12.0)
Total anterior circulation stroke 927 (21.2) 258 (23.3) 1,016 (21.3) 169 (23.9)
Undetermined 264 (6.0) 75 (6.8) 285 (6.0) 54 (7.6)
Missing 241 (5.5) 90 (8.1) 284 (6.0) 47 (6.7)
Prestroke mRS score
0 2,582 (59.1) 305 (27.6) <0.001 2,688 (56.4) 199 (28.2) <0.001
1 491 (11.2) 156 (14.1) 548 (11.5) 99 (14.0)
2 352 (8.1) 142 (12.9) 397 (8.3) 97 (13.7)
3 389 (8.9) 213 (19.3) 479 (10.0) 123 (17.4)
4 181 (4.1) 126 (11.4) 232 (4.9) 75 (10.6)
5 77 (1.8) 61 (5.5) 97 (2.0) 41 (5.8)
Missing 297 (6.8) 102 (9.2) 327 (6.9) 72 (10.2)
In-hospital mortality 1,009 (23.1) 386 (34.9) <0.001 1,149 (24.1) 246 (34.8) <0.001
Comorbidities
Previous stroke 431 (9.9) 189 (17.1) <0.001 507 (10.6) 113 (16.0) <0.001
Transient ischemic attack 104 (2.4) 57 (5.2) <0.001 125 (2.6) 36 (5.1) <0.001
Congestive heart failure 322 (7.4) 179 (16.2) <0.001 409 (8.6) 92 (13.0) <0.001
Coronary heart disease 602 (13.8) 283 (25.6) <0.001 724 (15.2) 161 (22.8) <0.001
Atrial fibrillation 600 (13.7) 316 (28.6) <0.001 740 (15.5) 176 (24.9) <0.001
Myocardial infarction 192 (4.4) 70 (6.3) 0.007 229 (4.8) 33 (4.7) 0.881
Diabetes 351 (8.0) 143 (12.9) <0.001 413 (8.7) 81 (11.5) 0.015
Hypertension 1,259 (28.8) 581 (52.6) <0.001 1,492 (31.3) 348 (49.3) <0.001
Peripheral vascular disease 87 (2.0) 35 (3.2) 0.018 104 (2.2) 18 (2.5) 0.536
Chronic kidney disease 101 (2.3) 53 (4.8) <0.001 123 (2.6) 31 (4.4) 0.007
Chronic obstructive pulmonary disease 142 (3.3) 75 (6.8) <0.001 174 (3.6) 43 (6.1) 0.002
Dementia 93 (2.1) 160 (14.5) <0.001 150 (3.1) 103 (14.6) <0.001
Hyperlipidemia 157 (3.6) 58 (5.2) 0.011 180 (3.8) 35 (5.0) 0.131
Cancer 420 (9.6) 116 (10.5) 0.377 462 (9.7) 74 (10.5) 0.509
Biochemistry
Admission C-reactive protein within the normal range 1,460 (33.4) 385 (34.8) 0.365 1,598 (33.5) 247 (35.0) 0.467 Admission C-reactive protein above the normal range 2,077 (47.5) 499 (45.2) 2,259 (47.4) 317 (44.9)
Admission C-reactive protein, missing data 832 (19.0) 221 (20.0) 911 (19.1) 142 (20.1)
Admission sodium* 138.08±4.33 137.95±5.06 <0.001 138.10±4.43 137.73±4.84 0.003
Admission glucose*† 1.94±0.32 1.90±0.32 0.688 1.94±0.32 1.90±0.32 0.723
Admission albumin* 37.12±5.47 35.08±5.95 <0.001 36.98±5.50 34.88±6.16 <0.001
Admission white blood cell count*† 2.24±0.39 2.20±0.39 0.890 2.24±0.39 2.21±0.39 0.712
Normal C-reactive protein range=0–10 mg/L, Data are n (%) or mean±SD values.
*Independent t-test, †Natural logarithm of values used so as to produce a normal distribution, ‡p values for differences between patients with and without a history of falls (overall p for categorical data), §p values for differences between patients with and without a history of falls and fractures (overall p for categorical data).
mRS: modified Rankin Scale, OCSP: Oxfordshire Community Stroke Project.
History of Falls and Poststroke Mortality
JCN
Table 3. Effects of a history of falls on mortality after stroke in men and women Mortality
time period and model
Men Women
Deaths/
patients with falls
Deaths/
patients without falls
OR*/HR†
(95% CI) p
Deaths/
patients with falls
Deaths/
patients without falls
OR*/HR†
(95% CI) p
In-hospital*
Model A 133/430 821/4,573 2.05 (1.65–2.55) <0.001 386/1,105 1,009/4,369 1.79 (1.55–2.06) <0.001 Model B 122/394 784/4,241 1.47 (1.12–1.93) 0.005 363/1,012 962/4,121 1.55 (1.30–1.84) <0.001 Model C 122/394 784/4,241 1.17 (0.88–1.56) 0.285 363/1,012 962/4,121 1.35 (1.12–1.62) 0.002
Model C2 86/317 650/3,845 1.24 (0.90–1.71) 0.189 282/836 800/3,707 1.42 (1.16–1.74) 0.001
Model D 99/357 689/3,984 0.99 (0.72–1.35) 0.926 315/921 842/3,846 1.19 (0.97–1.45) 0.092
Model E 75/274 574/3,243 0.94 (0.67–1.31) 0.700 244/724 692/3,117 1.29 (1.04–1.60) 0.019
Model F 49/200 452/2,510 0.99 (0.67–1.48) 0.978 189/557 536/2,434 1.33 (1.03–1.71) 0.028
Model G 62/220 510/2,664 1.10 (0.76–1.58) 0.616 221/613 613/2,611 1.47 (1.16–1.86) 0.001
0–30 days*
Model A 125/430 798/4,573 1.94 (1.55–2.42) <0.001 358/1,105 954/4,369 1.72 (1.48–1.98) <0.001 Model B 116/394 761/4,241 1.45 (1.11–1.90) 0.006 339/1,012 916/4,121 1.46 (1.23–1.75) <0.001 Model C 116/394 761/4,241 1.14 (0.86–1.51) 0.365 339/1,012 916/4,121 1.31 (1.09–1.58) 0.004
Model C2 83/317 641/3,845 1.16 (0.84–1.60) 0.360 262/836 768/3,707 1.35 (1.10–1.65) 0.004
Model D 97/357 664/3,984 1.06 (0.78–1.45) 0.704 295/921 792/3,846 1.20 (0.98–1.47) 0.076
Model E 73/274 550/3,243 1.07 (0.77–1.48) 0.699 229/724 650/3,117 1.30 (1.05–1.61) 0.018
Model F 53/200 437/2,510 1.26 (0.86–1.85) 0.234 177/557 514/2,434 1.34 (1.03–1.73) 0.027
Model G 64/220 495/2,664 1.17 (0.82–1.67) 0.400 206/613 594/2,611 1.42 (1.12–1.81) 0.004
31–90 days†
Model A 49/305 243/3,775 2.61 (1.92–3.55) <0.001 105/747 302/3,415 1.63 (1.31–2.04) <0.001
Model B 45/278 234/3,480 1.62 (1.16–2.25) 0.004 95/673 285/3,205 1.16 (0.91–1.48) 0.221
Model C 45/278 234/3,480 1.29 (0.92–1.82) 0.145 95/673 285/3,205 0.95 (0.73–1.22) 0.664
Model C2 35/234 192/3,204 1.59 (1.09–2.34) 0.017 77/574 244/2,939 1.01 (0.77–1.34) 0.924
Model D 37/260 209/3,320 1.05 (0.72–1.54) 0.795 87/626 262/3,054 0.80 (0.61–1.05) 0.111
Model E 28/201 173/2,693 0.96 (0.65–1.43) 0.837 63/495 213/2,467 0.83 (0.63–1.08) 0.163
Model F 18/147 127/2,073 0.84 (0.51–1.39) 0.503 50/380 158/1,920 0.79 (0.58–1.08) 0.143
Model G 21/156 143/2,169 1.16 (0.76–1.78) 0.491 56/407 173/2,017 0.94 (0.70–1.27) 0.701
91–365 days†
Model A 47/256 355/3,532 1.91 (1.41–2.58) <0.001 118/642 332/3,113 1.81 (1.47–2.23) <0.001
Model B 45/233 333/3,246 1.32 (0.96–1.81) 0.087 111/578 319/2,920 1.34 (1.07–1.67) 0.010
Model C 45/233 333/3,246 1.20 (0.86–1.67) 0.281 111/578 319/2,920 1.17 (0.92–1.48) 0.191
Model C2 35/199 294/3,012 1.22 (0.85–1.76) 0.279 86/497 290/2,695 1.10 (0.85–1.43) 0.464
Model D 43/223 303/3,111 1.00 (0.71–1.41) 0.984 102/539 294/2,792 1.08 (0.84–1.38) 0.570
Model E 28/173 246/2,520 0.90 (0.63–1.29) 0.568 81/432 236/2,254 1.11 (0.86–1.44) 0.438
Model F 24/129 195/1,946 0.64 (0.41–1.00) 0.051 64/330 187/1,762 1.08 (0.80–1.45) 0.616
Model G 25/135 212/2,026 0.82 (0.53–1.24) 0.343 71/351 201/1,844 1.12 (0.84–1.47) 0.444
366–1,095 days†
Model A 47/209 347/3,177 2.24 (1.65–3.04) <0.001 97/524 329/2,781 1.63 (1.30–2.05) <0.001
Model B 44/188 343/2,913 1.51 (1.10–2.08) 0.011 96/467 327/2,601 1.12 (0.89–1.41) 0.349
Model C 44/188 343/2,913 1.34 (0.96–1.88) 0.089 96/467 327/2,601 1.16 (0.91–1.49) 0.224
Model C2 38/164 301/2,718 1.60 (1.12–2.28) 0.009 82/411 297/2,405 1.16 (0.89–1.51) 0.268
Model D 43/180 326/2,808 1.19 (0.84–1.68) 0.335 90/437 307/2,498 1.03 (0.79–1.33) 0.836
Model E 38/145 251/2,274 1.12 (0.78–1.63) 0.532 71/351 250/2,018 1.01 (0.77–1.32) 0.973
Model F 28/105 193/1,751 1.14 (0.73–1.78) 0.563 60/266 191/1,575 0.97 (0.70–1.33) 0.830
Model G 29/110 206/1,814 1.26 (0.82–1.93) 0.303 63/280 207/1,643 1.10 (0.82–1.49) 0.526
Foster EJ et al.
JCN
women with a history of falls than in those with no such history [OR=1.33, 95% confidence interval (CI)=1.03–1.71]
in the fully adjusted model (Model F). Model C2 was used in a sensitivity analysis of the effects of a previous history of stroke on the results, and it yielded p values closely match- ing those of Model C, implying that our results remained significant. Model D (adjusting for the prestroke mRS score) resulted in a loss of significance in the results of our detailed analysis (OR=1.19, 95% CI=0.97–1.45), but the significance remained in the fully adjusted model. The results for Model G, which examined the potential effects of frailty on the out- comes by removing the prestroke mRS score from Model F, remained essentially unchanged, except for a higher signifi- cance level (i.e., lower p value) for in-hospital mortality in women with a history of falls alone (Table 3). This suggests that prestroke frailty may serve as a mediator for these out- comes. A significant association was also present for the in- hospital mortality among men in the unadjusted model, al- though the association was no longer significant after adjusting for comorbidities in Model C (OR=1.17, 95% CI= 0.88–1.56).
A history of falls was significantly associated with increased short-term mortality (0–30 days) in women (OR=1.34, 95%
CI=1.03–1.73) in the fully adjusted model. This showed a very similar pattern to the in-hospital mortality in women, with the significance being lost in Model D (OR=1.20, 95%
CI=0.98–1.47) but returning in the subsequent increasingly adjusted models. Model G also produced a lower p value than Model F, again indicating that prestroke frailty may contribute
to these outcome associations. When adjusting for comor- bidities, the significance was lost for the 0- to 30-day mortal- ity in men in Model C (OR=1.14, 95% CI=0.86–1.51).
There were no consistent significant associations between a history of falls and longer-term mortality outcomes.
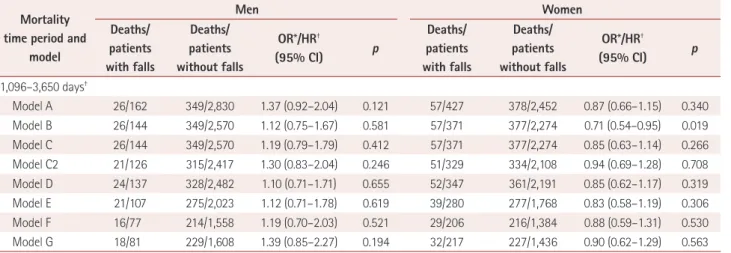
Table 4 presents the effects of a history of both falls and fractures on mortality in men and women. No association was found between a history of falls and fractures on mortal- ity after stroke in the fully adjusted models for both men and women.
We have also included graphs for the Cox proportional- hazards models that display the mortality rate over the entire follow-up period for men (Fig. 1) and women (Fig. 2) with and without a history of falls (Figs. 1A and 2A, respectively), and with and without a history of fractures (Figs. 1B and 2B, respectively).
DISCUSSION
This is the first report in the literature of the rates of acute mortality in-hospital and at 0–30 days being significantly higher in poststroke women with a history of falls than in those without such a history. However, no similar association was found in men, and there was no association between the predictor of the history of falls and fractures combined and mortality. Our findings suggest that a history of falls may be of prognostic use especially for women who are admitted with a stroke. While it is unclear whether this is mere reflec- Table 3. Effects of a history of falls on mortality after stroke in men and women (continued)
Mortality time period and
model
Men Women
Deaths/
patients with falls
Deaths/
patients without falls
OR*/HR†
(95% CI) p
Deaths/
patients with falls
Deaths/
patients without falls
OR*/HR†
(95% CI) p
1,096–3,650 days†
Model A 26/162 349/2,830 1.37 (0.92–2.04) 0.121 57/427 378/2,452 0.87 (0.66–1.15) 0.340
Model B 26/144 349/2,570 1.12 (0.75–1.67) 0.581 57/371 377/2,274 0.71 (0.54–0.95) 0.019
Model C 26/144 349/2,570 1.19 (0.79–1.79) 0.412 57/371 377/2,274 0.85 (0.63–1.14) 0.266
Model C2 21/126 315/2,417 1.30 (0.83–2.04) 0.246 51/329 334/2,108 0.94 (0.69–1.28) 0.708
Model D 24/137 328/2,482 1.10 (0.71–1.71) 0.655 52/347 361/2,191 0.85 (0.62–1.17) 0.319
Model E 21/107 275/2,023 1.12 (0.71–1.78) 0.619 39/280 277/1,768 0.83 (0.58–1.19) 0.306
Model F 16/77 214/1,558 1.19 (0.70–2.03) 0.521 29/206 216/1,384 0.88 (0.59–1.31) 0.530
Model G 18/81 229/1,608 1.39 (0.85–2.27) 0.194 32/217 227/1,436 0.90 (0.62–1.29) 0.563
Model A: unadjusted. Model B: Model A+age, stroke type (ischemic or hemorrhagic), and OCSP classification (lacunar stroke, partial anterior circula- tion stroke, posterior circulation stroke, and total anterior circulation stroke). Model C: Model B+prestroke comorbidities (previous strokes, transient ischemic attacks, congestive heart failure, coronary heart disease, atrial fibrillation, myocardial infarction, diabetes, hypertension, peripheral vascular disease, chronic kidney disease, chronic obstructive pulmonary disease, dementia, hyperlipidemia, and cancer). Model C2: Model C–patients with a history of stroke. Model D: Model C+prestroke disability mRS score=0–5. Model E: Model D+acute illness parameters of admission white blood cell count and C-reactive protein. Model F: Model E+acute illness parameters of admission sodium, albumin, and glucose. Model G: Model F–prestroke dis- ability mRS score.
*Analysis up to and including 30 days, †Analysis from 31 days onward.
CI: confidence interval, HR: hazard ratio, mRS: modified Rankin Scale, OCSP: Oxfordshire Community Stroke Project, OR: odds ratio.
History of Falls and Poststroke Mortality
JCN
Table 4. Effects of a history of falls and fractures on mortality after stroke in men and women
Mortality time period
and model
Men Women
Deaths/
patients with falls and
fractures
Deaths/
patients without falls and fractures
OR*/HR†
(95% CI) p
Deaths/
patients with falls and
fractures
Deaths/
patients without falls and fractures
OR*/HR†
(95% CI) p
In-hospital*
Model A 59/189 895/4,814 1.99 (1.45–2.73) <0.001 246/706 1,149/4,768 1.68 (1.42–1.99) <0.001 Model B 54/173 852/4,462 1.54 (1.04–2.26) 0.031 235/657 1,090/4,476 1.39 (1.14–1.71) 0.001 Model C 54/173 852/4,462 1.17 (0.77–1.77) 0.469 235/657 1,090/4,476 1.29 (1.05–1.59) 0.018
Model C2 38/141 698/4,021 1.33 (0.84–2.12) 0.227 186/549 896/3,994 1.34 (1.07–1.69) 0.012
Model D 42/157 746/4,184 0.90 (0.57–1.42) 0.652 198/589 959/4,178 1.11 (0.89–1.40) 0.360
Model E 31/113 618/3,404 0.82 (0.50–1.34) 0.426 159/466 777/3,375 1.23 (0.96–1.57) 0.096
Model F 19/85 482/2,625 0.94 (0.53–1.66) 0.819 124/353 601/2,638 1.25 (0.93–1.66) 0.135
Model G 26/94 546/2,790 1.09 (0.65–1.83) 0.759 148/391 686/2,833 1.39 (1.06–1.82) 0.017
0–30 days*
Model A 53/189 870/4,814 1.77 (1.28–2.45) 0.001 226/706 1,086/4,768 1.60 (1.34–1.90) <0.001 Model B 49/173 828/4,462 1.38 (0.94–2.04) 0.104 217/657 1,038/4,476 1.29 (1.05–1.59) 0.014 Model C 49/173 828/4,462 1.03 (0.68–1.57) 0.880 217/657 1,038/4,476 1.22 (0.99–1.50) 0.068
Model C2 32/141 692/4,021 0.95 (0.58–1.53) 0.823 173/549 857/3,994 1.28 (1.01–1.61) 0.039
Model D 40/157 721/4,184 0.91 (0.58–1.43) 0.677 185/589 902/4,178 1.11 (0.88–1.40) 0.369
Model E 29/113 594/3,404 0.85 (0.52–1.37) 0.494 149/466 730/3,375 1.22 (0.96–1.56) 0.106
Model F 20/85 470/2,625 0.94 (0.54–1.66) 0.840 114/353 577/2,638 1.22 (0.91–1.64) 0.185
Model G 25/94 534/2,790 0.90 (0.53–1.52) 0.688 134/391 666/2,833 1.28 (0.98–1.69) 0.074
31–90 days†
Model A 15/136 277/3,944 1.59 (0.95–2.68) 0.080 68/480 339/3,682 1.58 (1.22–2.05) 0.001
Model B 14/124 265/3,634 1.07 (0.62–1.83) 0.817 64/440 316/3,438 1.18 (0.89–1.55) 0.247
Model C 14/124 265/3,634 0.80 (0.45–1.40) 0.429 64/440 316/3,438 1.06 (0.80–1.40) 0.709
Model C2 12/109 215/3,329 1.00 (0.54–1.84) 0.989 52/376 269/3,137 1.11 (0.81–1.52) 0.514
Model D 11/117 235/3,463 0.58 (0.31–1.10) 0.097 56/404 293/3,276 0.91 (0.67–1.22) 0.522
Model E 7/84 194/2,810 0.56 (0.30–1.07) 0.079 42/317 234/2,645 0.90 (0.66–1.21) 0.478
Model F 5/65 140/2,155 0.57 (0.26–1.24) 0.154 33/239 175/2,061 0.92 (0.65–1.31) 0.650
Model G 7/69 157/2,256 0.87 (0.45–1.69) 0.677 39/257 190/2,167 1.07 (0.77–1.49) 0.683
91–365 days†
Model A 30/121 372/3,667 2.65 (1.83–3.84) <0.001 79/412 371/3,343 1.83 (1.44–2.33) <0.001
Model B 28/110 350/3,369 1.81 (1.23–2.67) 0.003 76/376 354/3,122 1.40 (1.08–1.80) 0.010
Model C 28/110 350/3,369 1.62 (1.08–2.43) 0.020 76/376 354/3,122 1.28 (0.99–1.66) 0.062
Model C2 26/97 303/3,114 1.93 (1.26–2.95) 0.002 59/324 317/2,868 1.23 (0.92–1.64) 0.165
Model D 26/106 320/3,228 1.29 (0.84–1.98) 0.243 69/348 327/2,983 1.21 (0.92–1.59) 0.180
Model E 13/77 261/2,616 1.21 (0.77–1.90) 0.400 55/275 262/2,411 1.27 (0.95–1.68) 0.103
Model F 12/60 207/2,015 0.93 (0.53–1.62) 0.785 43/206 208/1,886 1.30 (0.94–1.79) 0.108
Model G 13/62 224/2,099 1.33 (0.80–2.22) 0.279 48/218 224/1,977 1.26 (0.92–1.71) 0.147
366–1,095 days†
Model A 21/91 373/3,295 2.22 (1.43–3.45) <0.001 61/333 365/2,972 1.56 (1.19–2.05) 0.001
Model B 19/82 368/3,019 1.51 (0.95–2.39) 0.084 60/300 363/2,768 1.10 (0.84–1.45) 0.495
Model C 19/82 368/3,019 1.22 (0.75–2.01) 0.424 60/300 363/2,768 1.15 (0.87–1.53) 0.332
Model C2 16/71 323/2,811 1.39 (0.82–2.36) 0.222 50/265 329/2,551 1.10 (0.81–1.49) 0.563
Model D 18/80 351/2,908 0.97 (0.58–1.63) 0.915 56/279 341/2,656 1.05 (0.78–1.41) 0.731
Model E 16/64 273/2,355 0.97 (0.56–1.67) 0.910 44/220 277/2,149 1.02 (0.75–1.39) 0.904
Model F 14/48 207/1,808 1.06 (0.55–2.02) 0.869 37/163 214/1,678 1.04 (0.73–1.50) 0.821
Model G 15/49 220/1,875 1.41 (0.77–2.59) 0.265 39/170 231/1,753 1.14 (0.80–1.61) 0.476
Foster EJ et al.
JCN
0 1,000 2,000 3,000 4,000 5,000 Follow-up (days)
1.0 0.8 0.6 0.4 0.2 0.0
Survival
0 1,000 2,000 3,000 4,000 5,000 Follow-up (days)
1.0 0.8 0.6 0.4 0.2 0.0
Survival
A
B
No history of falls History of falls
No history of fractures History of fractures
Fig. 1. A: Kaplan-Meier curve showing the probability of survival across the whole follow-up period in men with a history of falls com- pared to those with no history of falls. B: Kaplan-Meier curve showing the probability of survival across the whole follow-up period in men with a history of fractures compared to those with no history of frac- tures.
Fig. 2. A: Kaplan-Meier curve showing the probability of survival across the whole follow-up period in women with a history of falls compared to those with no history of falls. B: Kaplan-Meier curve show- ing the probability of survival across the whole follow-up period in women with a history of fractures compared to those with no history of fractures.
0 1,000 2,000 3,000 4,000 5,000 Follow-up (days)
1.0 0.8 0.6 0.4 0.2 0.0
Survival
0 1,000 2,000 3,000 4,000 5,000 Follow-up (days)
1.0 0.8 0.6 0.4 0.2 0.0
Survival
A
B
No history of falls History of falls
No history of fractures History of fractures Table 4. Effects of a history of falls and fractures on mortality after stroke in men and women (continued)
Mortality time period
and model
Men Women
Deaths/
patients with falls and
fractures
Deaths/
patients without falls and fractures
OR*/HR†
(95% CI) p
Deaths/
patients with falls and
fractures
Deaths/
patients without falls and fractures
OR*/HR†
(95% CI) p
1,096–3,650 days†
Model A 9/70 366/2,922 1.03 (0.53–1.99) 0.934 31/272 404/2,607 0.74 (0.51–1.06) 0.101
Model B 9/63 366/2,651 0.83 (0.43–1.61) 0.575 31/240 403/2,405 0.61 (0.42–1.88) 0.008
Model C 9/63 366/2,651 0.89 (0.46–1.74) 0.734 31/240 403/2,405 0.68 (0.47–0.98) 0.039
Model C2 8/55 328/2,488 1.06 (0.52–2.15) 0.869 27/215 358/2,222 0.70 (0.47–1.05) 0.083
Model D 9/62 343/2,557 0.81 (0.41–1.60) 0.537 29/223 384/2,315 0.72 (0.49–1.06) 0.100
Model E 9/48 287/2,082 0.67 (0.31–1.46) 0.311 19/176 297/1,872 0.67 (0.43–1.06) 0.085
Model F 8/34 222/1,601 0.68 (0.27–1.74) 0.423 13/126 232/1,464 0.75 (0.46–1.23) 0.253
Model G 8/34 239/1,655 0.80 (0.32–1.98) 0.623 13/131 246/1,522 0.73 (0.46–1.16) 0.180
*Analysis up to and including 30 days, †Analysis from 31 days onward.
CI: confidence interval, HR: hazard ratio, OR: odds ratio.
History of Falls and Poststroke Mortality
JCN
tion of frailty, sensitivity analysis that involved removing pre- stroke frailty, as indicated by the prestroke mRS score, did not significantly alter the results.
These findings raise the possibility of implementing target- ed approaches to improve the poststroke outcomes for the at- risk population, for example by providing fall-prevention measures such as targeted balance training and ensuring a safe environment or reviewing current medications.18,19 This may be particularly beneficial for women with a history of falls who also have risk factors for stroke.
Previous studies have shown not only that the bone min- eral density (an indicator of osteoporosis) decreases after stroke but also that a previous low bone mineral density in- creases the risk of having a stroke,6,20,21 poststroke mortality,22 and fracture risk,23 with previous fractures having also been shown to be a risk factor for future fractures.7 A study report- ed on in 1991 found that the risk of death from stroke was in- creased in women with osteopenia and aged at least 65 years, but showed that most of this risk was unrelated to the occur- rence of fractures.24 A prospective study of osteoporotic frac- tures reported on in 1993 showed an association with low bone mineral density and stroke occurrence in women older than 65 years.25 It was also recently demonstrated that hip frac- tures increase the risk of stroke.26
In contrast, the present study found no significant associa- tion between the predictor of falls and fractures combined and poststroke mortality. This finding is similar to Browner et al.24 reporting in 1991 that fractures were unrelated to death from stroke. Similar results were also reported by Mussolino et al.27 in 2003, who found no association between bone min- eral density and mortality after stroke in their population of 3,402 white and black men and women aged 45–74 years who were followed up from 1971 to 1992.
There are a few plausible reasons for explaining our appar- ently unexpected result that a history of falls associated with a history of fractures did not increase the mortality risk. First- ly, the group sample was relatively small, which could have introduced a type 2 statistical error. Secondly, we might not have adequately controlled for confounders, resulting in the presence of residual confounding or other known and un- known confounders.
A previous study followed up 3,257 Chinese patients old- er than 55 years for 8 years, and found frailty to be associat- ed with a significantly increased risk of recurrent falls but not fractures, which is also known to be associated with higher mortality.28 Moreover, in our study we also did not distinguish between histories of single and multiple falls, and so those with- out fractures may have also experienced multiple falls, which is known to be associated with worse mortality outcomes.29
While this study may have unveiled a potential area of risk
management to improve clinical outcomes poststroke, future investigations need to determine the mechanisms underlying the association between previous falls and mortality, even though we have shown that frailty may act as a mediator in this association. This should lead to targeted preventative therapies that are effective at reducing mortality.
Tables 1 and 2 indicate that the prestroke mRS score was higher when there was a history of falls, indicating greater disability prior to the stroke. This may partly explain the mortality increase in this group shown using Model G and the loss of significance in Model D. It could be argued that it is therefore unsurprising that the mortality rate is higher among those with a history of falls than in those without such a history. However, we still found a significant associa- tion even when the comorbidities and previous disability (an indicator of frailty) were accounted for in women in our fully adjusted models. Examining the links between comorbidity burden, history of falls, and acute mortality outcomes may yield a better understanding of this finding, and also whether specific comorbidities affect the poststroke prognosis relating to a history of falls. Further research directions could include exploring if having a history of falls increases the risk of fu- ture comorbidities after stroke.
While the analyzed data provided a unique opportunity to examine the links between a history of falls or a history of falls and fractures and stroke mortality over a long-term fol- low-up, this study was subject to some limitations. We did not have information on the bone mineral density status of patients, and the history of falls and fractures were based on ICD-10 codes, which may have underestimated their true prev- alence in this patient population. Nevertheless, these limita- tions are likely to only have attenuated the relationships. We attempted to minimize the possible effect of the lack of bone mineral density data by combining falls and fractures into one predicting variable, meaning that the fractures were more likely to be low-trauma fragility fractures related to osteoporo- sis. There was a considerable amount of missing data in the fi- nal models, but the sample size remained adequate and our careful approach to constructing the models reduced the po- tential effects of any missing data. It is also important to note that we were able to control for important acute illness mark- ers–which are known to influence mortality outcome in stroke–
in the final models.
In summary, a previous history of falls was associated with increased acute mortality in women but not in men after stroke. In both sexes, the history of previous falls and frac- tures combined was not associated with any effect on mor- tality. The results obtained in this study imply that a history of falls may be an important factor to consider in the prog- nosis of stroke, particularly in women. Most instances of
Foster EJ et al.
JCN
stroke mortality are acute, with inpatient mortality being the largest burden and of great concern to patients, relatives, and clinicians. This study has therefore made an important contribution by identifying a new marker for an increased risk of mortality after stroke. Further research should attempt to identify the factors underlying this increase in mortality, with the aim of developing targeted interventions that can im- prove stroke mortality outcomes.
Supplementary Materials
The online-only Data Supplement is available with this arti- cle at https://doi.org/10.3988/jcn.2017.13.4.411.
Conflicts of Interest
The authors have no financial conflicts of interest.
Acknowledgements
We thank the stroke services data team in the Norfolk and Norwich Uni- versity Stroke Research Group for collecting and maintaining the data of the Norfolk and Norwich University Hospital Stroke and Transient Isch- aemic Attack Register (NNSTR), which was used in this study.
EJF was supported by the Aberdeen Summer Research Scholarship grant to carry out the research, awarded by the School of Medicine, Medi- cal Sciences & Nutrition, University of Aberdeen as part of the Academic Clinical Training & Development scheme. The funder has no role in study design or interpretation of the results.
REFERENCES
1. Hopewell JC, Clarke R. Emerging risk factors for stroke: what have we learned from mendelian randomization studies? Stroke 2016;47:1673- 1678.
2. Schmid AA, Yaggi HK, Burrus N, McClain V, Austin C, Ferguson J, et al. Circumstances and consequences of falls among people with chronic stroke. J Rehabil Res Dev 2013;50:1277-1286.
3. Chang VC, Do MT. Risk factors for falls among seniors: implications of gender. Am J Epidemiol 2015;181:521-531.
4. Myint PK, Poole KE, Warburton EA. Hip fractures after stroke and their prevention. QJM 2007;100:539-545.
5. Moayyeri A, Alrawi YA, Myint PK. The complex mutual connection between stroke and bone health. Arch Biochem Biophys 2010;503:153- 159.
6. Myint PK, Clark AB, Kwok CS, Loke YK, Yeong JK, Luben RN, et al.
Bone mineral density and incidence of stroke: European prospective investigation into cancer-norfolk population-based study, systematic review, and meta-analysis. Stroke 2014;45:373-382.
7. Woolf AD, Akesson K. Preventing fractures in elderly people. BMJ 2003;327:89-95.
8. Kwok CS, Skinner J, Metcalf AK, Potter JF, Myint PK. Prior antiplate- let or anticoagulant therapy and mortality in stroke. Heart 2012;98:
712-717.
9. White JR, Bettencourt-Silva JH, Potter JF, Loke YK, Myint PK. Chang- es in antiplatelet use prior to incident ischaemic stroke over 7 years in a UK centre and the association with stroke subtype. Age Ageing 2013;
42:594-598.
10. Bettencourt-Silva J, De La Iglesia B, Donell S, Rayward-Smith V. On
creating a patient-centric database from multiple hospital information systems. Methods Inf Med 2012;51:210-220.
11. Kwok CS, Potter JF, Dalton G, George A, Metcalf AK, Ngeh J, et al. The SOAR stroke score predicts inpatient and 7-day mortality in acute stroke. Stroke 2013;44:2010-2012.
12. Myint PK, Clark AB, Kwok CS, Davis J, Durairaj R, Dixit AK, et al.
The SOAR (Stroke subtype, Oxford Community Stroke Project classi- fication, Age, prestroke modified Rankin) score strongly predicts early outcomes in acute stroke. Int J Stroke 2014;9:278-283.
13. Di Napoli M, Schwaninger M, Cappelli R, Ceccarelli E, Di Gianfilippo G, Donati C, et al. Evaluation of C-reactive protein measurement for assessing the risk and prognosis in ischemic stroke: a statement for health care professionals from the CRP Pooling Project members. Stroke 2005;36:1316-1329.
14. Grau AJ, Boddy AW, Dukovic DA, Buggle F, Lichy C, Brandt T, et al.
Leukocyte count as an independent predictor of recurrent ischemic events. Stroke 2004;35:1147-1152.
15. Carter AM, Catto AJ, Mansfield MW, Bamford JM, Grant PJ. Predic- tive variables for mortality after acute ischemic stroke. Stroke 2007;38:
1873-1880.
16. Mukarram F, Gottesman RF, Marsh E. Glucose on admission associ- ated with post-stroke outcome. Stroke 2016;47:ATP353.
17. Adekunle-Olarinde IR, McCall SJ, Barlas RS, Wood AD, Clark AB, Bettencourt-Silva JH, et al. Addition of sodium criterion to SOAR stroke score. Acta Neurol Scand 2017;135:553-559.
18. Luk JK, Chan TY, Chan DK. Falls prevention in the elderly: translat- ing evidence into practice. Hong Kong Med J 2015;21:165-171.
19. Gill TM, Pahor M, Guralnik JM, McDermott MM, King AC, Buford TW, et al. Effect of structured physical activity on prevention of seri- ous fall injuries in adults aged 70-89: randomized clinical trial (LIFE Study). BMJ 2016;352:i245.
20. Jørgensen L, Engstad T, Jacobsen BK. Bone mineral density in acute stroke patients: low bone mineral density may predict first stroke in women. Stroke 2001;32:47-51.
21. Chen YC, Wu JC, Liu L, Huang WC, Cheng H, Chen TJ, et al. Hospi- talized osteoporotic vertebral fracture increases the risk of stroke: a population-based cohort study. J Bone Miner Res 2013;28:516-523.
22. Nordström A, Eriksson M, Stegmayr B, Gustafson Y, Nordström P.
Low bone mineral density is an independent risk factor for stroke and death. Cerebrovasc Dis 2010;29:130-136.
23. Dennis MS, Lo KM, McDowall M, West T. Fractures after stroke: fre- quency, types, and associations. Stroke 2002;33:728-734.
24. Browner WS, Seeley DG, Vogt TM, Cummings SR. Non-trauma mortality in elderly women with low bone mineral density. Study of Osteoporotic Fractures Research Group. Lancet 1991;338:355-358.
25. Browner WS, Pressman AR, Nevitt MC, Cauley JA, Cummings SR.
Association between low bone density and stroke in elderly women.
The study of osteoporotic fractures. Stroke 1993;24:940-946.
26. Tsai CH, Lin CL, Hsu HC, Chung WS. Increased risk of stroke among hip fracture patients: a nationwide cohort study. Osteoporos Int 2015;26:
645-652.
27. Mussolino ME, Madans JH, Gillum RF. Bone mineral density and stroke. Stroke 2003;34:e20-e22.
28. Fang X, Shi J, Song X, Mitnitski A, Tang Z, Wang C, et al. Frailty in rela- tion to the risk of falls, fractures, and mortality in older Chinese adults:
results from the Beijing Longitudinal Study of Aging. J Nutr Health Ag- ing 2012;16:903-907.
29. Sylliaas H, Idland G, Sandvik L, Forsen L, Bergland A. Does mortality of the aged increase with the number of falls? Results from a nine- year follow-up study. Eur J Epidemiol 2009;24:351-355.