Received:January 2, 2020, Revised:(1st) January 31, 2020, (2nd) February 14, 2020, Accepted:March 2, 2020 Corresponding to:Young Ho Lee http://orcid.org/0000-0003-4213-1909
Division of Rheumatology, Department of Internal Medicine, Korea University Anam Hospital, Korea University College of Medicine, 73 Goryeodae-ro, Seongbuk-gu, Seoul 02841, Korea. E-mail:[email protected]
Copyright ⓒ 2020 by The Korean College of Rheumatology. All rights reserved.
This is an Open Access article, which permits unrestricted non-commerical use, distribution, and reproduction in any medium, provided the original work is properly cited.
Circulating Interleukin-18 Level in Systemic Lupus Erythematosus
Young Ho Lee, M.D., Ph.D., Gwan Gyu Song, M.D., Ph.D.
Division of Rheumatology, Department of Internal Medicine, Korea University College of Medicine, Seoul, Korea
Objective. This study aimed to evaluate the relationship between circulating interleukin (IL)-18 levels and systemic lupus eryth- ematosus (SLE) and establish a correlation between plasma/serum IL-18 levels and SLE activity. Methods. We performed a meta-analysis comparing plasma/serum IL-18 levels in patients with SLE to controls by using fixed or random effects model based on the heterogeneity. Results. Sixteen studies with 659 SLE patients and 502 controls were included in this meta-analysis.
Meta-analysis showed that IL-18 levels were significantly higher in the SLE group (standardized mean difference=1.556, 95%
confidence interval=1.087∼2.024, p<0.001). Stratifying by ethnicity showed that IL-18 levels were significantly elevated in the SLE groups of European, Asian, and Arab populations. Stratification by adjustment for age and/or sex revealed a significantly higher IL-18 level in the SLE group, independently of the adjustment. Subgroup analysis by sample size showed significantly higher IL-18 levels in the SLE group for both large sample (n≥50) and small sample (n<50) subgroups. Subgroup analysis by data type showed significantly higher IL-18 levels in the SLE group for both original and calculated data populations.
Conclusion. This meta-analysis demonstrated that circulating IL-18 levels are higher in patients with SLE. (J Rheum Dis 2020;27:
110-115)
Key Words. Interleukin-18, Lupus erythematosus, systemic, Association
INTRODUCTION
Systemic lupus erythematosus (SLE) is a prototypic au- toimmune disease characterized by B cell hyperactivity, high levels of autoantibody production, immune-com- plex deposition, and multiple organ damage [1]. In SLE, the accumulation of self-antigens due to impaired clear- ance facilitates autoimmune responses and subsequent inflammation with high levels of inflammatory cytokines [2].
Interleukin-18 (IL-18) was initially described as a factor that enhanced interferon-gamma (IFN-γ) in mouse spleen cells [3] and IL-18 plays a key role in autoimmune diseases by controlling either T-helper 1 (Th1) or T-help- er 2 (Th2) immune responses [4]. IL-18 is produced by various cell types including Kupffer cells, activated mac-
rophages, keratinocytes, intestinal epithelial cells, osteo- blasts, and adrenal cortex cells. IL-18 expression induces the production of tumor necrosis factor-α, granulocyte/
macrophage colony-stimulating factor, and IFN-γ, and increases the cytotoxic effects of NK and T cells in SLE [5].
IL-18 may play a key role in the pathogenesis of SLE, however studies comparing the levels of circulating IL-18 in SLE patients and healthy controls, and studies of the relationship between IL-18 levels and SLE activity have shown mixed results. These disparities may be due to small sample sizes, low statistical power, and/or clinical heterogeneity [5-20]. In order to overcome the limi- tations of individual studies and resolve inconsistencies, we performed a meta-analysis. The present study aimed to determine plasma/serum IL-18 levels in SLE patients compared to those in healthy controls.
MATERIALS AND METHODS
Identification of eligible studies and data extraction
We performed a literature search for studies that exam- ined IL-18 status in SLE patients and controls, and the re- lationship between circulating (serum or plasma) IL-18 levels and SLE activity. PubMed, EMBASE, and Cochrane databases were searched to identify all available articles up to July 2019. The following keywords and subject terms were used in the search: “IL-18,” “serum OR plas- ma OR level OR activity,” “systemic lupus erythematosus,”
and “SLE”. All references cited were also reviewed to identify additional studies not covered by the above-men- tioned electronic databases. Studies were considered eli- gible based on the following inclusion criteria: (1) they were case-control or cross-sectional studies, and (2) they provided data on IL-18 levels in case and control groups.
Studies were excluded if: (1) they contained overlapping or insufficient data, or (2) they were reviews or case reports. Data on methods and results were extracted from the original studies by two independent reviewers. Any discrepancies between reviewers were resolved by con- sensus, and the meta-analysis was conducted in accord- ance with Preferred Reporting Items for Systematic Reviews and Meta-Analysis guidelines [21]. The follow- ing information was extracted from each study: primary author, year of publication, country, ethnicity, number of participants, and mean and standard deviation (SD) of IL-18 levels. When the data given represented medians, interquartile ranges, or ranges, we computed the mean and SD using previously described formulae [22,23].
Evaluation of statistical associations
We performed a meta-analysis examining the relation- ship between IL-18 levels and SLE. For data continuity, results were presented as standardized mean differences (SMDs) or as correlation coefficients and 95% confidence intervals (CIs). SMDs were calculated by dividing the mean difference between two groups by the pooled SD and were used when different scales were utilized to measure the same concept. This measure compares case and control arms in terms of standardized scores. SMD magnitudes were categorized as follows: 0.2∼0.5, small effect; 0.5∼0.8, medium effect; ≥0.8, large effect [24].
We also assessed within-study and between-study varia- bility and heterogeneity using Cochran’s Q-statistics [25]. The heterogeneity test was used to assess the null
hypothesis that all studies were evaluating the same effect. When the Q-statistic indicated significant (p<
0.10) heterogeneity across studies, a random effects model was used in the meta-analysis [26]. If significant heterogeneity was not detected, a fixed effects model was used. The fixed effects model assumed that all studies es- timated the same underlying effect, and therefore consid- ered within-study variation only [25]. We quantified the effect of heterogeneity using I2=100%×(Q-df)/Q [27], where I2 measured the degree of inconsistency between studies and determined whether the percentage total var- iation across studies was due to heterogeneity rather than chance. I2 values ranged between 0% and 100%; I2 values of 25%, 50%, and 75% were referred to as low, moderate, and high estimates, respectively [27]. Statistical manipu- lations were performed using the Comprehensive Meta- Analysis computer program (Biostat Inc., Englewood, NJ, USA).
Evaluation of heterogeneity, sensitivity test, and publication bias
To examine potential sources of heterogeneity observed in the meta-analysis, a meta-regression analysis was per- formed using the following variables: ethnicity, data type, adjustment for age and/or sex, and sample size. A sensi- tivity test to assess the influence of each individual study on the pooled SMR was performed by omitting each study individually. We evaluated publication bias using funnel plots and Egger’s linear regression test [28], which meas- ured funnel plot asymmetry using a natural logarithm scale of SMRs. When asymmetry was indicated, we used the “trim and fill” method to adjust summary estimates for the observed bias [29]. This method removes small studies until funnel plot symmetry is achieved by re- calculating the center of the funnel before the removed studies are replaced with their missing mirror-image coun- terparts; a revised summary estimate was then calculated using all original studies and hypothetical “filled” studies.
RESULTS
Studies included in the meta-analysis
We identified 134 studies using electronic and manual search methods and 21 of these were selected for full-text review based on the title and abstract. We excluded 5 studies because they had no data on IL-18 levels, or con- tained duplicate data. Ultimately, 16 articles met the in- clusion criteria [5-20], and they were considered in the
Table 2. Meta-analysis of the association between circulating IL-18 levels and SLE Groups Population No. of
studies
Test of association Test of heterogeneity
SMD† 95% CI p-value Model p-value I2
All Overall 18 1.556 1.087~2.024 <0.001 R <0.001 91.0
Ethnicity European 4 0.929 0.596~1.261 <0.001 F 0.868 0
Asian 10 1.397 0.828~1.966 <0.001 R <0.001 88.9
Arab 4 2.549 0.916~4.183 0.002 R <0.001 96.5
Adjustment Yes* 11 1.701 1.062~2.339 <0.001 R <0.001 92.7
NA 7 0.898 0.663~1.134 <0.001 R <0.001 86.4
Sample size Number ≥50 12 1.560 0.992~2.128 <0.001 R <0.001 92.8
Number <50 6 1.566 0.647~2.486 0.001 R <0.001 85.6
Data type Original 13 1.652 1.040~2.264 <0.001 R <0.001 92.1
Calculated 5 1.343 0.578~2.108 0.001 R <0.001 88.5
IL-18: interleukin-18, SLE: systemic lupus erythematosus, SMD: standard mean difference, CI: confidence interval, NA: not available, F: fixed effects model, R: random effects model. *Adjustment or non-significance for age- and/or sex. †Magnitude of Cohen’s d effect size (SMD), where 0.2 to 0.5 is a small effect, 0.5 to 0.8 is a medium effect, and ≥0.8 is a large effect.
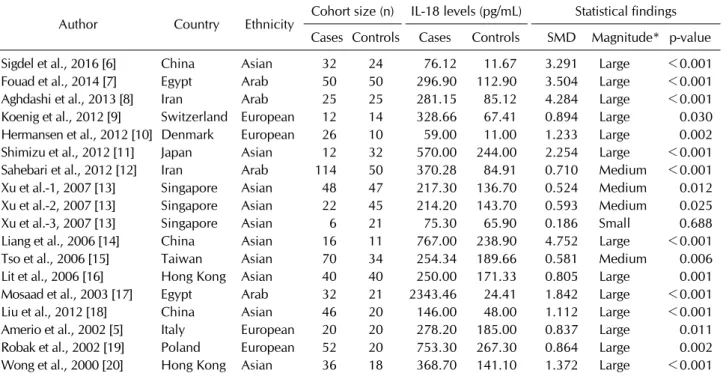
Table 1. Characteristics of individual studies included in the meta-analysis
Author Country Ethnicity Cohort size (n) IL-18 levels (pg/mL) Statistical findings Cases Controls Cases Controls SMD Magnitude* p-value
Sigdel et al., 2016 [6] China Asian 32 24 76.12 11.67 3.291 Large <0.001
Fouad et al., 2014 [7] Egypt Arab 50 50 296.90 112.90 3.504 Large <0.001
Aghdashi et al., 2013 [8] Iran Arab 25 25 281.15 85.12 4.284 Large <0.001
Koenig et al., 2012 [9] Switzerland European 12 14 328.66 67.41 0.894 Large 0.030 Hermansen et al., 2012 [10] Denmark European 26 10 59.00 11.00 1.233 Large 0.002
Shimizu et al., 2012 [11] Japan Asian 12 32 570.00 244.00 2.254 Large <0.001
Sahebari et al., 2012 [12] Iran Arab 114 50 370.28 84.91 0.710 Medium <0.001
Xu et al.-1, 2007 [13] Singapore Asian 48 47 217.30 136.70 0.524 Medium 0.012 Xu et al.-2, 2007 [13] Singapore Asian 22 45 214.20 143.70 0.593 Medium 0.025
Xu et al.-3, 2007 [13] Singapore Asian 6 21 75.30 65.90 0.186 Small 0.688
Liang et al., 2006 [14] China Asian 16 11 767.00 238.90 4.752 Large <0.001
Tso et al., 2006 [15] Taiwan Asian 70 34 254.34 189.66 0.581 Medium 0.006
Lit et al., 2006 [16] Hong Kong Asian 40 40 250.00 171.33 0.805 Large 0.001
Mosaad et al., 2003 [17] Egypt Arab 32 21 2343.46 24.41 1.842 Large <0.001
Liu et al., 2012 [18] China Asian 46 20 146.00 48.00 1.112 Large <0.001
Amerio et al., 2002 [5] Italy European 20 20 278.20 185.00 0.837 Large 0.011
Robak et al., 2002 [19] Poland European 52 20 753.30 267.30 0.864 Large 0.002 Wong et al., 2000 [20] Hong Kong Asian 36 18 368.70 141.10 1.372 Large <0.001 IL-18: interleukin -18, SMD: standard mean difference. *Magnitude of Cohen’s d effect size, where 0.2 to 0.5 is a small effect, 0.5 to 0.8 is a medium effect, and ≥0.8 is a large effect.
meta-analysis, which comprised 659 SLE patients and 502 controls (Table 1). Table 1 summarizes selected char- acteristics of these studies that were related to the associ- ation between IL-18 levels and SLE.
Meta-analysis comparing the circulating IL-18 levels between SLE patients and controls
IL-18 levels were significantly higher in the SLE group
than in the control group (SMD=1.556, 95% CI=1.087∼
2.024, p<0.001) (Table 2, Figure 1). Stratifying data by ethnicity showed a significantly elevated IL-18 level in the SLE group in European, Asian, and Arab populations (Table 2). Stratification by adjustment for age and/or sex revealed a significantly higher IL-18 level in the SLE group, independently of the adjustment (Table 2). Subgroup analysis by sample size showed significantly higher IL-18
Figure 1. Meta-analysis of relationship of interleukin-18 level with systemic lupus erythematosus (SLE). Std diff: standardized differ- ence, CI: confidence interval.
Figure 2. Funnel plot investigating the relation of inter- leukin-18 with systemic lupus erythematosus (Egger re- gression p-value=0.003). Filled circles reflect studies showing publication bias. Diamonds at the bottom of the figure display estimates of summary effect before (open) and after (filled) ad- justment of publishing bias. Std diff: standardized difference, Std err: standardized error.
levels in the SLE group for both large sample (n≥50) and small sample (n<50) subgroups (Table 2). Subgroup analysis by data type showed significantly higher IL-18 levels in the SLE group for both original and calculated data populations (Table 2).
Heterogeneity, sensitivity testing, and publication bias
Between-study heterogeneity was identified during the meta-analyses of IL-18 status in SLE patients (Table 2).
Meta-regression analysis showed that ethnicity (p=
0.019) and adjustment (p=0.010), but not data type (p=0.167) or sample size (p=0.420) had significant im- pacts on heterogeneity in the meta-analyses of IL-18 levels. Sensitivity analysis showed that no individual study significantly affected the pooled odds ration (OR), indicating that the results of this meta-analysis are robust. Publication bias can lead to a disproportionate number of positive studies and poses a problem for meta-analyses. Since Egger’s regression test showed evi- dence of publication bias (Egger’s regression test p-val- ues=0.003) and the funnel plot showed asymmetry, the
“trim and fill” method was used to adjust for publication bias (Figure 2). However, the SMD that was significant before adjustment remained significant (SMD=1.720, 95% CI=1.225∼2.214).
DISCUSSION
In this meta-analysis, we combined the evidence of cir- culating IL-18 levels in SLE. The 16 included studies rep- resented 659 SLE patients and 502 controls and showed that circulating IL-18 levels were significantly higher in
the SLE group than in the control group. The results from this meta-analysis suggest that circulating IL-18 may play a role in the pathogenesis of SLE.
IL-18 is a pro-inflammatory member of the IL-1 cyto- kine superfamily that elicits innate and acquired immune responses [30]. IL-18 is expressed in immune cells such as NK cells, dendritic cells, and macrophages. In addition, IL-18 expression is upregulated during SLE, and has been correlated with SLE activity [5]. A previous study also showed that IL-18 can accelerate lupus-like autoimmune disease in MRL/lpr mice [31]. Our meta-analysis showed that there was a significant association between high IL-18 levels and SLE, independent of potential con- founders such as ethnicity, sample size, or data type. The source of elevated circulating IL-18 in patients with SLE is unclear, however it may be related to a genetic factor, as previous work has shown that overproduction of IL-18 may be due to polymorphisms in regulatory regions of the IL-18 gene, which is located on chromosome 11q22.2–
q22.3 [32]. Indeed, three polymorphisms in the IL-18 promoter region (–607 C/A [rs1946518], –137 G/C [rs187238], and –1297 C/T [rs360719]) alter IL-18 pro- moter activity by changing its transcription activity [33].
In addition, a previous meta-analysis found that these IL-18 polymorphisms are associated with the develop- ment of SLE [34]. Because IL-18 is located within the SLE chromosomal susceptibility locus, it is considered that IL-18 is a factor in the genetic susceptibility to SLE [35].
It is not known whether the association found in this meta-analysis is the cause or the consequence of in- creased IL-18. However, increased IL-18 may be a cause rather than a consequence of disease development, be- cause genetic variation in IL-18 may be associated with higher IL-18 levels.
This meta-analysis has several limitations that should be considered. First, the majority of studies had a small sample size, and only a few studies evaluated the correla- tion coefficients between IL-18 levels and SLE activity.
Thus, the meta-analysis may have been underpowered.
Second, the studies included in the meta-analysis were heterogeneous in demographic characteristics and clin- ical features. Therefore the heterogeneity, confounding factors, and limited clinical information provided by the study population may have affected our results. In addi- tion, these limited data did not permit further analysis, al- though we performed a sensitivity test and a meta-re- gression analysis. Despite these limitations, this meta- analysis also has several strengths. To the best of our
knowledge, our meta-analysis is the first to provide com- bined evidence for IL-18 status in SLE patients. In addi- tion, previous studies used population sizes that ranged from 6 to 114, whereas we presented a pooled analysis of 659 patients. Similarly, by pooling the results of in- dependent analyses, our analysis of the relationship be- tween IL-18 levels and SLE had increased statistical pow- er and resolution and therefore greater accuracy in com- parison to previous individual studies.
CONCLUSION
In conclusion, our meta-analysis demonstrated that cir- culating IL-18 levels were significantly higher in patients with SLE than in controls, regardless of ethnicity, sample size, and data type evaluated, and that a significantly pos- itive correlation existed between IL-18 level and SLE activity. Thus, our meta-analysis suggests that IL-18 plays a critical role in SLE, though further studies are necessary to elucidate the mechanism through which IL-18 levels directly contribute to the pathogenesis of SLE.
CONFLICT OF INTEREST
No potential conflict of interest relevant to this article was reported.
AUTHOR CONTRIBUTIONS
Y.H.L. was involved in conception and design of study, acquisition of data, analysis and/or interpretation of data, drafting the manuscript, revising the manuscript crit- ically for important intellectual content. G.G.S. was in- volved in conception and design of study, analysis and/or interpretation of data, drafting the manuscript
REFERENCES
1. Ruiz-Irastorza G, Khamashta MA, Castellino G, Hughes GR. Systemic lupus erythematosus. Lancet 2001;357:
1027-32.
2. Shao WH, Cohen PL. Disturbances of apoptotic cell clear- ance in systemic lupus erythematosus. Arthritis Res Ther 2011;13:202.
3. Nakamura K, Okamura H, Wada M, Nagata K, Tamura T.
Endotoxin-induced serum factor that stimulates gamma in- terferon production. Infect Immun 1989;57:590-5.
4. Nakanishi K. Unique action of interleukin-18 on T cells and other immune cells. Front Immunol 2018;9:763.
5. Amerio P, Frezzolini A, Abeni D, Teofoli P, Girardelli CR,
De Pità O, et al. Increased IL-18 in patients with systemic lu- pus erythematosus: relations with Th-1, Th-2, pro-in- flammatory cytokines and disease activity. IL-18 is a marker of disease activity but does not correlate with pro-in- flammatory cytokines. Clin Exp Rheumatol 2002;20:535-8.
6. Sigdel KR, Duan L, Wang Y, Hu W, Wang N, Sun Q, et al.
Serum cytokines Th1, Th2, and Th17 expression profiling in active lupus nephritis-IV: from a Southern Chinese Han population. Mediators Inflamm 2016;2016:4927530.
7. Fouad NA, Baraka EA, Hassan WA. Interleukin-18 gene polymorphisms in systemic lupus erythematosus: relation to disease status. Egypt J Immunol 2014;21:1-12.
8. Aghdashi M, Aribi S, Salami S. Serum levels of IL-18 in Iranian females with systemic lupus erythematosus. Med Arch 2013;67:237-40.
9. Koenig KF, Groeschl I, Pesickova SS, Tesar V, Eisenberger U, Trendelenburg M. Serum cytokine profile in patients with active lupus nephritis. Cytokine 2012;60:410-6.
10. Hermansen ML, Hummelshøj L, Lundsgaard D, Hornum L, Keller P, Fleckner J, et al. Increased serum β2-micro- globulin is associated with clinical and immunological markers of disease activity in systemic lupus erythematosus patients. Lupus 2012;21:1098-104.
11. Shimizu C, Fujita T, Fuke Y, Ito K, Satomura A, Matsumoto K, et al. High circulating levels of interleukin-18 binding protein indicate the severity of glomerular involvement in systemic lupus erythematosus. Mod Rheumatol 2012;22:73-9.
12. Sahebari M, Rezaieyazdi Z, Nakhjavani MJ, Hatef M, Mahmoudi M, Akhlaghi S. Correlation between serum con- centrations of soluble Fas (CD95/Apo-1) and IL-18 in pa- tients with systemic lupus erythematosus. Rheumatol Int 2012;32:601-6.
13. Xu Q, Tin SK, Sivalingam SP, Thumboo J, Koh DR, Fong KY.
Interleukin-18 promoter gene polymorphisms in Chinese patients with systemic lupus erythematosus: association with CC genotype at position -607. Ann Acad Med Singapore 2007;36:91-5.
14. Liang D, Ma W, Yao C, Liu H, Chen X. Imbalance of inter- leukin 18 and interleukin 18 binding protein in patients with lupus nephritis. Cell Mol Immunol 2006;3:303-6.
15. Tso TK, Huang WN, Huang HY, Chang CK. Elevation of plasma interleukin-18 concentration is associated with in- sulin levels in patients with systemic lupus erythematosus.
Lupus 2006;15:207-12.
16. Lit LC, Wong CK, Tam LS, Li EK, Lam CW. Raised plasma concentration and ex vivo production of inflammatory che- mokines in patients with systemic lupus erythematosus.
Ann Rheum Dis 2006;65:209-15.
17. Mosaad YM, Metwally SS, Auf FA, AbdEL-Samee ER, el-Deek B, Limon NI, et al. Proinflammatory cytokines (IL-12 and IL-18) in immune rheumatic diseases: relation with disease activity and autoantibodies production. Egypt J Immunol 2003;10:19-26.
18. Liu X, Bao C, Hu D. Elevated interleukin-18 and skewed Th1:Th2 immune response in lupus nephritis. Rheumatol
Int 2012;32:223-9.
19. Robak E, Woźniacka A, Sysa-Jedrzejowska A, Stepień H, Robak T. Circulating angiogenesis inhibitor endostatin and positive endothelial growth regulators in patients with sys- temic lupus erythematosus. Lupus 2002;11:348-55.
20. Wong CK, Ho CY, Li EK, Lam CW. Elevation of proin- flammatory cytokine (IL-18, IL-17, IL-12) and Th2 cytokine (IL-4) concentrations in patients with systemic lupus er- ythematosus. Lupus 2000;9:589-93.
21. Moher D, Liberati A, Tetzlaff J, Altman DG; PRISMA Group.
Preferred reporting items for systematic reviews and meta-analyses: the PRISMA statement. PLoS Med 2009;
6:e1000097.
22. Hozo SP, Djulbegovic B, Hozo I. Estimating the mean and variance from the median, range, and the size of a sample.
BMC Med Res Methodol 2005;5:13.
23. Ridout KK, Ridout SJ, Price LH, Sen S, Tyrka AR. Depression and telomere length: a meta-analysis. J Affect Disord 2016;191:237-47.
24. Cohen J. Statistical power analysis for the behavioral sciences. 2nd ed. Hillsdale, Lawrence Eribaum Associated, 1988.
25. Egger M, Smith GD, Phillips AN. Meta-analysis: principles and procedures. BMJ 1997;315:1533-7.
26. DerSimonian R, Laird N. Meta-analysis in clinical trials.
Control Clin Trials 1986;7:177-88.
27. Higgins JP, Thompson SG. Quantifying heterogeneity in a meta-analysis. Stat Med 2002;21:1539-58.
28. Egger M, Davey Smith G, Schneider M, Minder C. Bias in meta-analysis detected by a simple, graphical test. BMJ 1997;315:629-34.
29. Duval S, Tweedie R. Trim and fill: a simple funnel-plot- based method of testing and adjusting for publication bias in meta-analysis. Biometrics 2000;56:455-63.
30. [The levels of plasminogen and inhibitor of plasminogen ac- tivators of type 1 in antiphospholipid syndrome]. Ter Arkh 2012;84:50-7. Russian
31. Neumann D, Del Giudice E, Ciaramella A, Boraschi D, Bossù P. Lymphocytes from autoimmune MRL lpr/lpr mice are hyperresponsive to IL-18 and overexpress the IL-18 re- ceptor accessory chain. J Immunol 2001;166:3757-62.
32. Nolan KF, Greaves DR, Waldmann H. The human inter- leukin 18 gene IL18 maps to 11q22.2-q22.3, closely linked to the DRD2 gene locus and distinct from mapped IDDM loci. Genomics 1998;51:161-3.
33. Giedraitis V, He B, Huang WX, Hillert J. Cloning and muta- tion analysis of the human IL-18 promoter: a possible role of polymorphisms in expression regulation. J Neuroimmunol 2001;112:146-52.
34. Song GG, Choi SJ, Ji JD, Lee YH. Association between inter- leukin-18 polymorphisms and systemic lupus eryth- ematosus: a meta-analysis. Mol Biol Rep 2013;40:2581-7.
35. Lee YH, Nath SK. Systemic lupus erythematosus suscepti- bility loci defined by genome scan meta-analysis. Hum Genet 2005;118:434-43.