The effects of Pongamia pinnata on osteogenic differentiation and mineralization of human stem cells
derived from the gingiva
Hyunjin Lee
1, Md. Salah Uddin
2, Yong-In Kim
3, Sangho Choi
3, Jun-Beom Park
11Department of Periodontics, College of Medicine, The Catholic University of Korea, Seoul, Republic of Korea
2Ethnobotanical Database of Bangladesh, People's Republic of Bangladesh
3International Biological Material Research Center, Korea Research Institute of Bioscience and Biotechnology, Daejeon, Republic of Korea
Original Article
⋅Received:22 July 2017 ⋅Revised:25 November 2017 ⋅Accepted:1 December 2017
⋅Correspondence to:Jun-Beom Park
Department of Periodontics, Seoul St Mary’s Hospital, College of Medicine, The Catholic University of Korea 222 Banpo-daero, Seocho-gu, Seoul, 06591, Republic of Korea
Tel:+82-10-4325-2651, Fax:+82-2-537-2374, E-mail:[email protected]
Objectives: The aim of the present study is to evaluate the effects of the extract of Pongamia pinnata on the morphology, viability, and differentiation potential of human stem cells derived from the gingiva.
Methods: Stem cells obtained from gingivae were cultured in an osteogenic medium in the presence of methanol extract of Pongamia pinnata (PPT) at concentrations ranging from 0.001 to 1%. Evaluations of cell morphology and cellular viability were done at Day 1. Alkaline phosphatase activity assays and Alizarin red S staining were performed to evaluate the osteogenic differentiation of stem cells.
Results: The morphology of stem cells in the presence of PPT at final concentrations of 0%, 0.001%, 0.01%, 0.1%, and 1% did not produce any noticeable changes when compared with the untreated control group. Application of PPT produced a significant increase in alkaline phosphatase activity when compared to the control group. The results of the Alizarin Red S staining showed a significant increase of absorbance with the 0.001% group.
Conclusions: Based on these findings, it was concluded that PPT could produce beneficial effects on mesenchymal stem cells with enhanced osteogenic differentiation.
Key Words : cell differentiation, herbal medicine, Pongamia, stem cells
Introduction
Stem cells have unique properties, including the capability of dividing and renewing themselves and the ability to give rise to specialized cell types.
1)Stem cells have been applied in regenerative medicine.
2)Herbs have been used clinically for thousands of years, and these were suggested to be an effective source of therapeutics.
3)Moreover, in recent years, the effects of medicinal herbs on stem
cells have been tested.
3-5)The application of Cimicifugae rhizoma increased cell proliferation without morphologic changes.
5)Similarly, Angelicae dahuricae radix produced a marginal increase in stem cell proliferation.
4)The effect of differentiation of stem cells has been
of interest. A previous report suggested that the
therapeutic potential of stem cells has limitations due
to cell survival and differentiation capabilities.
6)Thus, the effects of herbal extracts on differentiation
of stem cells have been studied.
7,8)Tanshinone from the Danshen herb is shown to enhance osteogenic differentiation of bone marrow mesenchymal stem cells.
8)Maohuoside A from Epimedium koreanum Nakai, one of the most used herbs in East Asia for curing osteoporosis,
9,10)is shown to promote osteogenesis of mesenchymal stem cells via BMP and MAPK signaling pathways.
7)Moreover, the effects of herbal extracts have been tested on stem cells derived from the intraoral area. Zanthoxylum schinifolium herbal extract is reported to enhance the osteogenic potential of periodontal ligament stem cells.
11)Pongamia pinnata (L.) Pierre has long been used in Oriental medicine to cure various diseases, including skin diseases and infectious diseases.
12-15)However, the effects of Pongamia pinnata on stem cells have rarely been tested. The aim of the present study is to evaluate the effects of the extract of Pongamia pinnata on the morphology, viability, and differentiation potential of human stem cells derived from the gingiva. Within the authors’ knowledge, this investigation is the first to elucidate the effects of Pongamia pinnata on mesenchymal stem cells derived from gingiva.
Methods
1. Preparation of the materials
Pongamia pinnata (L.) Pierre was collected from Noakhali in Bangladesh by Md Salah Uddin. A voucher specimen recoded as PB022015 was deposited in the herbarium of the Korea Research Institute of Bioscience and Biotechnology. The dried seeds of Pongamia pinnata were ground. Five hundred mL of methanol was added to 58 g of the powder. The repercolation method was used for the extraction process at room temperature. The resultant product was filtered and concentrated under reduced pressure. Finally, 15.04 g of methanol extract of Pongamia pinnata (PPT) was obtained.
2. Isolation of stem cells from human tissue
The gingivae were obtained from healthy patients visiting the Department of Periodontics, Seoul St.
Mary’s Hospital, College of Medicine, the Catholic University of Korea. The Institutional Review Board reviewed and approved the study (KC11SISI0348).
The participants signed informed consent forms. All the procedures were performed in accordance with the relevant guidelines and regulations. Isolation procedures were done based on the previous publication.
16) In short, the obtained gingiva wasdigested with dispase (Sigma-Aldrich Co., St. Louis, MO, USA) at 1 mg/mL and collagenase IV (Sigma-Aldrich Co) at a 2 mg/mL concentration.
3. Evaluation of cellular morphology Stem cells were plated at a density of 2.0 × 10
3cells/well in an osteogenic medium (alpha-minimal essential medium (α-MEM, Gibco, Grand Island, NY, USA) supplemented with 15% fetal bovine serum (FBS, Gibco), 200 mM L-glutamine (Sigma-Aldrich Co.), 10 mM of ascorbic acid 2-phosphate (Sigma-Aldrich Co.), 38 ug/ml of dexamethasone, 2 mg/ml of glycerophosphate disodium salt hydrate, and 100 U/mL penicillin, and 100 μg/mL streptomycin (Sigma-Aldrich Co.)) The final concentrations of PPT were 0%, 0.001%, 0.01%, 0.1%, and 1%, respectively. The morphological evaluation was performed on Day 1 using inverted microscopy (CKX41SF, Olympus Corporation, Tokyo, Japan).
4. Evaluation of cellular viability
The cellular viability was evaluated on Day 1 based on the previous report using the Counting Kit-8 (CCK-8, Dojindo, Tokyo, Japan) assay.
17)In short, cells were incubated with tetrazolium monosodium salt for 2 hours at 37 ˚C.
Spectrophotometric absorbance at 450 nm was
measured using a microplate reader (BioTek Instruments Inc., Winooski, VT, USA).
5. Alkaline phosphatase activity assays Alkaline phosphatase activity assays were done on Days 3 and 7 using a commercially available kit (K412-500, BioVision, Inc., Milpitas, CA, USA). A microplate reader (BioTek Instruments Inc.) was used to measure the spectrophotometric absorbance of the samples.
6. Evaluation of Alizarin Red S staining On Days 3 and 7, Alizarin Red S staining was performed. In short, the cells were washed, fixed, and stained with 2% Alizarin Red S Solution (ScienCell Research Laboratories, Inc., Carlsbad, CA, USA) and evaluated with a microscope (CKX41SF, Olympus Corporation). Ten percent cetylpyridinium chloride (Sigma-Aldrich Co.) was used to solubilize the bound dye, and spectrophotometric quantification was performed at 560 nm (BioTek Instruments Inc.).
7. Statistical analysis
The data are presented as means ± standard deviations. A test of normality was performed and a one-way analysis of variance with a post hoc test was performed to determine the differences between the groups. The tests were performed using a commercially available program (SPSS 12 for Windows, SPSS Inc., Chicago, IL, USA), and the level of significance was 0.05.
Results
1. Evaluation of cell morphology
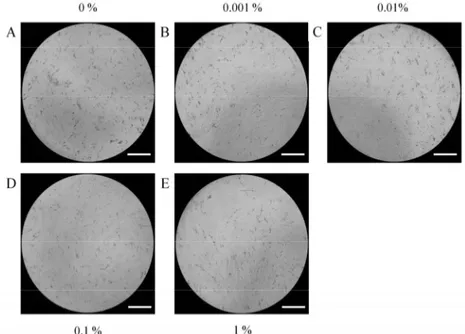
The morphology of stem cells treated with PPT at final concentrations of 0%, 0.001%, 0.01%, 0.1%, and 1% on Day 1 is shown in Figure 1. Stem cells in the control group showed fibroblast-like morphology on Day 1 (Figure 1A). The morphology
of stem cells in the presence of PPT at final concentrations of 0%, 0.001%, 0.01%, 0.1%, and 1%
did not produce any noticeable changes when compared with the untreated control group (Figures 1B–1E).
2. Cellular viability
Results from the CCK8 assay revealed cellular viability on Day 1 and are shown in Figure 2. The relative values of CCK-8 at Day 1 for 0.001%, 0.01%, 0.1%, and 1% are 94.0 ± 5.4, 94.3 ± 7.2, 91.1 ± 4.9, and 86.5 ± 5.2, respectively, when the control (0%) group at Day 1 is considered 100%
(100.0 ± 5.1%) (P > 0.05).
3. Alkaline phosphatase activity assays The alkaline phosphatase activity treated with PPT at Days 3 and 7 is shown in Figure 3. The absorbance values of cells on Day 3 grown with 0%, 0.001%, 0.01%, 0.1%, and 1% PPT were 0.073 ± 0.000, 0.075 ± 0.001, 0.083 ± 0.000, 0.078 ± 0.002, 0.001, and 0.081 ± 0.001, respectively. The treatment of PPT (from 0.001 to 1% groups) showed a statistically significant increase in alkaline phosphatase activity when compared to the control group at Day 3 (P < 0.05). Application of PPT produced a statistically significant increase of alkaline phosphatase activity with the highest value at 0.01%. The absorbance values of cells on Day 7 grown with 0%, 0.001%, 0.01%, 0.1%, and 1% PPT were 0.104 ± 0.001, 0.110 ± 0.000, 0.122 ± 0.001, 0.130 ± 0.001, and 0.121 ± 0.000, respectively (P <
0.05). Similarly, application of PPT produced a statistically significant increase of alkaline phosphatase activity and the highest value was seen at 0.1% group.
4. Mineralization assay
The results of the Alizarin Red S staining on
Days 3 and 7 following treatment with different
Fig. 1. Evaluation of cell morphology on Day 1 using inverted microscopy following treatment with different concentrations of PPT in osteogenic media.
A. Control group (original magnification x 200) B. 0.001% group (original magnification x 200) C. 0.01% group (original magnification x 200) D. 0.1% group (original magnification x 200) E. 1% group (original magnification x 200) The bar indicates 200 μm.
Fig. 2. The CCK-8 assay results at Day 1 cultured with osteogenic media.
The data are presented as means ± standard deviations.
Fig. 3. Alkaline phosphatase activity on Days 3 and 7.
The data are presented as means ± standard deviations.
* Statistically significant differences were noted when compared with the data from the control group at Day 3 (P < 0.05).
** Statistically significant differences were noted when compared with the data from the control group at Day 7 (P < 0.05).
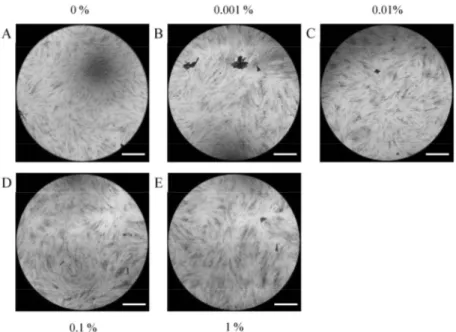
Fig. 4. Results of Alizarin Red S staining on Day 3 following treatment with different concentrations of PPT on osteogenic supplement.
A. Control group (original magnification x 100) B. 0.001% group (original magnification x 100) C. 0.01% group (original magnification x 100) D. 0.1% group (original magnification x 100) E. 1% group (original magnification x 100) The bar indicates 400 μm.
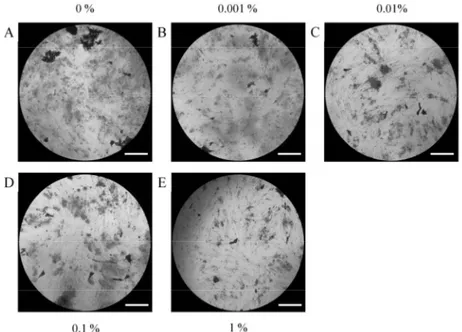
Fig. 5. Results of Alizarin Red S staining on Day 7 following treatment with different concentrations of PPT on osteogenic supplement.
A. Control group (original magnification x 100) B. 0.001% group (original magnification x 100) C. 0.01% group (original magnification x 100) D. 0.1% group (original magnification x 100) E. 1% group (original magnification x 100) The bar indicates 400 μm.
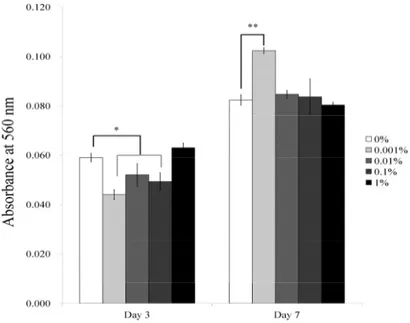
concentrations of PPT in an osteogenic supplement are shown in Figures 4-5. The absorbance of cells on Day 3 cultured with 0%, 0.001%, 0.01%, 0.1%, and 1% PPT was 0.059 ± 0.002, 0.044 ± 0.002, 0.052 ± 0.005, 0.049 ± 0.004, and 0.063 ± 0.002, respectively (Figure 6). The absorbance of cells on Day 7 cultured with 0%, 0.001%, 0.01%, 0.1%, and 1%
PPT was 0.082 ± 0.002, 0.102 ± 0.001, 0.085 ± 0.002, 0.084 ± 0.007, and 0.080 ± 0.001, respectively. A statistically significant increase of absorbance was noted with the 0.001% group on Day 7 (P < 0.05).
Discussion
This report discusses the effects of different concentrations of PPT on the osteogenic differentiation of stem cells derived from gingival
tissues. This study clearly showed that short-term application of PPT enhanced the proliferation of mesenchymal stem cells.
The application of a low dose of PPT enhanced alkaline phosphatase activity up to 25% and mineralization up to 24%. Alkaline phosphatase activity is used for the evaluation of early osteogenic differentiation.
1)and Alizarin red S staining assay measures the presence of calcium in cellular deposits which is used for the evaluation of early matrix mineralization.
17)Alkaline phosphatase activities increased between 3 and 7 days and mineralization increased between 3 and 7 Days. The highest alkaline phosphatase activity was achieved with 0.01%
PPT on Day 3 and 0.01% group on Day 7. A
significant increase in mineralization was
Fig. 6. Quantitative results of Alizarin Red S staining on Days 3 and 7.
The data are presented as means ± standard deviations.
* Statistically significant differences were noted when compared with the data from the control group at Day 3 (P < 0.05).
** Statistically significant differences were noted when compared with the data from the control group at Day 7 (P < 0.05).