INTRODUCTION
It has long been recognized that insulin resistance syn- drome (IRS) encompasses insulin resistance, hyperinsuline- mia, hypertension, dyslipidemia, diabetes, impaired glucose intolerance, and obesity. Reaven (1) designated this clinical syndrome as ‘‘Syndrome X’’ in 1988. More recently, it has been called ‘‘metabolic syndrome’’, ‘‘plurimetabolic synd- rome’’, ‘‘dysmetabolic syndrome’’, ‘‘deadly quartet’’, or ‘‘major cardiovascular risk factor syndrome’’ (2), with concomitant difficulties for standardized studies because of unclear diag- nostic criteria (3). Since the causes of insulin resistance had not yet been identified, in 1998, the WHO named this dis- ease entity ‘‘metabolic syndrome’’ rather than ‘‘insulin resis- tance syndrome’’ and suggested diagnostic criteria includ- ing hypertension, dyslipidemia, obesity, microproteinuria, diabetes, or impaired glucose intolerance as components (4).
Actually, these diagnostic criteria generally were not avail-
able due to the limitations of diagnostic procedures such as the measurement of microproteinuria, which required a 24- hr time period to obtain results. The Adult Treatment Panel (ATP) report of the National Cholesterol Education Program (NCEP) suggested new diagnostic criteria in 2001 (5). In this report, the components and criteria were set up more succinct- ly than those of the WHO. In 2002, the American College of Endocrinology/American Association of Clinical Endocri- nologists (ACE/AACE) suggested new diagnostic criteria for metabolic syndrome that highlighted the role of insulin resis- tance (6). These clinical diagnostic criteria were simplified to be applied more easily.
In the San Antonio Study (7), which is the representative epidemiological study that supports the concept of IRS, the prevalence of obesity, type 2 diabetes, impaired glucose intol- erance, hypertension, hypertriglyceridemia, and hypercho- lesterolemia among 2,930 people was investigated. Among the 2,930 participants, results obtained from 1,881 (64%)
Soo-Geun Kim, Hyun-Sul Lim*, Hae-Kwan Cheong�, Chong-Soon Kim�, Hyun-Ju Seo�
Health Management Division, Radiation Health Research Institute, Korea Hydro and Nuclear Power.
Co., LTD., Department of Occupational Medicine, Kangbuk Samsung Hospital, Sungkyunkwan University School of Medicine, Seoul; Department of Preventive Medicine*, College of Medicine, Dongguk University, Kyungju; Department of Preventive Medicine�, Sungkyunkwan University School of Medicine, Suwon; Radiation Health Research Institute, Korea Hydro and Nuclear Power. Co., LTD.�, Seoul;
Health Management Division, Radiation Health Research Institute, Korea Hydro and Nuclear Power.
Co., LTD., Graduate School of Public Health�, Korea University, Seoul, Korea
Address for correspondence Soo-Geun Kim, M.D.
Department of Occupational Medicine, Kangbuk Samsung Hospital, Sungkyunkwan University School of Medicine, 108 Pyung-dong, Jongno-gu, Seoul 110-746, Korea
Tel : +82.2-2001-2445, Fax : +82.2-2001-2650 E-mail : [email protected]
*This research was funded by Research Grant A04NS02 from the Korea Hydro and Nuclear Power Co., LTD.
968 DOI: 10.3346/jkms.2007.22.6.968
Incidence and Risk Factors of Insulin Resistance Syndrome in 20-59 Year-Old Korean Male Workers
We investigated the incidence of insulin resistance syndrome (IRS) according to the criteria of diagnoses suggested by the American College of Endocrinology/
American Association of Clinical Endocrinologists and the risk factors associated with the development of IRS. Among 2,048 subjects without a history of/or drug treatment for hypertension, diabetes, dyslipidemia with normal findings at base- line, 1,578 subjects aged 20-59 yr were followed prospectively for 2 yr. The inci- dence of IRS was 6.9 per 100 persons/year. The relative risk (RR) due to age was 1.03 (95% CI: 1.00-1.05) with every one-year increase in age. The RR associat- ed with an abnormal waist-hip ratio group (≥≥0.9) was increased by 1.74 (95% CI:
1.17-2.58) compared to the normal group (<0.9); RR associated with abnormal alanine transferase was increased (≥≥35 IU/L) by 1.70 (95% CI: 1.20-2.41) com- pared to the normal group (<35 IU/L); and the RR associated with abnormal low- density lipoprotein (LDL) cholesterol was increased (≥≥160 mg/L) by 1.70 (95%
CI: 1.19-2.44) compared to the normal LDL cholesterol (<160 mg/L). Lastly, the RR of current smokers was increased by 1.63 (95% CI: 1.09-2.42) compared to that of non-smokers. It is necessary to develop methods of prevention and ther- apeutic approach to manage the integrated risk factors as opposed to individual factors.
Key Words : Insulin Resistance Syndrome; Incidence; Risk Factors
Received : 20 November 2006 Accepted : 9 March 2007
people who had at least one disease showed that the insulin concentration in serum, both fasting and after glucose toler- ance, was positively associated with body mass index (BMI), systolic and diastolic pressure, and the concentration of both triglyceride and total cholesterol in serum. Furthermore, serum insulin was positively associated with the concentration of low high-density lipoprotein (HDL) cholesterol. From these data, it was concluded that these diseases were significantly corre- lated with both fasting and post-prandial insulin concentra- tion in serum, due to the strong association between hyper- insulinemia and insulin resistance.
IRS, which causes serious clinical manifestations and is associated with cardiovascular disease and type 2 diabetes, is remarkable not only in the fields of endocrinology and car- diology, but also is becoming one of the most important problems in public health. It was estimated that IRS in pop- ulations with risk factors of cardiovascular disease will in- crease gradually with expansion of the obese population in the future. There were no researches that applied the re- newed diagnostic criteria of the ACE/AACE, and it was dif- ficult to find a study of the incidence of IRS in Korea.
Therefore, we determined the incidence of IRS based on the diagnostic criteria of the ACE/AACE and the risk fac- tors that influence its development.
MATERIALS AND METHODS Subjects
KHNP cohort (Korea Hydro & Nuclear Power workplace- based cohort) inspected workers working for nuclear power plants. The workers were taken health check-up annually. The aim of this survey is to investigate the impact of the exposure of low-dose radiation on employees’ health status.
Blood samples for biochemical analysis and blood pressure data were collected from March to July in 2002. Subjects in- cluded 5,988 male workers working for hydroelectric and nu- clear power plant. The Korea Hydro & Nuclear Power compa- ny is an electric power company. It is located at Kori, Yong- gwang, Ulchin, Wolsong, and Seoul in Korea. Of these subjects, 2,048 (34.2%) who had no history or drug treatment for hy- pertension, diabetes, or dyslipidemia, and had normal findings according to diagnostic criteria of the ACE/AACE were inves- tigated prospectively for two years; data were collated from the 1,578 (26.4%) subjects that completed the follow-up. Writ- ten informed consent was obtained from all subjects.
Data collection and definition of terms
Data collection was carried out using self-reported ques- tionnaires in 2002 and 2004. Information on lifestyle such as drinking, smoking, physical activity (frequency of exercis- ing more than 30 min a week), and history of diseases (hy-
pertension, diabetes, stroke, and heart disease) was collected.
Subjects who drank two or more times per week were re- garded as heavy drinkers. The smoking status was classified into non-smoking group, ex-smoking group, and current smo- king group. Subjects were also classified into exercise group and non-exercise group according to whether or not they exer- cised three times a week regularly. Height and weight were measured by autoanalyzer (Health Guard, Fanics, Seoul, Korea). In 2002, waist-to-hip ratios were measured using the Inbody 3.0 device (Biospace Co., Ltd, Seoul, Korea), and fast- ing glucose level, lipid profile (total cholesterol, HDL choles- terol, and low-density lipoprotein [LDL]cholesterol), liver function test (aspartate transterase [AST], alanine transferase
[ALT], gamma-glutamyl transferase [ -GT]), HBsAg, HBsAb, and AntiHCV after fasting, were determined. The triglyc- eride level was calculated as follows: triglyceride value=5 (total cholesterol value HDL cholesterol value-LDL choles- terol value). Serum insulin was measured in 2004.
The Inbody 3.0 device is an eight-point tactile-electrode impedance method used for total body assessment. Waist-to- hip ratios were calculated using the impedance index and re- gression equation. BMI was calculated by dividing the weight by square of height. BMI was grouped as <25 kg/m2, 25 kg/
m2 ≤BMI <30 kg/m2, and >30 kg/m2; waist-to-hip ratios (WHRs) were grouped as <0.9 and ≥0.9. The fasting blood level was analyzed by glucose-oxidase assay using an auto- chemistry analyzer. To determine the lipid profile, total choles- terol was analyzed by enzyme assay using COD, HDL choles- terol by glycerol phosphate oxidase assay, LDL cholesterol by direct surfactant assay, and AST, ALT, and -GT by spec- trophotometry using an autochemistry analyzer. The defini- tion of IRS was based on the recent clinical diagnostic crite- ria suggested by the ACE/AACE.
Statistical analysis
We estimated the annual incidence of IRS by 2-yr follow- up among the 1,578 workers that completed the study and who were normal in the first screening. To identify the risk factors that affect the development of insulin resistance syn- drome, chi-square tests to explore the association between categorical variables were employed. Multiple logistic regres- sion analysis was used to test independent variables that were considered as significant relevant factors after univariate analy- sis. Associations were considered statistically significant at the p<0.05 level. The SAS 8.1 statistical software package was used for statistical analysis.
RESULTS Incidence and risk factors of IRS
The prevalence of insulin resistance syndrome calculated
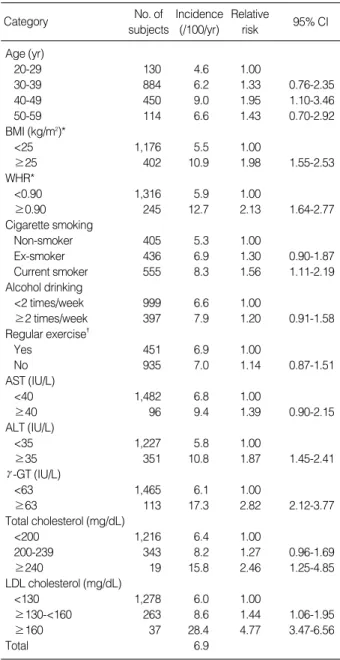
from the data was 6.9 per 100 persons/year, meaning that 218 out of the 1,578 subjects who completed the two year follow-up developed insulin resistance syndrome. After ad- justing the age of the male population in 2004, the adjust- ed incidence was 6.7 per 100 persons/year. Stratification of data according to age groups 20-29, 30-39, 40-49 and 50- 59 revealed incidences of 4.6, 6.2, 9.0, and 6.6 per 100 per- sons/year; thus, the relative risk (RR) of 1.95 (95% CI 1.10- 3.46) for the 40-49 yr-old age group compared to the 20- 29 yr-old age group was statistically significant. According to the BMI distribution, the incidence of IRS in the group with a BMI less than 25 kg/m2was 5.5 compared to 10.9 per 100 persons/year for the group with a BMI ≥25 kg/m2. For the group in which the WHR was less than 0.9, the incidence was 5.9 per 100 persons/year, whereas it was 12.7 per 100 persons/
year in the group of which waist-to-hip ratio was 0.9 or high- er. The RR, calculated using the obesity index-BMI versus the WHR, was 1.98 (95% CI, 1.55-2.53) and 2.13 (95% CI, 1.64- 2.77), respectively, and differences between all groups were statistically significant.
The incidence of IRS was 5.3 per 100 persons/year in the non-smoking group, 6.9 per 100 persons/year in ex-smoking group, and 8.3 per 100 persons/year in current smoking group, showing that the RR of the smoking group compared to the non-smoking group was 1.56 (95% CI 1.11-2.19). The inci- dence of IRS in the group in which people drank less than twi- ce a week was 6.6 vs. 7.9 per 100 persons/ year for the group that drank twice or more a week; this difference was not sta- tistically significant. For the group that exercised three times or more a week regularly, the incidence was 6.9 vs. 7.0 per 100 persons/year in the group of which people did not exer- cise regularly, showing no difference.
The incidence of IRS for the normal-AST group was 6.8 vs.
the abnormal-AST group was 9.4 per 100 persons/year, reveal- ing a slight, but not significant increase in incidence for the abnormal group. The incidence for the normal-ALT group was 5.8, whereas that for the abnormal-ALT group was 10.8 per 100 persons/year. The group with normal -GT showed an incidence of 6.1 vs. 17.3 per 100 persons/year with abnormal -GT. The RR for the abnormal-ALT group and the -GT- abnormal group were 1.87 (95% CI, 1.45-2.41) and 2.84 (95% CI, 2.12-3.77), respectively, and these differences were statistically significant. The incidence for the groups in which total cholesterol was <200 mg/dL, 200 mg/dL ≤total choles- terol <240 mg/dL, and ≥240 mg/dL were 6.4, 8.2, and 15.8, respectively, per 100 persons/year, showing that the RR for the group in which total cholesterol was ≥240 mg/dL was 2.46 (95% CI, 1.25-4.85) compared to the group in which total cholesterol was <200 mg/dL. The incidence in the group of which LDL cholesterol was less than 130 mg/dL was 6.0 compared to 8.6 per 100 persons/year in the group in which that was 130 mg/dL or higher but lower than 160 mg/dL, and 28.4 per 100 persons/year in the group of which that was 160 mg/dL or higher. The RR for the second group above was 1.44
(95% CI, 1.06-1.95), and that for the third group above 4.74 (95% CI, 3.47-6.56), compared to the first group (Table 1).
Logistic regression analysis of risk factors for the development of IRS
Multiple logistic regression analysis of the 1,578 subjects was carried out to determine the risk for development of IRS, after the effect of each risk factor was adjusted. The depen- dent variable was whether insulin resistance syndrome devel- oped or not, and the independent variables were the candidate
BMI, Body mass index; WHR, waist-to-hip ratio; AST, aspartate trans- ferase; ALT, alanine transferase; -GT, gamma-glutamyl transferase.
*Missing value: 17 cases; �missing value: 64 cases; CI, confidence inter- val.
Category No. of
subjects
Incidence (/100/yr)
Relative
risk 95% CI Age (yr)
20-29 130 4.6 1.00
30-39 884 6.2 1.33 0.76-2.35
40-49 450 9.0 1.95 1.10-3.46
50-59 114 6.6 1.43 0.70-2.92
BMI (kg/m2)*
<25 1,176 5.5 1.00
≥25 402 10.9 1.98 1.55-2.53
WHR*
<0.90 1,316 5.9 1.00
≥0.90 245 12.7 2.13 1.64-2.77
Cigarette smoking
Non-smoker 405 5.3 1.00
Ex-smoker 436 6.9 1.30 0.90-1.87
Current smoker 555 8.3 1.56 1.11-2.19
Alcohol drinking
<2 times/week 999 6.6 1.00
≥2 times/week 397 7.9 1.20 0.91-1.58
Regular exercise�
Yes 451 6.9 1.00
No 935 7.0 1.14 0.87-1.51
AST (IU/L)
<40 1,482 6.8 1.00
≥40 96 9.4 1.39 0.90-2.15
ALT (IU/L)
<35 1,227 5.8 1.00
≥35 351 10.8 1.87 1.45-2.41
-GT (IU/L)
<63 1,465 6.1 1.00
≥63 113 17.3 2.82 2.12-3.77
Total cholesterol (mg/dL)
<200 1,216 6.4 1.00
200-239 343 8.2 1.27 0.96-1.69
≥240 19 15.8 2.46 1.25-4.85
LDL cholesterol (mg/dL)
<130 1,278 6.0 1.00
≥130-<160 263 8.6 1.44 1.06-1.95
≥160 37 28.4 4.77 3.47-6.56
Total 6.9
Table 1.Incidence of insulin resistance syndrome related to explanatory variables
risk factors. For independent variables, those that showed a statistical significance on univariate analysis were selected to establish the model. For independent variables, we adopted WHR, LDL cholesterol, and ALT. The reference lines to cat- egorize normal group and abnormal group were WHR 0.9, LDL cholesterol 160 mg/dL, and ALT 35 IU/L. RR for the development of IRS due to age was 1.03 (95% CI 1.00-1.05) and increased as age increased by one year increments. The RR of 1.74 (95% CI 1.17-2.58) for the group with WHR of 0.9 or higher was increased compared to the group with WHR was lower than 0.9. RR of 1.63 (95% CI 1.09-2.42) for cur- rent smoking group also was increased compared to the non- smoking group, but the difference was not statistically signif- icant. RR of 1.70 (95% CI 1.20-2.41) for normal- ALT group was increased compared to the abnormal-ALT group, and the RR of 1.70 (95% CI 1.19-2.44) for the high LDL cholesterol group was increased compared to the to the LDL cholesterol- normal group, revealing that age, abdominal obesity, smoking, ALT abnormality, and high LDL cholesterol were risk factors that affected the development of IRS, even if other factors were excluded (Table 2).
DISCUSSION
Age, smoking, hypertension, high LDL cholesterol, low HDL cholesterol, high blood sugar, lack of physical activity, and blood coagulation times are known risk factors for cardio- vascular disease (8). The combination of these factors in an in- dividual (1, 2) and the decline of glucose metabolism are rec- ognized as the basis of IRS (9). Specifically, the ACE/AACE stated in 2003 that IRS was a clinical result of insulin resis- tance and its compensatory mechanism.
In this study, the age-adjusted annual incidence was 6.7 per 100 persons, which is considered to be relatively high.
The age group 20-29 showed the lowest incidence of 4.6 per 100 persons/year, while the age group 40-49 showed the highest incidence of 9.0 per 100 persons/year. However, the incidence in the age group 50-59 had decreased to 6.6 per 100 persons/year. The reasons for the decrease in inci- dence for this age group are thought to be as follows: 1) the
number of subjects who were in their 50s was small, and 2) people in their 50s who were found to have IRS at the in- sulin resistance syndrome screening test had demonstrated evidence of IRS earlier in life. The RR for the 40-49 age group compared to the 20-29 age group was 1.95 (95% CI 1.10- 3.46). Thus, the RR in the logistic regression analysis was increased 1.03 times (95% CI 1.00-1.05) with age, with every one-year increase.
The environmental factors involved in the development of IRS include mental stress, lack of exercise, and visceral obe- sity in addition to age as mentioned above (10). WHR, smoking, LDL cholesterol and abnormal ALT showed sig- nificant association with IRS, after adjusting for several rele- vant factors in this study as well as in a previous study (11).
It is well known that obesity is closely associated with IRS, and that the accumulation of visceral fat correlates with the development of IRS. With regard to the correlation between IRS and WHR, which is the index of abdominal obesity, had a more significant correlation than BMI (12). Heo and collea- gues (13) reported that there was a significant correlation be- tween visceral fat area measured by computerized axial tomog- raphy and insulin sensitivity. In this study, the RR for the ab- dominal obesity group in which WHR was 0.9 or higher was 2.13 (95% CI, 1.64-2.77), showing a significant association with IRS development.
It is known that both obesity and lack of physical activity account for about 25% of the cause of insulin resistance (10).
The amount of physical activity is known to be closely related to insulin sensitivity, and maximum oxygen consumption is a factor that determines about 25% of insulin sensitivity in normal adults without type 2 diabetes (14). In this study, there was no significant difference in the incidence of IRS between the regular exercise group (exercised three or more times a week for 30 or more minutes at each time) and the non-regular exer- cise group, but the insulin concentration in blood after one year in the regular exercise was statistically significant lower than that of the non-regular exercise group (regular exercise group: 6.11±4.49 IU/mL, non-regular exercise group: 6.90
±6.77 IU/mL p<0.05). In this study, the RR of insulin resis- tance syndrome for the smoking group was 1.56 (95% CI, 1.11-2.19). After other risk factors were adjusted, the RR was 1.63 (95% CI, 1.09-2.42). Moreover, insulin concentrations in the plasma of the smoking group were statistically signifi- cantly higher than in the non-smoking group in this study (smoking group: 7.03±6.94 IU/mL, non-smoking group:
6.38±6.04 IU/mL, p<0.05).
Godsland and colleagues (15) reported that insulin resistance is caused by the acute effect of smoking in the case of current smokers. The RR for the group in which LDL cholesterol con- centration was higher than 130 mg/dL but lower than 160 mg/
dL and the group in which LDL cholesterol concentration was 160 mg/dL or higher were 1.44 (95% CI, 1.06-1.95) and 4.77 (95% CI, 3.47-6.56), respectively, compared to the group in which LDL cholesterol concentration was 130 mg/dL or lower.
*Adjusted for age, WHR, Smoking status, ALT, LDL cholesterol.
WHR, waist-to-hip ratio; ALT, alanine transferase; LDL, low-density lipoprotein.
Independent variables Relative risk* 95% CI
Age (yr) 1.03 1.00-1.05
WHR (≥0.9/<0.9) 1.74 1.17-2.58
Smoking 1 (smokers/no) 1.63 1.09-2.42
Smoking 2 (ex-smokers/no) 1.13 0.74-1.75
ALT (≥35 IU/L) 1.70 1.20-2.41
LDL cholesterol (≥160 mg/L) 1.70 1.19-2.44 Table 2.Results of multiple logistical regression among initially normal group (n=1,578)
Furthermore, using logistic regression analysis in which other risk factors were adjusted, the RR for the group of which LDL cholesterol concentration was 160 mg/dL or higher was 1.70 (95% CI, 1.19-2.44). It was recently found that small dense LDL cholesterol is a main factor of atherosclerosis (16) and is associated with insulin resistance (17); therefore, it is thought that disorder in lipid metabolism due to insulin resistance plays an important role in the development of atherosclerosis.
Abnormal liver function was significantly associated with development of IRS, after viral hepatitis was excluded (18). In this study, the RR for the abnormal ALT group was 1.87 (95
% CI, 1.45-2.41). Moreover, using logistic regression analy- sis after adjusting other risk factors, the RR for the abnormal ALT group was 1.70 (95% CI, 1.20-2.41). These results sug- gest an association between liver disease and IRS, agreeing with the results of a prerious study (18). Therefore, liver dis- ease was correlated not only with problems of the liver itself but also with IRS, and this aspect points to the reason that non- alcoholic liver disease was selected as one of the components of IRS.
This study had some limitations. First, the workplace-based participants do not represent the general Korean population.
Second, it involved a short-term follow-up period, and there- fore, a causal relationship related to the development of IRS could not be defined.
The annual incidence of IRS in Korean workers is high;
therefore, early diagnosis and early treatment are necessary.
It is necessary to develop methods of prevention and thera- peutic approach to manage the integrated risk factors.
REFERENCES
1. Reaven GM. Banting lecture 1988. Role of insulin resistance in human disease. Diabetes 1988; 37: 1595-607.
2. Liese AD, Mayer-Davis EJ, Tyroler HA, Davis CE, Keil U, Duncan BB, Heiss G. Development of the multiple metabolic syndrome in the ARIC cohort: Joint contribution of insulin, BMI, and WHR. Ann Epidemiol 1997; 7: 407-16.
3. Haffner SM, Howard G, Mayer E, Bergman RN, Savage PJ, Rewers M, Mykkanen L, Karter AJ, Hamman R, Saad MF. Insulin sensitivi- ty and acute insulin response in African-Americans, non-Hispanic whites and Hispanics with NIDDM: the insulin resistance athero- sclerosis study. Diabetes 1997; 46: 63-9.
4. Alberti KG, Zimmet PZ. Definition, diagnosis and classification of diabetes mellitus and its complications. Part 1: diagnosis and clas- sification of diabetes mellitus provisional report of a WHO consul- tation. Diabet Med 1998; 15: 539-53.
5. Expert Panel on Detection, Evaluation, and Treatment of High Blood Cholesterol in Adults. Executive summary of the Third Report of the National Cholesterol Education Program (NCEP) Expert Panel on
detection, evaluation, and treatment of high blood cholesterol in adults (Adult Treatment Panel III). JAMA 2001; 285: 2486-97.
6. Einhorn D, Reaven GM, Cobin RH, Ford E, Ganda OP, Handelsman Y, Hellman R, Jellinger PS, Kendall D, Hrauss RM, Neufeld ND, Petak SM, Rodbard HW, Seibel JA, Smith DA, Wilson PW. Ameri- can college of endocrinology position statement on the insulin resis- tance syndrome. Endocr Prac 2003; 9: 240-52.
7. Ferrannini E, Haffner SM, Mitchell BD, Stern MP. Hyperinsuline- mia: the key feature of a cardiovascular and metabolic syndrome.
Diabetologia 1991; 34: 416-22.
8. Wilson PW, D’Agostino RB, Levy D, Belanger AM, Silbershatz H, Kannel WB. Prediction of coronary heart disease using risk factor categories. Circulation 1998; 97: 1837-47.
9. Grundy SM. Hypertriglyceridemia, insulin resistance, and the me- tabolic syndrome. Am J Cardiol 1999; 83: 25F-9.
10. Bogardus C, Lillioja S, Mott DM, Hollenbeck C, Reaven G. Rela- tionship between degree of obesity and in vivo insulin action in man.
Am J Physiol 1985; 248: E286-91.
11. Tuomilehto J, Lindstrom J, Eriksson JG, Valle TT, Hamalainen H.
Ilanne-Prikka P, Keinanen-Kiukaanniemi S, Laakso M, Louheranta A, Rastas M, Salminen V, Uusitupa M: for the Finnish diabetes pre- vention study group. Prevention of type 2 diabetes mellitus by chan- ges in lifestyle among subjects with impaired glucose tolerance. N Engl J Med 2001; 344: 1343-50.
12. Lee HC, Huh KB, Park SW, Lee JH. Insulin resistance syndrome in Koreans. J Korean Soc Endocirnol 1999; 14: 1-13.
13. Huh KB, Kim YL, An GJ, Jeong YS, Lee EJ, Im SG, Kim GL, Lee HC, Baeg IG, Choe MS, Lee JH. The correlation between insulin resistance and the pattern of body fat distribution in Korean patients with non-insulin dependent diabetes mellitus. Korean J Intern Med 1993; 44: 1-18.
14. Rosenthal M, Haskell WL, Solomon R, Widstrom A, Reaven GM.
Demonstration of a relationship between level of physical training and insulin-stimulated glucose utilization in normal humans. Dia- betes 1993; 32: 408-11.
15. Godsland IF, Leyva F, Walton C, Worthington M, Stevenson JC.
Associations of smoking, alcohol and physical activity with risk fac- tors for coronary heart disease and diabetes in the first follow-up cohort of the Heart Disease and Diabetes Risk Indicators in a Screen- ed Cohort study (HDDRISC-1). J Intern Med 1998; 244: 33-41.
16. Austin MA, King MC, Vranizan KM, Krauss RM. Atherogenic lipoprotein phenotype: a proposed genetic marker for coronary heart disease risk. Circulation 1990; 82: 495-506.
17. Reaven GM, Chen YD, Jeppesen J, Maheux P, Krauss RM. Insulin resistance and hyperinsulinemia in individuals with small, dense low density lipoprotein particles. J Clin Invest 1993; 92: 141-6.
18. Vozarova B, Stefan N, Lindsay RS, Saremi A, Pratley RE, Bogar- dus C, Tataranni PA. High alanine aminotransferase is associated with decreased hepatic insulin sensitivity and predicts the develop- ment of type 2 diabetes. Diabetes 2002; 51:1889-95.