Quantitative Determination of Plasmodium Parasitemia by Flow Cytometry and Microscopy
The traditional light microscopy has limitations for precise growth assays of malaria parasites in culture or for assessment of new compounds for antimalarial activity; the speed and high reproducibility of flow cytometry can overcome these limitations. A flow cytometric method using PicoGreen, a DNA-binding fluorochrome, was developed with optimal precision suitable for performing growth assays of low-parasitemia field isolates.
In addition, intra- and inter-person reproducibility of the flow cytometric and the microscopic method were compared in order to quantitatively demonstrate the improved precision. RNase treatment contributed to the precision of the flow cytometric
measurements by enhancing the signal-to-noise ratios. Coefficients of variation of the method were smaller than 10% for 0.1% or higher parasitemia samples. The intra- and inter-person coefficients of variation of the flow cytometric method were three to six times smaller than those of the microscopic method. The flow cytometric method developed in this study yielded substantially more precise results than the microscopic method, allowing determination of parasitemia levels of 0.1% or higher, with coefficients of variation smaller than 10%. Thus, the PicoGreen method could be a reliable high sensitivity assay for analysis of low parasitemia samples and might be applied to a high throughput system testing antimalarial drug activity.
Key Words: Malaria; Flow Cytometry; Microscopy; Parasitemia; PicoGreen Gyo Jun1, Jeong-Sam Lee2,
Yun-Jae Jung2, and Jae-Won Park2 Departments of 1Biochemistry and 2Microbiology, Graduate School of Medicine, Gachon University, Incheon, Korea
Received: 26 December 2011 Accepted: 5 July 2012 Address for Correspondence:
Yun–Jae Jung, MD
Department of Microbiology, Graduate School of Medicine, Gachon University, 191 Hambakmoe-ro, Yeonsu-gu, Incheon 406-799, Korea
Tel: +82.32-820-4753, Fax: +82.32-820-4744 E-mail: hpmicca@gmail.com
This research was supported by the Basic Science Research Program through the National Research Foundation of Korea (NRF) funded by the Ministry of Education, Science and Technology (Grant No. 2009-0068948).
http://dx.doi.org/10.3346/jkms.2012.27.10.1137 • J Korean Med Sci 2012; 27: 1137-1142 Infectious Diseases, Microbiology & Parasitology
INTRODUCTION
Light microscopy has been the primary tool for malaria diagno- sis and research. Although this method has many strengths, it also suffers some drawbacks, including labor-intensiveness, sub- jectivity, and relatively low reproducibility. Alternative methods have been developed to overcome the limitations of microsco- py. The isotopic assay was designed to measure growth of ma- laria parasites in culture by monitoring incorporation of 3H-hy- poxanthine into DNA (1). Flow cytometry also has been used in malaria research. Since the flow cytometric method was first used to detect Plasmodium parasites (2), several research groups developed and optimized flow cytometric measurements of par- asitemia for various purposes using a variety of fluorochromes (3-8).
One hundred thousand cells can be analyzed in a minute or less with an ordinary flow cytometer (FACS). The remarkable speed of FACS has offered opportunities for developing high- throughput methods for antimalarial drug discovery (4), assess- ment of the effects of leukocytes on parasite growth (6), or de- termination of growth inhibitory antibodies (5). For these high- throughput methods, an automated 96-well plate sampler is used to save time associated with manual sample changes. One
group maximized the speed of the high-throughput screen by directly measuring fluorescence intensities with a 384-well plate reader and screened more than 79,000 small molecules for an- timalarial activity (9).
Another important strength of FACS is high reproducibility, which can make feasible growth assay of low-parasitemia field isolates. The average parasitemia of P. vivax malaria patients was reported to be lower than that of P. falciparum patients. Among P. vivax malaria patients, those in temperate regions showed lower parasitemia than those in tropical regions (10, 11). The average parasitemia of P. vivax malaria patients in a temperate region was 8,396/μL (0.17% assuming 5 × 10⁶ red blood cells/
μL), and a quarter of the patients had parasitemia levels lower than 0.02% (11). Thus, for example, even if a field isolate of 0.2%
parasitemia showed a 50% increase in parasitemia in 48 hr, no conclusions can be drawn until information about the precision of the parasitemia measurements is provided. If the standard deviation of the measurements was the same as the parasitemia increment, the probability that the field isolate was truly grow- ing would be 68% (if the measurement errors are assumed to follow a standard normal distribution). Therefore, if a measure- ment method of higher reproducibility is developed, a conclu- sion can be drawn with a higher probability.
In this study, we established a protocol to maximize the pre- cision of parasitemia measurements by FACS using PicoGreen, a double-strand DNA-binding fluorescent dye. In addition, we compared the intra- and inter-person coefficients of variation for the flow cytometric and microscopic methods to determine how much the precision of parasitemia measurements was im- proved.
MATERIALS AND METHODS
In vitro culture of Plasmodium falciparum
The blood stage parasites were cultured as described previously (12). Briefly, P. falciparum (ATCC No. 30932) was cultured in RPMI medium with 10% human AB+ serum in a 6-well plate under gas conditions of 5% CO2 and 3% O2. Uninfected blood cells and human AB+ serum used in this study were obtained after written informed consent was obtained.
Measurement of parasitemia by FACS
To 10 μL of infected or uninfected control blood cells in an Ep- pendorf tube, 290 μL of PBS were added. After brief mixing, 1 mL of 0.025% glutaraldehyde in PBS was added, and the tube was stored at 4oC for 30 min to fix the cells. The cells were spun down at 450 × g for 5 min, and the cell pellet was resuspended in 0.5 mL of 0.25% Triton X-100 in Tris-EDTA (TE) buffer to perforate the cells. In 5 min, the cells were spun down and resuspended in 810 μL of TE buffer. To the tube, 90 μL of RNase solution (1 mg/mL in TE buffer) were added and incubated in a 37oC water bath for 30 min. Next, 100 μL of PicoGreen solution (1/1,000 di- lution of the stock solution, Invitrogen, Carlsbad, CA, USA) were added to obtain a final concentration of 1/10,000 dilution of the supplied stock. For each sample, 100,000 cells were analyzed with FACSCalibur (BD, San Jose, CA, USA), using the software CellQuestPro. After selecting intact blood cells with a rectangu- lar gate on a forward scatter/side scatter plot, a parasitemia val- ue was obtained from a histogram of the number of cells vs flu- orescence intensities. For samples with a parasitemia higher than 0.5%, a peak for the parasitized cells was clearly displayed and well separated from the peak of uninfected cells. The lower boundary of the gate was set at the base of the peak for the par- asitized cells, and the upper boundary was set at the position with a fluorescence intensity 16 times that of the peak to include schizonts with 16 nuclei.
Measurement of parasitemia by nested PCR
P. falciparum species-specific nested PCR was performed ac- cording to the method of Snounou and others (13). The blood cells cultured with P. falciparum were diluted in 10 volumes of PBS with 0.05% saponin. The parasites were released from eryth- rocytes at room temperature for 15 min and collected by cen- trifugation (6,000 × g for 5 min). The supernatant was discarded;
the parasite pellet was resuspended in 60 μL of PCR buffer with- out MgCl2; and the mixture was incubated at 95°C for 10 min.
The first round of nested PCR amplification was then performed with a 5 μL aliquot of supernatant from this mixture solution.
For the first round of PCR amplification, two Plasmodium ge- nus-specific primers, rPLU6 (5´-TTA AAA TTG TTG CAG TTA AAA CG-3´) and rPLU6 (5´-CCT GTT GTT GCC TTA AAC TTC- 3´) were used for amplification of small subunit ribosomal RNA genes. The second round of amplification was performed with a 1 μL aliquot of product from the first round of PCR, using spe- cies-specific primers of rFAL1 (5´-TTA AAC TGG TTT GGG AAA ACC AAA TAT ATT-3´) and rFAL2 (5´-ACA CAA TGA ACT CAA TCA TGA CTA CCC GTC-3´) to produce a P. falcipraum-specific 205 bp fragment of ssrRNA genes. The PCR products were ana- lyzed on 1.5% TAE-agarose gels.
Measurement of parasitemia by microscopy
To prepare thin films of the samples, cells (18 μL) were spun down, the supernatant was removed, and the cells were resus- pended in 9 μL of PBS. Of the resuspended cells, 4 μL were smeared on a glass slide and stained with Giemsa, and 5,000 red blood cells were counted per slide.
Ethics statement
The study protocol was approved by the institutional review board of Gil Medical Center, Gachon University (IRB No. GIR- BA1675). Informed consent was waived by the board.
RESULTS
RNase treatment reduces the background noise
The parasitemias of RNase-treated samples were lower than those of the untreated ones by 0.27%, 0.06%, 0.04%, and 0.10%
for samples with 4.44%, 1.0%, and 0.5% parasitemia and the un- infected control, respectively (Fig. 1). This result indicates that the higher parasitemias of the untreated samples are partially due to the background noise, which can be eliminated by RNase treatment. Moreover, when treated with RNase, the peaks for the parasitized cells became sharper, even revealing a small peak for two-nuclei schizonts in the 4.44% parasitemia sample.
As evident from the cytograms of forward scatter vs fluorescence (Fig. 1), most cells in the region with fluorescence intensities between 10 and 100 (arbitrary units) were eliminated by RNase treatment.
Optimal PicoGreen concentration
Invitrogen, the supplier of PicoGreen, suggested diluting the stock PicoGreen solution 2,000-fold for nucleic acid samples in solution for spectrofluorometry. Because they had not suggest- ed any guidelines for flow cytometry, we started with a Pico- Green concentration of 1/2,000 dilution. When the dye solution
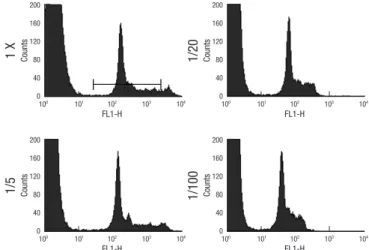
was further diluted five-fold, the position of the peak for para- sitized cells shifted slightly towards the weaker fluorescence side, whereas the peak for the uninfected cells moved substan- tially to the left, widening the gap between the two cell popula- tions (Fig. 2). In addition, at this dilution, the fine structure of the parasitized peak became superior. For these reasons, we chose a dilution factor of 10,000-fold for the remaining experi- ments, which is a five-fold dilution of the manufacturer’s sug- gestion.
When the dye solution was further diluted to 20-fold and 100-
fold of the suggested concentration, the fluorescence intensities of the parasitized peaks shifted down to 60 and 40, respectively, narrowing the gap between the two cell populations.
Precision of parasitemia determination by FACS
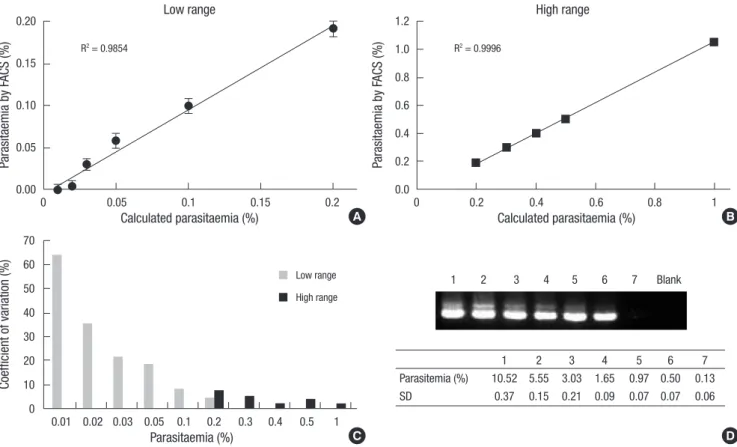
Samples of the low range parasitemias yielded relatively poor correlation (r2= 0.9854) between the measured parasitemias by FACS and the expected parasitemias when compared to the high range samples (r2= 0.9996) (Fig. 3A, B). Because the stan- dard deviations of the low range samples were considerably uni- form (ranging from 0.0064% to 0.0093%) and smaller than those of the high range samples (ranging from 0.0071% to 0.0239%), the low correlation might be ascribed to inaccuracy of serial di- lution. The smaller standard deviations of the low range sam- ples were somewhat expected because they were obtained from 10 repeated measurements, whereas the high range samples were measured five times.
The coefficients of variation (CV) for the low range samples gradually increased as the parasitemias decreased, reaching as high as 64% for the 0.01% parasitemia sample (Fig. 3C). The CVs for the 0.2% parasitemia sample were 4.6% and 7.4% when the parasitemia was measured 10 times or five times, respectively.
The CVs for samples with 0.3% or higher parasitemias were 5%
or less.
An infection showing parasitemia around 10%, measured by microscopic observation, was diluted by 1/2 serial dilution for use in the nested PCR. All dilutions produced a band on the agarose gel, although a bright band was seen when the diluted sample reached to 0.5%, and a band for 0.13% parasitemia was weak to detect (Fig. 3D).
Intra- and inter-person reproducibility of flow cytometry and microscopy
Intra-person CVs of flow cytometry for 0.1%, 0.5%, and 1% par- asitemia samples were 11.0%, 4.8%, and 3.0%, respectively (Fig.
Counts Counts
Counts Counts
Counts Counts
Counts Counts
FSC-H FSC-H
FL1-H FL1-H
FL1-H FL1-H
FL1-H FL1-H
FL1-H FL1-H
FL1-H FL1-H
R2
No RNase + RNase
4.44%1.0%0.5%ControlControl
100 101 102 103 104 100 101 102 103 104
100 101 102 103 104 100 101 102 103 104
100 101 102 103 104 100 101 102 103 104
100 101 102 103 104 100 101 102 103 104
100 101 102 103 104 100 101 102 103 104
200 160 120 80 40 0
200 160 120 80 40 0
200 160 120 80 40 0
200 160 120 80 40 0
200 160 120 80 40 0
200 160 120 80 40 0
200 160 120 80 40 0
200 160 120 80 40 0
1,000 800 600 400 200 0
1,000 800 600 400 200 0
Fig. 1. Effect of RNase treatment. A 4.44% parasitemia sample (measured by mi- croscopy) was diluted to prepare 1% and 0.5% parasitemia samples. Each of these three samples and an uninfected control sample were divided into two portions, and the two sets were incubated in a 37oC water bath for 30 min: the first set without RNase and the second with RNase.
Counts Counts
Counts Counts
FL1-H FL1-H
FL1-H FL1-H
R2
1 X 1/20
1/5 1/100
100 101 102 103 104 100 101 102 103 104
100 101 102 103 104 100 101 102 103 104
200 160 120 80 40 0
200 160 120 80 40 0
200 160 120 80 40 0
200 160 120 80 40 0
Fig. 2. Effect of PicoGreen concentration (1 × is the concentration suggested by the manufacturer).
4A), while inter-person CVs were 6.6%, 3.6%, and 1.2% for the same samples (Fig. 4B). These results seem fairly acceptable. As anticipated, however, both intra- and inter-person CVs of mi- croscopy were three to six times larger than those of flow cytom- etry (Fig. 4). In particular, the microscopic method yielded an intra-person CV of 63% for the 0.1% parasitemia sample (Fig. 4A).
DISCUSSION
The success of parasitemia measurement by FACS using a DNA- binding fluorochrome largely depends on discrimination be- tween parasitized cells and other nucleic acid-containing cells in the sample. Because DNA-binding dyes have some affinity for RNA, cellular RNA contents also should be taken into ac- Fig. 3. Precision of parasitemia determination by flow cytometry. An in vitro culture of P. falciparum was diluted to prepare samples of the desired parasitemia levels. (A) Each of the low range samples was measured 10 times. After deleting the largest and smallest values, the average and standard deviation were calculated for the remaining eight samples. (B) The data for each of the high range samples were obtained from five repeated measurements without deletion. (C) The coefficient of variation for each parasitemia was calculated by dividing the standard deviation by the true parasitemia, assuming perfectly accurate serial dilution. (D) 1.5% agarose gel showing PCR product obtained by nested multiplex PCR for 205 bp segment. DNA was extracted from the P. falciparum infected red blood cells. The % values of parasitemia, denoted in the table, were calculat- ed by microscopic observation, and SD in the table means standard deviation.
Parasitaemia by FACS (%)Coefficient of variation (%) Parasitaemia by FACS (%)
Calculated parasitaemia (%)
Parasitaemia (%)
1 2 3 4 5 6 7 Blank
1 2 3 4 5 6 7
Parasitemia (%) 10.52 5.55 3.03 1.65 0.97 0.50 0.13 SD 0.37 0.15 0.21 0.09 0.07 0.07 0.06
Calculated parasitaemia (%)
Low range High range
R2 = 0.9854
Low range High range
R2 = 0.9996
0 0.05 0.1 0.15 0.2
0.01 0.02 0.03 0.05 0.1 0.2 0.3 0.4 0.5 1
0 0.2 0.4 0.6 0.8 1
0.20
0.15
0.10
0.05
0.00
70 60 50 40 30 20 10 0
1.2 1.0 0.8 0.6 0.4 0.2 0.0 A
C D
B
Fig. 4. Reproducibility of parasitemia determination by flow cytometry and microscopy. Each of three examiners measured each sample five times. Each of the intra-person CVs is the average of three intra-person CVs obtained by the three examiners. The above experiment was repeated twice, and the graphs represent the average of the two experiments.
Coefficient of variation (%) Coefficient of variation (%)
Parasitaemia Parasitaemia
Intra-person reproducibility Inter-person reproducibility
FACS FACS
Microscopy Microscopy
0.1% 0.5% 1% 0.1% 0.5% 1%
70 60 50 40 30 20 10 0
40
30
20
10
0
A B
count. Nucleic acids in a sample prepared from a continuous in vitro culture may include 1) chromosomal DNA in the nucle- us of a leukocyte, 2) RNA in a reticulocyte, and 3) mitochondrial DNA in a reticulocyte. The DNA contents of a human cell, P. fal- ciparum, and P. vivax are 3 Gb, 23.3 Mb, and 26.8 Mb, respec- tively (14). Since the human genome is 129 and 112 times larger than those of P. falciparum and P. vivax, respectively, leuko- cytes would exhibit fluorescence intensities far too strong to in- terfere with the parasitemia measurements. However, reticulo- cytes have varying amounts of RNA depending on the degree of maturation. And, PicoGreen is described as having an approxi- mately 1/100 affinity for RNA compared to double-strand DNA.
Therefore, if the amount of RNA in a reticulocyte is 100 times of a plasmodial genome, the reticulocyte would be counted by FACS as one of the parasitized cells. The reduced background noise obtained by RNase treatment might have been achieved by clearing the reticulocyte RNA. Human mitochondrial DNA is 16.5 Kb in length, 1/1,600 the size of the P. vivax genome. Thus, if a reticulocyte has 1,600 mitochondria in it, it also might cause a problem. Even though a human liver cell is known to have up to 2,000 mitochondria, it is uncertain if a reticulocyte also has that many mitochondria because an electron micrograph shows much fewer mitochondria than that (15). It remains unclear what causes the residual background noise level of approximate- ly 0.05% after RNase treatment.
Among a variety of DNA-binding fluorochromes that are ex- citable by a 488 nm blue laser, PicoGreen was chosen for this study based on two previous studies (3, 16). One reported that YOYO-1 was superior to propidium iodide or acridine orange, showing better separated peaks for parasitized cells and unin- fected cells on histograms (3). The other report demonstrated that PicoGreen had more consistent fluorescence intensities and lower CVs over a wide range of dye concentrations than YOYO-1 and YO-PRO-1 (16). However, for all the strong points of PicoGreen, it is impermeable to lipid bilayers, requiring the additional sample preparation steps of cell fixation and perfo- ration. Because our primary concern was to maximize the pre- cision of the measurements in order to handle low-parasitemia field isolates, we traded speed for precision.
With the optimized protocol, our flow cytometric method yielded CVs less than 10% for samples with 0.1% or higher para- sitemias. However, the CVs for samples with 0.05% or lower par- asitemias were unacceptably high, reaching over 60% for the 0.01% parasitemia sample. Since these CVs were calculated based on 10 repeated measurements, and parasitemia measure- ments are not repeated this many times for ordinary experi- ments, the CVs reported here would be lower limits. Thus, 0.1%
parasitemia is the limit that the current method can measure with reasonable precision under ordinary experimental designs.
Based on our nested PCR method, parasites were detected in all the diluted samples in which the expected lowest parasitemia
was 0.13%. However, the bright band signal was seen when the samples was diluted to 0.5%. Assuming that 0.1% parasitemia is the limit of the PicoGreen method, it can be suggested that the sensitivity of PicoGreen method in the measure of the Plasmo- dium parasitemia seems to correspond with that of the PCR analysis.
The thin film method of microscopy resulted in intra- and inter-person CVs less than 20% for 0.5% or higher parasitemia samples, although these values were much larger than those of the flow cytometric method. However, the CVs for the 0.1% par- asitemia sample were too high. Under ordinary circumstances, the number of erythrocytes counted per slide is much less than the 5,000 of this study. Thus, due care should be practiced when interpreting microscopically-determined parasitemias lower than 0.5%.
Microscopic examination of stained blood films is the stan- dard malaria diagnosis method. However, the low sensitivity of this method is the major problem in the diagnosis of malaria showing low parasitemia, such as P. vivax infection (17). We have measured the percent values of parasitemia by both of flow cy- tometry and microscopy methods from blood samples of three P. vivax infected patients. The measured values were 0.09% ± 0.02%, 0.12% ± 0.04%, and 1.14% ± 0.01% by flow cytometry, and 0.01%, 0.04%, and 0.55% by microscopic observation, re- spectively. Therefore, flow cytometric examinations showed relatively higher parasitemia level of vivax malaria samples com- pared to microscopic observation, although statistical analysis was unavailable due to the limited number of experiments. The standard deviations of the flow cytometry-measured parasit- emia were fairly uniform in part (from 0.01 to 0.04). In this re- gard, flow cytometric method might be a choice in the diagno- sis of Plasmodium infection with low parasite levels. Although the primary goal of the parasitemia determination method de- veloped in this study was to enhance the reproducibility of low- parasitemia samples as much as possible, the speed was still much faster than the microscopy due to the intrinsic nature of FACS. One person was able to measure parasitemias of 200 sam- ples in 6 hr, including the fixation, perforation, and RNase treat- ment steps.
Collectively, the PicoGreen method appears better than the microscopy for assessing low parasitemia isolates, on the basis of its superior sensitivity and consistency. Although the micros- copy is a proven method for diagnosis of Plasmodium infected isolates, its usefulness is limited by access to skilled microsco- pists and its time consuming methodology. The PicoGreen method described here could be a reliable high sensitivity assay for analysis of low parasitemia samples. In addition, the rela- tively high speed of PicoGreen assay might enable it as a high throughput system which can be applied to antimalarial drug discovery programs.
ACKNOWLEDGMENTS
We thank Ji-Eun Jung, Bomi Kim, Misoon Kim, and Ji-Ae Yoo for technical assisstance.
REFERENCES
1. Desjardins RE, Canfield CJ, Haynes JD, Chulay JD. Quantitative assess- ment of antimalarial activity in vitro by a semiautomated microdilution technique. Antimicrob Agents Chemother 1979; 16: 710-8.
2. Brown GV, Battye FL, Howard RJ. Separation of stages of Plasmodium falciparum-infected cells by means of a fluorescence-activated cell sorter.
Am J Trop Med Hyg 1980; 29: 1147-9.
3. Barkan D, Ginsburg H, Golenser J. Optimisation of flow cytometric mea- surement of parasitaemia in plasmodium-infected mice. Int J Parasitol 2000; 30: 649-53.
4. Chevalley S, Coste A, Lopez A, Pipy B, Valentin A. Flow cytometry for the evaluation of anti-plasmodial activity of drugs on Plasmodium fal- ciparum gametocytes. Malar J 2010; 9: 49.
5. Persson KE, Lee CT, Marsh K, Beeson JG. Development and optimiza- tion of high-throughput methods to measure Plasmodium falciparum- specific growth inhibitory antibodies. J Clin Microbiol 2006; 44: 1665-73.
6. van der Heyde HC, Elloso MM, vande Waa J, Schell K, Weidanz WP. Use of hydroethidine and flow cytometry to assess the effects of leukocytes on the malarial parasite Plasmodium falciparum. Clin Diagn Lab Immu- nol 1995; 2: 417-25.
7. Whaun JM, Rittershaus C, Ip SH. Rapid identification and detection of parasitized human red cells by automated flow cytometry. Cytometry 1983; 4: 117-22.
8. Wilson DW, Crabb BS, Beeson JG. Development of fluorescent Plasmo- dium falciparum for in vitro growth inhibition assays. Malar J 2010; 9:
152.
9. Baniecki ML, Wirth DF, Clardy J. High-throughput Plasmodium falci- parum growth assay for malaria drug discovery. Antimicrob Agents Chemother 2007; 51: 716-23.
10. Collins WE, Sullivan JS, Jeffery GM, Williams A, Galland GG, Nace D, Williams T, Barnwell JW. The Chesson strain of plasmodium vivax in humans and different species of Aotus monkeys. Am J Trop Med Hyg 2009; 80: 152-9.
11. Huh AJ, Kwak YG, Kim ES, Lee KS, Yeom JS, Cho YK, Kim CS, Park JW.
Parasitemia characteristics of Plasmodium vivax malaria patients in the Republic of Korea. J Korean Med Sci 2011; 26: 42-6.
12. Ahn SY, Shin MY, Kim YA, Yoo JA, Kwak DH, Jung YJ, Jun G, Ryu SH, Yeom JS, Ahn JY, et al. Magnetic separation: a highly effective method for synchronization of cultured erythrocytic Plasmodium falciparum.
Parasitol Res 2008; 102: 1195-200.
13. Snounou G, Viriyakosol S, Zhu XP, Jarra W, Pinheiro L, do Rosario VE, Thaithong S, Brown KN. High sensitivity of detection of human malaria parasites by the use of nested polymerase chain reaction. Mol Biochem Parasitol 1993; 61: 315-20.
14. Carlton JM, Adams JH, Silva JC, Bidwell SL, Lorenzi H, Caler E, Crab- tree J, Angiuoli SV, Merino EF, Amedeo P, et al. Comparative genomics of the neglected human malaria parasite Plasmodium vivax. Nature 2008; 455: 757-63.
15. Gronowicz G, Swift H, Steck TL. Maturation of the reticulocyte in vitro. J Cell Sci 1984; 71: 177-97.
16. Marie D, Vaulot D, Partensky F. Application of the novel nucleic acid dyes YOYO-1, YO-PRO-1, and PicoGreen for flow cytometric analysis of marine prokaryotes. Appl Environ Microbiol 1996; 62: 1649-55.
17. Bharti AR, Patra KP, Chuquiyauri R, Kosek M, Gilman RH, Llanos- Cuentas A, Vinetz JM. Polymerase chain reaction detection of Plasmodi- um vivax and Plasmodium falciparum DNA from stored serum sam- ples: implications for retrospective diagnosis of malaria. Am J Trop Med Hyg 2007; 77: 444-6.