cance has not been completely established [2]. Serum IgD concen- tration can be increased in some clinical situations, such as IgD monoclonal gammopathy, hyper-IgD syndrome, and autoimmune disease [3, 4]. IgD multiple myeloma accounts for approximately 2% of multiple myeloma cases. Although IgD multiple myeloma is rare, early diagnosis is important because of its association with young age and advanced stage at the time of diagnosis [5]. Partic- ularly, IgD monoclonal peak is small or undetectable on electro- phoresis, which emphasizes the importance of IgD quantification for diagnosis and disease monitoring [6].
Serum IgD concentration shows a wide variation between nor- mal individuals [7, 8]. Previous studies have reported that several factors, such as age, sex, and smoking habit, can affect IgD con- centration [9-11], although these findings are controversial [12, 13].
Herein, we evaluated the analytical performance of the SPAPLUS (The Binding Site, Birmingham, UK) for IgD quantification and es- tablished a reference interval for IgD in the Korean population.
INTRODUCTION
IgD, one of the immunoglobulin isotypes, was first discovered in patients with multiple myeloma in 1965 [1]. IgD accounts for
<1% of the total serum immunoglobulin, and its clinical signifi-
SPAPLUS 분석기의 혈청 IgD 정량검사 성능평가 및 한국인에서 IgD의 참고구간 설정
Performance Evaluation of Serum IgD Quantification by the SPAPLUS Turbidimetric Analyzer and Determination of a Reference Interval of IgD in the Korean Population
조은혜1·박현경2·박형두1
Eun Hye Cho, M.D.1, Hyun-Kyung Park, M.D.2, Hyung-Doo Park, M.D.1
성균관대학교 의과대학 삼성서울병원 진단검사의학과1, 서울의과학연구소2
Department of Laboratory Medicine and Genetics1, Samsung Medical Center, Sungkyunkwan University School of Medicine; Seoul Clinical Laboratories2, Seoul, Korea
Vol. 10, No. 3: 197-201, July 2020
https://doi.org/10.3343/lmo.2020.10.3.197 임상화학
Corresponding author: Hyung-Doo Park, M.D., Ph.D.
https://orcid.org/0000-0003-1798-773X
Department of Laboratory Medicine and Genetics, Samsung Medical Center, Sungkyunkwan University School of Medicine, 81 Irwon-ro, Gangnam-gu, Seoul 06351, Korea
Tel: +82-2-3410-0290, Fax: +82-2-3410-2719, E-mail: [email protected] Received: March 19, 2019
Revision received: October 8, 2019 Accepted: October 10, 2019
This article is available from https://www.labmedonline.org 2020, Laboratory Medicine Online
This is an Open Access article distributed under the terms of the Creative Commons Attribution Non-Commercial License (https://creativecommons.org/licenses/by-nc/4.0/) which permits unrestricted non-commercial use, distribution, and reproduction in any medium, provided the original work is properly cited.
Background: IgD is an immunoglobulin isotype that accounts for <1% of the total serum immunoglobulin, and IgD level changes can be ob- served in specific clinical situations. Herein, we evaluated the analytical performances of serum IgD quantification by the SPAPLUS turbidimetric analyzer (The Binding Site, UK), and determined a reference interval of IgD in the Korean population.
Methods: Precision, linearity and comparison with BNII (Siemens Healthineers, Germany) were assessed, and a reference interval was estab- lished according to the Clinical and Laboratory Standards Institute guidelines.
Results: Repeatability ranged from 0.78% to 2.14%, and the within-laboratory precision ranged from 4.10% to 5.40% for three concentrations.
The coefficient of determination (R2) was 0.9996 for the analytical measurement range. The IgD concentration showed a correlation between SPAPLUS and BNII (y=0.890x-1.852, r=0.984). However, IgD concentrations tended to be lower in SPAPLUS compared to those in BNII at con- centrations >100 mg/L. The established upper limit of the reference interval was 53.6 mg/L.
Conclusions: The SPAPLUS shows good analytical performance for serum IgD quantification.
Key Words: Analytical performance, IgD, Monoclonal gammopathy, Reference interval, Turbidimetry
2017-03-16 https://crossmark-cdn.crossref.org/widget/v2.0/logos/CROSSMARK_Color_square.svg
MATERIALS AND METHODS
1. Reagents and instruments
The SPAPLUS was used according to the manufacturer’s instruc- tions, using the SPAPLUS IgD Kit (product code: LK013.S, The Bind- ing Site). The BNII system (Siemens Healthineers, Erlangen, Ger- many) was used according to the manufacturer’s instructions using IgD Latex Kit for use on the Siemens BNII (product code: LK013.T, The Binding Site).
At the standard 1/10 dilution, the measuring range is 7–210 mg/L.
If the result was lower than the lower limit of the measuring range, the test was performed without dilution. If the result was higher than the upper limit of the measuring range, further dilution was performed to widen the measuring range to 16,800 mg/L. There- fore, the clinical reportable range is 0.7–16,800 mg/L.
2. Precision
Two control materials and one pooled serum were used for precision assessment. The estimated concentrations of control materials provided by the manufacturer were 23.1 mg/L and 97.7 mg/L. They were measured in duplicate per run, and two runs per day for 20 days. Repeatability and within-laboratory precision were evaluated according to the Clinical and Laboratory Standards Institute (CLSI) EP05-A3 guideline [14].
3. Linearity
Linearity was assessed according to the CLSI EP06-A guideline [15] using the SPAPLUS calibrator, which consist of pooled human serum. The highest and lowest calibrators (0.6 mg/L and 20.8 mg/L, respectively) were mixed at ratios of 5:0, 4:1, 3:2, 2:3, 1:4, and 0:5.
Each of the six concentrations was measured in duplicate. From these results, regression analysis was performed for the first-, sec- ond-, and third-order polynomials, and the coefficient of determi- nation (R2) was calculated.
4. Comparison
Comparison with the BNII system was performed according to the CLSI EP09-A3 guideline [16]. A total of 36 leftover patient sam- ples evenly distributed at the analytical measurement range were included: 20 were within the reference interval claimed by the manufacturer, and 16 were outside the reference interval claimed by the manufacturer. The Wilcoxon signed-rank test, Passing-Bablok regression analysis, and Bland-Altman analysis were performed using MedCalc for Windows version 15.0 (MedCalc Software, Os- tend, Belgium).
5. Reference interval
The reference interval was established according to the CLSI EP28-A3C guideline [17] using MedCalc for Windows version 15.0 (MedCalc Software). A total of 120 samples from healthy individu- als were included. The reference interval claimed by the manu- facturer is 7.7–132.1 mg/L.
RESULTS
1. Precision
The results of the precision evaluation are summarized in Table 1. Repeatability ranged from 0.777% to 2.135% coefficient of vari- ation (CV), and within-laboratory precisions ranged from 4.100%
to 5.402% CV in three concentrations. Only within-laboratory pre-
Table 1. Precision of the SPAPLUS in serum IgD quantification Materials Mean
(mg/L) SD CV (%)
Repeatability Within-laboratory
Low level QC 23.7 0.939 1.089 4.100
High level QC 101 4.224 0.777 4.289
Pooled serum 15.9 0.812 2.135 5.402
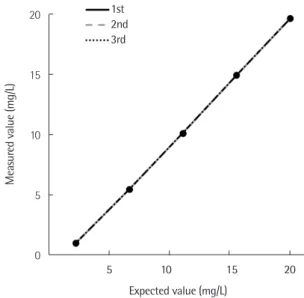
Fig. 1. Linearity of the SPAPLUS in serum IgD quantification. Linearity was observed within the tested concentration range (0.6–20.8 mg/L) with a coefficient of determination (R2) of 0.9996.
20
15
10
5
0
Measured value (mg/L)
Expected value (mg/L)
5 10 15 20 1st
2nd 3rd
cision of pooled serum exceeded 5% CV.
2. Linearity
In the regression analysis, the first-order equation was the best- fitting line. Linearity was observed within the tested concentra- tion range (0.6–20.8 mg/L) with a coefficient of determination (R2) of 0.9996 (Fig. 1).
3. Comparison
The IgD concentration showed a significant difference between the SPAPLUS and BNII (P<0.0001) (Fig. 2). The difference was not evident at concentrations <100 mg/L. In contrast, IgD con- centrations tended to be lower in SPAPLUS than BNII at concen- trations >100 mg/L. The correlation coefficient (r) between SPA- PLUS and BNII was 0.984. The slope and intercept of the regres- sion line were 0.890 (95% confidence interval, 0.790 to 0.966) and -1.852 (95% confidence interval, -3.167 to -0.647), respectively (Fig. 3).
4. Reference interval
The characteristics of the 120 healthy individuals are summa- rized in Table 2. The histogram of IgD concentration from 120 samples showed a nonparametric distribution (Fig. 4). Among the 120 samples, 65 were out of the reference interval claimed by the manufacturer; 64 were lower than the lower limit of the reference
Table 2. Characteristics of the 120 healthy individuals
Characterization Value
Mean age (range), yr 52 (20–78)
Sex, N (%)
Male 47 (47.5)
Female 63 (52.5)
Smoking history, N (%)
Current smoker 17 (14.2)
Ex-smoker 19 (15.8)
Never smoker 52 (43.3)
Not evaluated 32 (26.7)
Fig. 2. Bland-Altman plots of serum IgD concentrations for compari- son of the SPAPLUS and BNII. The IgD concentration showed a signif- icant difference between the SPAPLUS and BNII (P<0.0001). The solid line is the mean difference, the dashed line is the limit of agreement, and the dotted line is the zero difference.
40
20
0
-20
-40
-60
-80
SPAPLUS (mg/L)-BNII (mg/L)
AVERAGE of SPAPLUS (mg/L) and BNII (mg/L)
0 50 100 150 200 250
+1.96 SD 25.2
Mean -12.8
-1.96 SD -50.7
Fig. 4. Histogram of IgD concentration from 120 healthy individuals.
100 90 80 70 60 50 40 30 20 10 0
Frequency (%)
IgD (mg/L)
20 40 60 80 100 120 140 160 180 200 Fig. 3. Scatter diagram and Passing-Bablok regression line of serum
IgD concentration for comparison of the SPAPLUS and BNII. The solid line is the regression line, the dotted line is the confidence interval, and the gray line is the identity line.
300
250
200
150
100
50
0
SPAPLUS (mg/L)
BNII (mg/L)
0 50 100 150 200 250 300
y=0.890x-1.852 r=0.984
interval, and one was higher than the upper limit of the reference interval. Because the IgD distribution was skewed to the left and high concentrations are important for clinical decision-making, the right-sided 95% reference interval was calculated using non- parametric statistics. The established reference interval was <53.6 mg/L.
DISCUSSION
IgD is considered a relatively non-significant immunoglobulin isotype. Although previous studies have revealed that IgD is re- lated to several clinical situations, such as IgD monoclonal gam- mopathy, hyper-IgD syndrome, and autoimmune disease, the clin- ical significance of IgD is still unknown [2]. However, IgD quanti- fication is important in the diagnosis and monitoring of IgD mono- clonal gammopathy [6]. Therefore, we evaluated the analytical performance of the SPAPLUS turbidimetric analyzer for IgD quan- tification.
Our study demonstrated good analytical performance of the SPAPLUS turbidimetric analyzer for IgD quantification. The evalu- ation of precision, linearity, and comparison between the SPAP- LUS and BNII showed satisfactory results. Although SPAPLUS showed good correlation with BNII (r=0.984), IgD concentration showed a significant difference between the SPAPLUS and BNII (P<0.0001). The difference was evident at concentrations >100 mg/L on the Bland-Altman plot. At this range, IgD concentration tended to be lower in the SPAPLUS than in the BNII, which could affect patient assessment, especially in IgD monoclonal gammop- athy. The stability issue of high concentration samples might be possible cause of the difference between two instruments. Be- cause it was extremely difficult to collect a sufficient number of high concentration samples for comparison, we used high con- centration samples kept by other institutions, which might affect the stability of the samples.
The reference interval established in this study (0–53.6 mg/L) was narrower than that claimed by the manufacturer (reagents LK013.S and LK013.T, 7.7–132.1 mg/L and 1.3–152.7 mg/L, respec- tively). The difference between reference intervals claimed by the manufacturer (reagents LK013.S and LK013.T) and those estab- lished in this study might be due to differences in several factors in individuals included in each study. Because smoking is a well- known factor affecting IgD concentration [9-11], we retrospectively
reviewed the smoking history of 120 individuals included in the reference interval establishment in this study. Of 120 individuals, 32 had no information on smoking history. The remaining 88 in- dividuals consisted of 59.1% (52/88) never smokers, 19.3% (17/88) current smokers, and 21.6% (19/88) ex-smokers. Applying the ref- erence interval claimed by the manufacturer (LK013.S), 64 indi- viduals had concentrations not within the lower limit of reference interval: 29 never smokers, 9 current smokers, 8 ex-smokers, and 18 individuals without information on smoking history. Except for the 64 individuals, median IgD concentrations were higher in ex- smokers and current smokers than in never smokers (30.5 mg/L, 30.4 mg/L, and 22.0 mg/L, respectively). This finding was consis- tent with previous studies that indicated positive association be- tween IgD concentration and smoking [9-11]. However, unfortu- nately, because the package insert provided by the manufacturer did not include smoking information for individuals included in the reference interval establishment, we could not conclude that smoking was the contributing factor to the difference in reference intervals. Some previous studies reported the influence of sex on IgD concentrations: IgD concentrations were higher in men [10, 12]. However, some studies show no significant difference in IgD concentrations between men and women [2, 9]. Therefore, we ad- ditionally compared the IgD concentrations in men and women using 120 healthy individuals, but there was no significant differ- ence (P=0.0746).
Ethnicity was another possible factor causing a difference in reference intervals. The reference intervals claimed by the manu- facturer (reagents LK013.S and LK013.T) were based on the US and UK populations, respectively. In contrast, this study was con- ducted in the Korean population. Although a previous study of Gerrard et al. showed different IgD concentrations in different ethnic populations [18], there have been few studies that have ad- dressed the association of IgD concentration and ethnicity. Fur- ther studies are needed to establish an association between IgD concentration and ethnicity.
In conclusion, the SPAPLUS turbidimetric analyzer shows good analytical performance for IgD quantification. At a high concen- tration, results from the SPAPLUS and BNII showed a significant difference. In addition, because the reference interval for IgD can be affected by several factors, it is recommended to consider these factors when establishing a reference interval.
요 약
배경: IgD는 혈청 총 면역글로불린의 1% 미만을 차지하는데, 특정 한 임상 상황에서 농도 변화가 나타날 수 있다. 이 연구에서는 혼 탁면역법을 이용하는 SPAPLUS 분석기(The Binding Site, UK)의 혈청 IgD 정량에 대한 성능 평가 및 한국인에서 IgD의 참고구간을 설정하였다.
방법: CLSI (Clinical and Laboratory Standards Institute) 가이드라 인에 따라 정밀도와 직선성을 평가하였으며 참고구간 설정을 진행 하였다. 또한 BNII (Siemens Healthineers, Germany) 장비와의 비 교 분석을 함께 진행하였다.
결과: 세 가지 농도 검체에 대하여 반복정밀도(%CV)는 0.78-2.14%, 검사실 내 정밀도(%CV)는 4.10-5.40%의 결과를 보였으며, 분석측 정범위 내에서 직선성을 유지하였다(R2=0.9996). SPAPLUS와 BNII 장비 간 IgD 측정값은 다음과 같은 상관관계를 보였다(y=0.890x- 1.852, r=0.984). 하지만 100 mg/L 이상의 농도에서는 SPAPLUS가 BNII보다 낮은 농도를 보이는 경향이 있었다. 설정된 참고구간의 상한치는 53.6 mg/L이었다.
결론: SPAPLUS 장비는 혈청 IgD 정량에 대해서 우수한 검사 수행 능을 보여주었다.
Conflicts of Interest
None declared.
REFERENCES
1. Rowe DS and Fahey JL. A new class of human immunoglobulins. I. A unique myeloma protein. J Exp Med 1965;121:171-84.
2. Rigante D. The truth on IgD in the ploy of immune surveillance and inflammation. Immunol Res 2016;64:632-5.
3. van der Meer JW, Vossen JM, Radl J, van Nieuwkoop JA, Meyer CJ, Lo- batto S, et al. Hyperimmunoglobulinaemia D and periodic fever: a new syndrome. Lancet 1984;1:1087-90.
4. Pope RM, Keightley R, McDuffy S. Circulating autoantibodies to IgD in rheumatic diseases. J Immunol 1982;128:1860-3.
5. Pandey S and Kyle RA. Unusual myelomas: a review of IgD and IgE variants. Oncology (Williston Park) 2013;27:798-803.
6. Bladé J, Lust JA, Kyle RA. Immunoglobulin D multiple myeloma: pre- senting features, response to therapy, and survival in a series of 53
cases. J Clin Oncol 1994;12:2398-404.
7. Dunnette SL, Gleich GJ, Miller RD, Kyle RA. Measurement of IgD by a double antibody radioimmunoassay: demonstration of an apparent tri- modal distribution of IgD levels in normal human sera. J Immunol 1977;119:1727-31.
8. Rowe DS, Crabbé PA, Turner MW. Immunoglobulin D in serum, body fluids and lymphoid tissues. Clin Exp Immunol 1968;3:477-90.
9. Carballo I, Rabuñal N, Alvela L, Pérez LF, Vidal C, Alonso M, et al. Fac- tors influencing serum concentrations of immunoglobulin D in the adult population: an observational study in Spain. Scand J Immunol 2017;85:272-9.
10. Mosedale DE, Sandhu MS, Luan J, Goodall M, Grainger DJ. A new sen- sitive and specific enzyme-linked immunosorbent assay for IgD. J Im- munol Methods 2006;313:74-80.
11. Bahna SL, Heiner DC, Myhre BA. Changes in serum IgD in cigarette smokers. Clin Exp Immunol 1983;51:624-30.
12. Dunnette SL, Gleich GJ, Weinshilboum RM. Inheritance of low serum immunoglobulin D. J Clin Invest 1978;62:248-55.
13. Gerrard JW, Heiner DC, Ko CG, Mink J, Meyers A, Dosman JA. Immu- noglobulin levels in smokers and non-smokers. Ann Allergy 1980;44:
261-2.
14. Clinical Laboratory Standards Institute. Evaluation of precision of quan- titative measurement procedures; Approved guideline—Third edition.
CLSI document EP05-A3. Wayne, PA: Clinical Laboratory Standards Institute, 2014.
15. Clinical Laboratory Standards Institute. Evaluation of the linearity of quantitative measurement procedures: a statistical approach; Approved guideline. CLSI document EP06-A. Wayne, PA: Clinical Laboratory Stan- dards Institute, 2003.
16. Clinical Laboratory Standards Institute. Measurement procedure com- parison and bias estimation using patient samples; Approved guide- line-Third edition. CLSI document EP09-A3. Wayne, PA: Clinical Labo- ratory Standards Institute, 2013.
17. Clinical Laboratory Standards Institute. Defining, establishing, and verifying reference intervals in the clinical laboratory; Approved guide- line-Third edition. CLSI document EP28-A3C. Wayne, PA: Clinical Lab- oratory Standards Institute, 2010.
18. Gerrard JW, Heiner DC, Ko CG, Mink JT, Myers A. IgD levels in white and Metis communities in Saskatchewan. Ann Allergy 1981;46:321-4.