Printed in the Republic of Korea
http://dx.doi.org/10.5012/jkcs.2014.58.2.198
Analysis of Efficiency of Bacillus subtilis To Treat Bagasse Based Paper and Pulp Industry Wastewater – A Novel Approach
Thirugnanasambandham Karichappan, Sivakumar Venkatachalam*, and Prakash Maran Jeganathan Department of Food Technology, Kongu Engineering College, Perundurai, Erode-638052, TN, India.
*E-mail: [email protected]
(Received December 6, 2013; Accepted February 19, 2014)
ABSTRACT: In this present study, bagasse based pulp and paper industry wastewater was treated under different operating conditions such as initial pH (6–8), temperature (25–35oC) and contact time (3–7 days) by using Bacillus subtilis. Response surface methodology (RSM) coupled with Box-Behnken response surface design (BBD) was employed to investigate the effect of process variables on the responses such as turbidity, biological oxygen demand (BOD) and chemical oxygen demand (COD) removal. The experimental data were analyzed by Pareto analysis of variance (ANOVA) and the second order polynomial models were developed. Interactive effects of the process variables on the responses were studied using plotting 3D response surface contour graph and the optimum process conditions were found to be: initial pH of 7, temperature of 30oC and contact time of 5 days. Under these conditions, removal efficiencies of turbidity, BOD and COD were found to be 85%, 93% and 80%
respectively which are close agreement with real experiments. These results indicate that the treatment of bagasse based pulp and paper industry wastewater using Bacillus subtilis is an effective and novel technique.
Key words: Bacillus subtilis, Bagasse wastewater, Box-Behnken design, Modeling, Optimization
INTRODUCTION
Environmental safeguarding pains and developments in the technology have resulted in stringent discharge stan- dards for discharge of industrial wastewaters to ecological system. Especially, discharge of paper and pulp industry wastewater into the ecological system pose a serious prob- lem to the aquatic life. Moreover, this industry consumes a large amount of fresh water and hence increase the water scraity.1 In India, most of the pulp and paper industries use wood as the major raw material and bagasse as an alter- native potential raw material for the production of paper.
Bagasse is the fibrous mass, remaining after the extraction of juice from sugarcane from the sugar industry.2 Government of India encourages the use of bagasse as the raw material for the paper production inorder to minimize the defor- estation. So that, many of the Indian paper industries uses a bagasse as an raw material now a days. Meanwhile, the bagasse based paper and pulp industry effluents have strong harmful characteristics such as biological oxygen demand (BOD), chemical oxygen demand (COD) and turbidity.
To meet strict laws on environmental protection, pollutant loads discharged from the this industry wastewater should be first reduced to a significant extent, and a proper treat- ment step should be further applied to improve the quality of the final discharge in terms of residual pollutant con-
tents.3 Therefore, there is a critical need to adopt a cost effective treatment technology to treat heavily contaminated bagasse wastewater.
An extensive literature survey shows that, only a few information is available in the literature regarding the appli- cability of different treatment methods for the treatment of bagasse wastewater such as anaerobic sludge blanket (UASB) reactor4 and white rot fungus.5 Anaerobic treatment (UASB) of bagasse-based pulp and paper industry effluent shows that the overall COD removal was 80–85% and the biogas production factor of 520 l/(kg COD reduced) was achieved with 5.75 kgCOD m−3 d−1 of organic loading rate and 20 h HRT. Treatment of bagasse wastewater with white rot fungus shows the maximum colour removal efficiency of 82.5%
at the optimal glucose and ammonium chloride concen- trations of 15 g/l and 0.5 g/l, respectively, in a pH of 4.5.
But these treatment processes has drawbacks such as long treatment time, start-up problem and low removal efficiency of COD and BOD. These characteristics makes it unfit to the large scale application and the discharge of wastewater after application of these treatment methods is still question- able due to the presence of considerable amount of pollut- ants. At present, biological treatment method of wastewaters using bacteria constitutes an alternative mode of treatment in aerobic conditions. Among various kinds of bacteria, the Bacillus subtilis bacteria have high biomass growth rate
and substrate reduction, which was widely used in various wastewater treatment process.6 An extensive literature survey shows that, there is no research report is available on the treatment of bagasse based pulp and paper industry wastewater using bacterial strain of Bacillus subtilis. Hence, the main objective of the present study has been made to investigate and optimize the individual and interactive effect of process variables such as initial pH, temperature and contact time on the treatment of bagasse based pulp and paper industry wastewater using bacterial strain of Bacillus subtilis via response surface methodology (RSM). The treat- ment efficiency of present process was investigated based on the removal efficiencies of turbidity, BOD and COD from bagasse based pulp and paper industry wastewater. The RSM is a statistical technique for designing experiments, building models, evaluating the effects of several factors, and searching optimum conditions for desirable responses.
With RSM, the interactions of possible influencing parame- ters on treatment efficiency can be evaluated with a lim- ited number of planned experiments with reduction of raw material and treatment time. Moreover, RSM has been widely used for optimization of various wastewater treat- ment processes.7 The results obtained from this study will useful to bagasse based paper and pulp industry wastewater treatment plants (WTP) for treating their effluents in a very effective manner with resanoable operating cost.
EXPERIMENTAL
The wastewater used in this study was collected from bagasse based pulp and paper industry in Erode region, TamilNadu, India. The characteristics of wastewater were analyzed and the physico-chemical properties were shown in Table 1. All the chemicals used in this study were ana- lytical grade. Initial pH of the wastewater was adjusted by using Hydrochloric acid or Sodium hydroxide (0.1 N).
The bacterial strain of Bacillus subtilis used in this study was obtained from Danisco Deutschland Gmbh, Germany and it was secluded by spread plate technique in nutrient agar media. Further it was identified by their morpholog- ical features and biochemical characterization.8 The mor- phological results confirm that, B. subtilis colonies were circular and shiny. Biochemical characterization of this
culture showed that, Methyl red, Voges proskauer and Indole tests were negative. Nitrate reduction, starch hydrolysis, catalase, Gram’s reaction and oxidase tests showed pos- itive results. Sub culturing was done on the nutrient agar and maintained the culture at 4oC in nutrient agar slants prior to use. Nutrient broth media9 was used to prepare liq- uid culture of this bacterial strain.
Batch studies were carried out in 250 ml Erlenmeyer flasks containing 100 ml bagasse wastewater (pH of 6−8), which was inoculated with freshly prepared broth (5 ml) of Bacillus subtilis. Then this reaction mixture was shaken in an incubator cum shaker at 150 rpm for the time period of 7 days by varying the temperature between 25−35oC under sterile conditions. Samples were withdrawn at partic- ular time intervals (5−7 days) from the flasks and were ana- lyzed to study the reduction of turbidity, BOD and COD.
The turbidity, BOD and COD analysis were carried out by methods described by American Public Health Associa- tion (APHA). The removal efficiency (RE) of turbidity, BOD and COD was calculated by using the following equation.10
RE = (1)
where, c0 and ce is the initial and final concentrations of turbidity, BOD and COD respectively.
In this study, Box-Behnken response surface experi- mental design (BBD) with three factors at three levels was used to optimize and investigate the influence of process variables initial pH (6–8), temperature (25–35oC) and contact time (3–7 days) on the removal efficiencies of tur- bidity, BOD and COD from bagasse based pulp and paper industry wastewater using bacterial strain of Bacillus sub- tilis. Process variables and their ranges were determined based on the single factor experimental analysis. After selec- tion of process (independent) variables and their ranges, experiments were established based on a BBD and the com- plete design consists of 17 experiments with three centre points (used to estimate the experimental error). The total number of experiments was calculated from the follow- ing equation10
(2) where, K is number of factors and C0 is the number of central point. For statistical calculations, the process variables were coded at three levels (−1, 0 and +1) and the coding was done by the following equation
(3) c0–ce
c0 ---
⎝ ⎠
⎛ ⎞ 100×
N=2K K 1( – ) C+ 0
xi Xi–Xz ΔXi ---
= i=1 2 3, , ……k Table 1. Characteristics of paper industry wastewater
Characteristics Values
Turbidity (NTU) 1250
BOD (mg/l) 2200
COD (mg/l) 5200
where xi, is the dimensionless value of an independent variable; Xi , the real value of an independent variable; Xz, the real value of an independent variable at the centre point;
and Xi, step change of the real value of the variable i. From the BBD experimental data, a second-order polynomial equation was fitted inorder to correlate the relationship between independent variables and responses. Generalized mathematical form of the second-order polynomial equa- tion is given below11
(4) where, Y is the response; Xi and Xj are variables (i and j range from 1 to k); β0 is the model intercept coefficient; βj, βjj and βij are interaction coefficients of linear, quadratic and the second-order terms, respectively; k is the number of independent parameters (k = 3 in this study); and ei is the error. Regression coefficients of linear, quadratic, and interaction involved in the second-order polynomial model and their effects were analyzed by Pareto analysis of vari- ance (ANOVA) and all the terms in the model were tested by student’s F-test. All the statistical analyses were done with the help of Stat ease Design Expert 8.0.7.1 statistical software package (Stat-Ease Inc., Minneapolis, USA). After that, models were used for the construction of response surface contour plots to predict the relationships between independent and dependent variables.
Finally, the optimization of the process variables was carried out by Derringer’s desired function methodology.
This numerical optimization technique will optimize any combination of one or more goals; these may be either process variables or responses. The possible goals are: maximize, minimize, target, within range, none (for responses only).
In this study, goals of the process variables were selected as in a range and the response goals were selected as max- imize. After optimization, adequacy of the model equation for predicting the optimum response values was validated under the optimal conditions. Triplicate verification experi- ments were performed under the optimal conditions and the average value of the experiments was compared with the predicted values of the developed model equations.12
RESULTS AND DISCUSSION
In this study, three factors with three levels BBD was used to evaluate the effect and optimize the process variables on the responses such as removal of turbidity, BOD and COD. A total number of 17 batch experiments including five centre points were carried out in triplicates using sta-
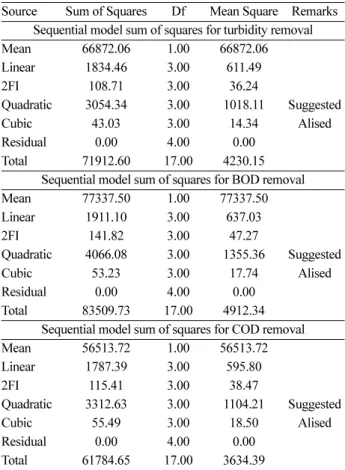
tistically deigned experiments and the results are shown in Table 2. The BBD experimental data was analyzed by sequential model sum of squares (Table 3) in order to obtain Y β0 βj
j 1=
∑
k xj βjj j 1=∑
k xj2 βij<j 2=
∑
k∑
i xixj ei+ + + +
=
Table 2. BBD experimental design and results
S. No X1 X2 X3 Y1 Y2 Y3
1 8 30 7 60.58 63.58 55.24
2 8 35 5 51.34 54.28 46.35
3 7 35 3 49.28 52.84 44.28
4 7 30 5 82.54 90.54 78.36
5 7 35 7 66.34 68.24 60.24
6 7 30 5 82.54 90.54 78.36
7 6 30 3 40.24 43.58 35.28
8 7 25 7 80.24 86.28 75.26
9 7 30 5 82.54 90.54 78.36
10 8 25 5 53.68 57.08 48.26
11 6 25 5 61.58 63.82 54.28
12 7 25 3 45.28 48.86 40.28
13 6 35 5 51.24 54.28 46.38
14 7 30 5 82.54 90.54 78.36
15 7 30 5 82.54 90.54 78.36
16 8 30 3 25.48 28.54 19.68
17 6 30 7 68.24 72.54 62.84
Table 3. Sequential model sum of squares for responses Source Sum of Squares Df Mean Square Remarks
Sequential model sum of squares for turbidity removal
Mean 66872.06 1.00 66872.06
Linear 1834.46 3.00 611.49
2FI 108.71 3.00 36.24
Quadratic 3054.34 3.00 1018.11 Suggested
Cubic 43.03 3.00 14.34 Alised
Residual 0.00 4.00 0.00
Total 71912.60 17.00 4230.15
Sequential model sum of squares for BOD removal
Mean 77337.50 1.00 77337.50
Linear 1911.10 3.00 637.03
2FI 141.82 3.00 47.27
Quadratic 4066.08 3.00 1355.36 Suggested
Cubic 53.23 3.00 17.74 Alised
Residual 0.00 4.00 0.00
Total 83509.73 17.00 4912.34
Sequential model sum of squares for COD removal
Mean 56513.72 1.00 56513.72
Linear 1787.39 3.00 595.80
2FI 115.41 3.00 38.47
Quadratic 3312.63 3.00 1104.21 Suggested
Cubic 55.49 3.00 18.50 Alised
Residual 0.00 4.00 0.00
Total 61784.65 17.00 3634.39
regression models and the decide about the adequacy of various models such as linear, interactive, quadratic and cubic models.13 From the Table 3, it is found that, linear and interactive (2FI) models are exhibited lower F-values and also having high p-values, when compared with qua- dratic model. Cubic model is found to be aliased. There- fore the quadratic model is chosen to describe the effects of process variables on the removal of turbidity, BOD and COD from bagasse based pulp and paper industry wastewater using Bacillus subtilis. An empirical relationship between the responses and independent variables is expressed by a second-order polynomial equation with interaction terms.
Three empirical models were developed to understand the interactive correlation between the responses and process variables. The final models obtained in terms of coded fac- tors are given below,
Y1= 82.54− 3.78A − 2.82B + 14.39C + 2.00AB + 1.78AC
− 4.47BC − 19.87A2− 8.21B2− 14.04C2 (5) Y2= 90.54− 3.84A − 3.30B + 14.60C + 1.69AB + 1.52AC
− 5.51BC − 22.69A2− 10.59B2− 15.90C2 (6) Y3= 78.36− 3.66A − 2.60B + 14.26C + 1.50AB + 2.00AC
− 4.76BC − 20.65A2− 8.89B2− 14.45C2 (7) Where Y1, Y2 and Y3 are turbidity, BOD and COD removal respectively. The statistical significance of the response functions (Y1−Y3) was checked by F-test, and the ANOVA results for response surface quadratic model and model terms are summarized in Table 4. The model F values and very low probability value (0.0001) indicated that the devel- oped mathematical model was statistically significant and model equation can adequately used to describe the con- tinuous electrocoagulation treatment method under a wide range of operating conditions. The p values are used to
estimate whether F value is large enough to indicate sta- tistical significance and used to check the significance of each coefficient. p values lower than 0.05 indicate that the model and model terms are statistically significant.
Significance of the developed model equations was evaluated by Pareto analysis of variance (ANOVA) and it is shown in Table 4. The higher model F values and lower p values (p < 0.0001) demonstrated that, the developed model was highly significant. The fit of the model was also eval- uated by the determination co-efficient (R2), adj-R2 and Pre-R2. The high R2 values revealed that, the developed mod- els are statistically significant and only small variations are not explained by the models. The value of Pre-R2 is in rea- sonable agreement with the value of adj-R2 and also shows that the form of the model chosen to explain the relation- ship between the factors and the response is well-correlated.14 These results indicate that, the deviations between exper- imental and predicted values are low and also showed a high degree of precision and reliability of the conducted experiments.14 Moreover, the adequacy of models was eval- uated by constructing diagnostic plots such as predicted versus actual for the experimental data and it is shown in Fig. 1a−c. From the Figures, it is observed that, the data points on this plot lie very close to the diagonal line, because resid- uals for the prediction of each response is minimum and it indicates a good adequate agreement between experimental data and the data predicted by the developed models. This can confirm the normal distribution of the observed data and adequacy of the developed models.
Effect of Process Variables on Responses
Response surface contour plots were plotted from the developed models in order to study the individual and Table 4. ANOVA table for responses
Source Y1 Y2 Y3
F value p value F value p value F value p value
Model 90.33 < 0.0001 89.40 < 0.0001 73.10 < 0.0001
A 18.57 0.0035 15.53 0.0056 13.49 0.0079
B 10.37 0.0147 11.46 0.0117 6.84 0.0346
C 269.49 < 0.0001 224.32 < 0.0001 205.14 < 0.0001
AB 2.60 0.1507 1.49 0.2612 1.13 0.3228
AC 2.05 0.1953 1.22 0.3067 2.02 0.1984
BC 13.03 0.0086 15.94 0.0052 11.41 0.0118
A2 270.30 < 0.0001 282.42 < 0.0001 226.46 < 0.0001
B2 46.23 0.0003 62.09 0.0001 42.01 0.0003
C2 135.02 < 0.0001 139.89 < 0.0001 110.92 < 0.0001
R2 0.9915 0.9914 0.9895
Adj-R2 0.9805 0.9803 0.9759
Pre-R2 0.8634 0.8620 0.8316
interaction effect among process variables on the responses and also used to determine the optimal condition of each factor for the maximum removal of turbidity, BOD and COD from bagasse based pulp and paper industry waste- water using Bacillus subtilis. In this study, the model has more than two factors. So, the contour plots are drawn by maintaining one factor at a constant level (in turn at its central level), whereas the other two factors were varied in their range.15
Effect of Initial pH
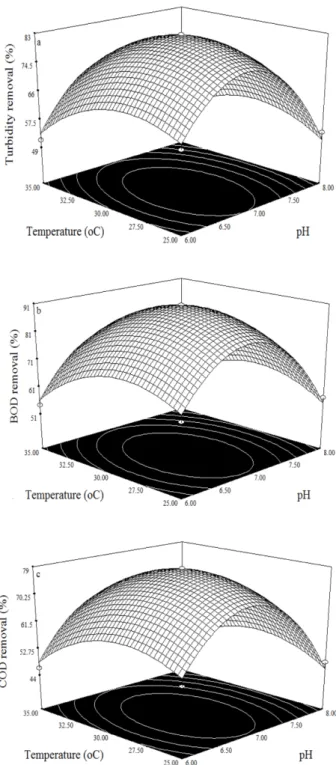
Experiments were carried out to study the effect of ini- tial pH (6, 7 and 8) over the removal of turbidity, BOD and COD from bagasse based pulp and paper industry waste- water. From the results, it was observed that, the removal efficiency of turbidity, BOD and COD was increased lin- early with increasing pH from 6−7 (Fig. 2a−c). Thereafter, Figure 1. Predicted versus actual plot for responses.
Figure 2. Effect of pH and temperature on responses.
there is drastic decrease in removal efficiency of turbidity, BOD and COD. These results clearly show that at pH 7 (neutral) is best working condition for this study.16 Effect of Temperature
Experiments were carried out to study the effect of tem- perature (25, 30 and 35oC) over the removal of turbidity, BOD and COD from bagasse based pulp and paper indus- try wastewater. From the results, it was observed that, the removal of turbidity, BOD and COD was increased lin- early with increasing temperature from 25−30oC (Fig. 2a−c).
Increase in temperature up to 30oC would increase the growth rate of bacterial species which accelerate the treatment efficiency. However, temperature beyond 30oC resulted in lower removal efficiencies, due to the negative impact on bacterial growth rate by the higher temperature.17 Effect of Contact Time
Contact time is one of the important factors for the removal of turbidity, BOD and COD from bagasse based pulp and paper industry wastewater and it is associated with efficiency of treatment process. From the results (Fig. 3a−c), it is found that, the removal of turbidity, BOD and COD was increased upto contact time of 5 days.
Beyond that, there is a negligible effect in removal of tur- bidity, BOD and COD. This phenomenon is explained by that, after the optimum contact time, almost all the organic matters present in the wastewater were effectively degraded by bacterial species and shows the ignorable effect.18 Optimization
Optimization of the process variables was determined by Derringer’s desired function methodology19,20 as follows:
initial pH of 7, temperature of 30oC and contact time of 5 days. Under these conditions, predicted removal of tur- bidity, BOD and COD were found to be 85%, 93% and 80% respectively with a desirability value of 0.996. The suitability of optimum conditions for predicting optimum response values was tested under the same set of optimized conditions. Triplicate experiments were performed under the optimized conditions and the mean values obtained from real experiments, demonstrated the validation of the opti- mized conditions.21,22
CONCLUSION
In this study, BBD was employed to study and optimize the process variables such as initial pH, temperature and contact time on the removal of turbidity, BOD and COD from bagasse based pulp and paper industry wastewater using Bacillus subtilis. From the experimental results, the mathematical models were developed with high R2 value and it was used to investigate the interactive effects of pro- cess variables on responses. ANOVA showed that all the process variables have significant effect on removal effi- ciencies. Optimum set of the process variables was obtained by derringer’s desired function methodology and it were found to be: initial pH of 7, temperature of 30oC and contact time of 5 days. Under these optimal conditions, the exper- imental removal efficiencies of turbidity, BOD and COD Figure 3. Effect of temperature and contact time on responses.
were found to be 85%, 93% and 80% respectively. These results indicates that effectiveness of Bacillus subtilis to treat bagasse based pulp and paper industry wastewater.
Acknowledgments. Publication cost of this paper was supported by the Korean Chemical Society.
REFERENCES
1. Merzouk, B.; Gourich, B.; Sekki, A.; Madani, K.;
Chibane, M. J. Hazard. Mater. 2009, 164, 215.
2. Khalid, B.; Melhem, E. S. J. Chem Eng. 2012, 198, 201.
3. Manaswini, B.; Partha, S. J.; Tanaji, T. M.; Ghangrekar, M. M. Bioelectrochemistry 2010, 79, 228.
4. Thirugnanasambandham, K.; Sivakumar, V.; Prakash Maran, J. Carbohyd. Polym. 2013, 97, 451.
5. Zouboulis, A.; Katsoyiannis, I. Sep. Sci. Tech. 2002, 37, 2859.
6. Lew, B.; Tarre, S.; Belavski, M.; Gree, M. Water Sci.
Tech. 2004, 49, 295.
7. Prakash Maran, J.; Sivakumar, V.; Thirugnanasam- bandham, K.; Sridhar, R. Prep. Biochem. Biotech. 2013.
DOI:10.1080/10826068.2013.791629.
8. Aghamohammadi, N.; Aziz, H. A; Isa, M. H.; Zina- tizadeh, A. A. Bioresour. Tech. 2007, 98, 3570.
9. Nordin, M. Y.; Venkatesh, V. C.; Sharif, S.; Elting, S.;
Abdullah, A. J. Mater. Process Tech. 2004, 145, 46.
10. Sridhar, R.; Sivakumar, V.; Prince Immanuel, V.; Prakash Maran, J. J. Hazard. Mater. 2011, 186, 1495.
11. Reungsang, A.; Pattra, S.; Sittijunda, S. Energies 2012, 5, 4746.
12. APHA, WPCF, AWWA Standard Methods for the Examination of Water and Wastewater, 19th ed.; Amer- ican Public Health Association (APHA): Washington, DC, 1992.
13. Prakash Maran, J.; Manikandan, S.; Thirugnanasam- bandham, K.; Vigna Nivetha, C.; Dinesh, R. Carbohyd.
Polym. 2013, 92, 604.
14. Bhatti, M. S.; Reddy, A. S.; Thukral, A. K. J. Hazard.
Mater. 2009, 172, 839.
15. Prakash Maran, J.; Manikandan, S.; Vigna Nivetha, C.; Dinesh, R. Ara. J. Chem. DOI: 10.1016/j.arabjc.
2013.02.007
16. Thirugnanasambandham, K.; Sivakumar, V.; Prakash Maran, J. J. Serb. Chem. Soc. 2013. DOI: 10.2298/
JSC130201053T.
17. Kabir, E.; Hussain, D.; Haque, A.; Kim, K. H. Int. J.
Green Energy. 2009, 6(4), 381.
18. Thirugnanasambandham, K.; Sivakumar, V.; Prakash Maran, J. J. Serb. Chem. Soc. 2013. DOI: 10.2298/
JSC130408074T.
19. Tak Hyun, K.; Chulhwan, P.; Eung Bai, Shin.; Sangyong, K. Desalination. 2002, 150, 165.
20. Thirugnanasambandham, K.; Sivakumar, V.; Prakash Maran, J. J. Serb. Chem. Soc. 2013. DOI: 10.2298/
JSC130408074T.
21. Prakash Maran, J.; Sivakumar, V.; Thirugnanasam- bandham, K. Food Sci. Biotechnol. DOI 10.1007/s10068- 014-0.
22. Thirugnanasambandham, K.; Sivakumar, V.; Prakash Maran, J. J. Serb. Chem. Soc. 2013. DOI: 10.2298/
JSC130619153T.