ISSN 2287-8130(Online) Particle and Aerosol Research
Part. Aerosol Res. Vol.12, No. 1: March 2016 pp. 21-26 http://dx.doi.org/10.11629/jpaar.2016.12.1.021
Development of Light Transmission Fluctuation for Particle Measurement in Solid-Gas Two Phase Flows
YANG Bin*, WANG Zhan-ping, HE Yuan and CAI Xiao-Shu
Institute of Particle and Two-phase Flow Measurement / Shanghai Key Laboratory of Multiphase Flow and Heat Transfer in Power Engineering, University of Shanghai for Science and Technology, Shanghai 200093, China
(Received 4 August 2015; Revised 28 December 2015; Accepted 24 February 2016)
Abstract
In order to realize In-line and convenient measurement for solid-gas two phase flows, Light Transmission Fluctuation (LTF) based on the random variation of transmitted light intensity, light scattering theory and cross-correlation method was presented for online measurement of particle size, concentration and velocity. The statistical relationship among transmitted light intensity, particle size and particle number in measurement zone was described by Beer-Lambert Law. Accordingly, the particle size and concentration were determined from the fluctuation signal of transmitted light intensity. Simultaneously, the particle velocity was calculated by cross-correlation analysis of two neighboring light beams. By considering the influence of concentration variation in industrial applications, the improved algorithm based on spectral analysis of transmitted light intensity was proposed to improve measurement accuracy and stability. Therefore, the online measurement system based on LTF was developed and applied to measure pulverized coal in power station and raw material in cement plant. The particle size, concentration and velocity of powder were monitored in real-time. It can provide important references for optimal control, energy saving and emission reduction of energy-intensive industries.
Keywords:gas-solid two-phase flow; In-line measurement; Light Transmission Fluctuation method;
cross-correlation method; concentration influence
* Corresponding author.
Tel:+86-021-55277764 E-mail:[email protected]
1. Introduction
Gas-solid two phase flows are encountered in numerous industrial systems including power station boiler, cement production, pharmaceutical manufacture and so on[1]. Due to the need of real time optimization and control, the measurements of particle size, concentration and velocity have significant to save energy and reduce emission[2].
At present, the popular methods to measure particle parameters in gas-solid two phase flows are ultrasonic method, imaging method and optical method [3-5]. For the harsh environment of industrial applications, the ultrasonic method is easily influenced by thermal properties, and the imaging method is strict with particle concentration for illumination. Due to simple structure, Light Transmission Fluctuation (LTF) method, based on the random variation of transmitted light intensity, light scattering theory and cross-correlation method, is more suitable for In-line measurement in the industrial applications with high sensitivity and reliability [6-8]. Unfortunately, the results based on LTF usually have great errors and fluctuation for the influence of concentration variation in industrial applications. It could not meet the demand of real time optimization and control.
In this paper, the transmission signal is analyzed by spectral analysis method. The comparison of frequency distributions in different concentration conditions is discussed to determine the frequency range of concentration variation. The corrected algorithm is proposed to improve measurement accuracy and stability. Furthermore, the recent applications in power station and cement plant are introduced in detail.
2. Fundamentals of LTF method
2.1 Beer-Lambert law
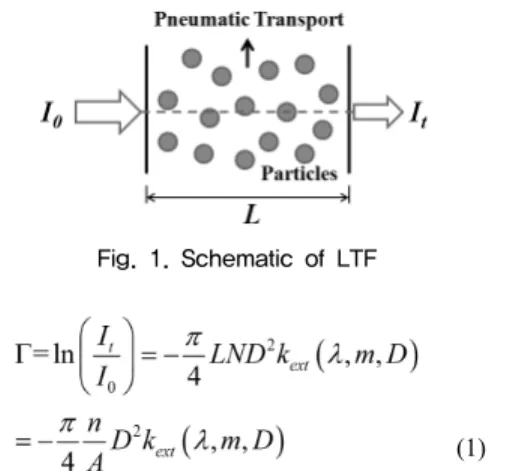
As shown as Fig. 1, when the light transmits through the gas-solid two phase flow, the intensity is attenuated for scattering. The Beer-Lambert law describes the relationship between transmitted and incident light intensities as follow:
Fig. 1. Schematic of LTF
(1) where, Γ is the transmissivity, which is the ratio of the intensity of transmitted light It and the intensity of incident light I0. L is the optical path of the beam in the measuring area. N is the concentration of particles per unit volume. A is the beam light area. Thus, the particle number n in the light is n=NAL. D is the average size of the particle. kext is the extinction coefficient, which is a function of the wavelength of the incident light l, the average particle size D, and the particle relative refractive index m. It can be calculated by Mie scattering theory.
Define Sext as the extinction area of the particle:
(2) Combining Equation (1) and (2) gives as follow:
(3)
With the reduction of the cross-sectional area of the beam A, the particle number n in the light will be declined.
n can be considered as Poisson distribution when A reduce to a certain extent. Thus, the statistical relationship between G and n could be built as follow:
(4)
Combining Equation (3) with (4) gives the average particle size D as follow:
(5)
Once the particle size D is determined, the concentration could be obtained by Equation (1) as follow:
(6)
2.2 Cross-correlation method
As shown as Fig. 2, two light beams are placed with a certain distance between them along the tunnel. The passing of solid particles causes the similar attenuation with time delay. The velocity can be obtained from the cross-correlation analysis of the two attenuation signals.
Fig. 2. Schematic of cross-correlation method
The cross-correlation of the two attenuation signals, y1(t), y2(t) is defined as follows:
(7) where, R12 specifies the similarity between signal y1(t) and y2(t). R12 will have a maximum when = Then the time delay is , and the velocity could be calculated as follow:
(8) where, l is the distance to measurement zone.
3. Concentration variation influence
3.1 Experiment system
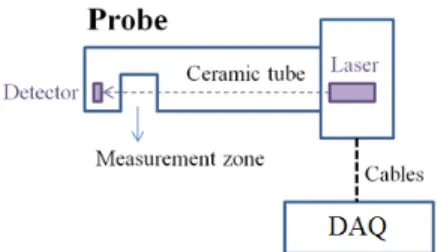
The experiment schematic of measurement system including probe and Data Acquisition System (DAS) is shown in Fig. 3. The probe is designed to a groove structure of which contains the laser and the detector inside. The light transmission fluctuation signals are recorded and analyzed by DAQ. In order to simulate particle concentration variation conditions, the gas-solid two phase
flow system is designed as shown in Fig.4, The particle concertation is varied by adjusting the valve.
Fig. 3. Particle parameters measurement system
Fig. 4. Experiment system
3.2 Results and discussion
The light fluctuation signals in constant and variation concentration conditions are shown in Fig. 5. Compared with the constant concentration signal, the frequency of variation concentration signal is lower, and the amplitude is larger. Thus, the frequency spectrums of the two signals are obviously different.
Fig.5. Signals in different conditions
As shown in Fig.6, the two typical signals are analyzed by Fast Fourier Transform Algorithm (FFT). When the frequency is higher than 75Hz, the amplitudes of these two signals are almost same; while the frequency is lower than 75Hz, the amplitudes are obviously difference. Thus, the influence of concentration variation on light transmission fluctuation signals only within 75Hz. The signals with higher than 75Hz frequency are considered as the cause of particle flowing in the measurement area.
Therefore, 75Hz is determined as the threshold frequency to weaken influences of concentration variation. Certainly, the determination of threshold frequency depends on particle size and velocity. It requires concrete analysis in concrete conditions.
Fig.6. Schematic of the signal amplitude spectrum
In conclusion, the high pass filtering algorithm with 75Hz as threshold frequency is used to analyze the light transmission fluctuation signals. The improved algorithm based on spectral analysis of transmitted light intensity was proposed to calculate the particle size.
Compared with original algorithm, 42 experiments were carried out by this improved algorithm. The result shows that the average value is reduced from 87.8μm to 52.7μm, and the standard deviation is also reduced from 18.8μm to 11.3μm.
Meanwhile, the sample particle size was measured by laser particle analyzer (Malvern APA2000). The result is shown in Fig. 7. The mean value of 5 times measurements is 47.5μm. Compared with result by laser particle analyzer, the relative deviation of LTF using improved algorithm
reduces to 10.9%.
Therefore, the improved algorithm based on spectral analysis of transmitted light intensity was proposed to improve measurement accuracy and stability.
Fig.7. Result by laser particle analyzer
4. Industrial Applications
4.1 Raw cement in cement plant
Recently, as shown in Fig. 8, the system based on LTF is installed in the straight pipe of pneumatic transport of raw materials in Fuyang South Cement Company Limited.
The particle size of raw materials is measured in real time to connect Distributed Control System (DCS).
Fig. 8. Measurement system installed in the straight pipe of pneumatic transport of raw materials
During the operation of the measurement system, the powder of the cement raw material in the pipe of pneumatic transport is sampled by standard process.
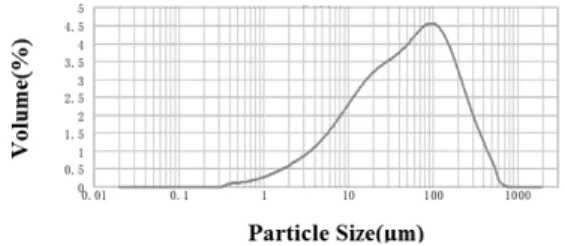
As shown in Fig. 9, the median diameter D50 of the sample which is analyzed by Particle Image Processor (OMEC PIP8.1) is 9.8μm. Compared with the result by Particle Image Processor (OMEC PIP8.1), the average result during sampling time is 8.6μm. The relative
deviation between these two methods is 12.2%. Thus, the measurement system based on LTF has higher accuracy and credibility to monitoring the particle size of raw materials. It can provide a reliable and direct reference to optimization control in production process.
Monitoring results in 9 hours running are shown in the Fig.8. The average particle size of the cement raw material is between 10 to 15μm, and it can meet the requirement of the cement production about the particle size of the cement raw material. Besides, at about 6:50, the milling was stopping working, and at the beginning the gas-solid two-phase flow became unstable suddenly.
Thus, there is large fluctuation immediately and simultaneously in monitoring result, and then reduce to zero. At about 7:20, the milling was working again, and the monitoring result returned. Consequently, the In-line measurement system can monitor the particle size of the cement raw material in the cement production for a long time running and provide a great reference of the process about the cement production.
Fig. 9. Monitoring results in 9 hours continuous running
4.2 Pulverized coal in power station
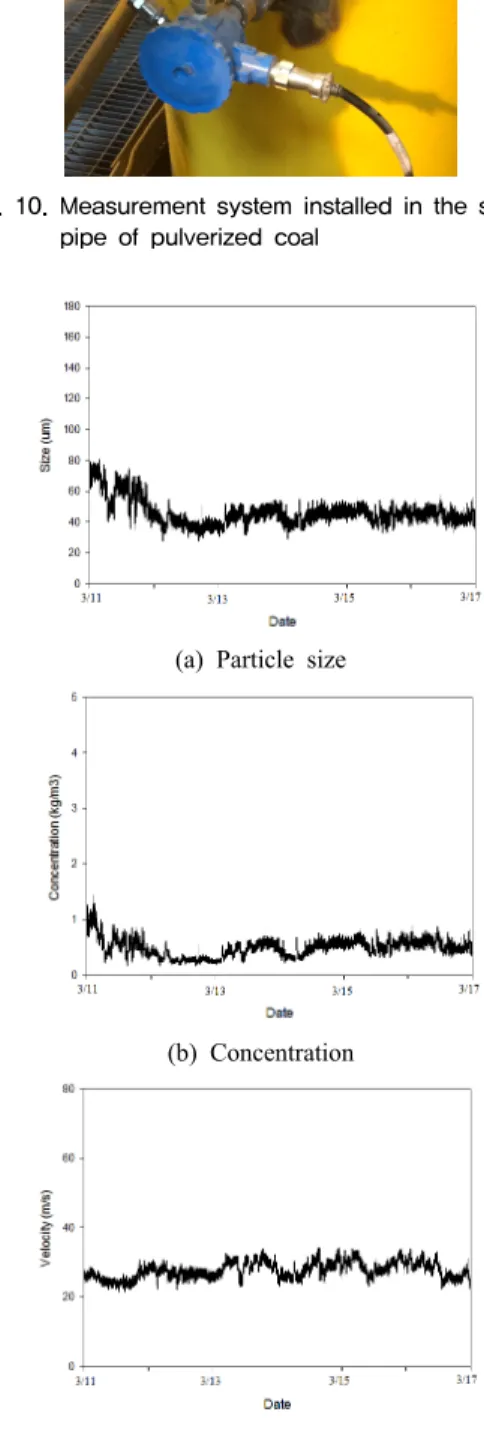
Recently, as shown in Fig. 10, the system based on LTF is also applied to monitor the particle size, concentration and velocity of pulverized coal in Shaojiao
‘C’ Power Station of Guangdong YUEDEAN Group Co., Ltd. The results in 6 days continuous running are shown in Fig. 11. The typical average value of particle size, concentration and velocity are 46.7μm, 0.55kg/m3 and 28.0m/s respectively. The real-time result were recorded and displayed by DCS reliably and stably. It also can provide significant support optimization control to increase energy efficiency and reduce emission.
Fig. 10. Measurement system installed in the straight pipe of pulverized coal
(a) Particle size
(b) Concentration
(c) Velocity
Fig. 11. Monitoring results in 6 days continuous running
5. Conclusions
(1) Based on LTF method, the In-line measurement system of particle parameters was developed to realize real time monitoring of the particle parameters in pneumatic conveying process with high reliability.
(2) By considering the influence of concentration variation in industrial applications, the comparison of frequency distributions in different concentration conditions was discussed to determine the frequency range of concentration variation. Accordingly, the corrected algorithm based on spectral analysis was proposed to improve measurement accuracy and stability.
(3) The LFT system has applied to monitor particle parameters of raw cement in cement plant and pulverized coal in power station recently. The results show that the system has high reliability and stability in long time running.
Acknowledgments
The authors gratefully acknowledge the financial support provided by Shanghai Science and Technology Commission of China (No. 13DZ2260900) and Shanghai Young University Teachers Training Program (No.
ZZslg15002).
References
[1] Cl Kleinstreuer, (2003). Two-Phase Flow: Theory and Applications, Taylor & Francis, New York.
[2] Allen, T., (1990). Particle Size Measurement, Chapman& Hall, New York.
[3] Ying Zheng, Qikai Zhang. (2004). Simultaneous meas- urement of gas and solid holdups in multiphase systems using ultrasonic technique, Chemical Engineering Science, 59(17), 3505-14.
[4] Kaoru Miyazaki, Gang Chen, Fujio Yamamoto, Jun-ichi Ohta, Yuichi Murai, Kiyoshi Hori. (1999). PIV meas- urement of particle motion in spiral gas-solid two-phase flow, Experimental Thermal and Fluid Science, 19(4), 194-203.
[5] Xinhua Liu, Shiqiu Gao, Jinghai Li. (2005).
Characterizing particle clustering behavior by PDPA measurement for dilute gas-solid flow, Chemical Engineering Journal, 108(3), 193-202.
[6] K.S Shifrin, A. N Sakharov. (1975). Determination of the average size and concentration of suspended particles from intensity fluctuations of transmitted light, Optics and Spectroscopy, 39(2), 208-210.
[7] Xiaoshu Cai, Junfeng Li, Xin Ouyang, Zhijun Zhao, Mingxu Su. (2005). In-line measurement of pneumati- cally conveyed particles by a light transmission fluctua- tion method, Flow Measurement and Instrumentation, 16(5), 315-320.
[8] Shouxuan Qin and Xiaoshu Cai. (2011). Indirect meas- urement of the intensity of incident light by the light transmission fluctuation method, Optics Letters, 36(20), 4068-70.