Article https://doi.org/10.14478/ace.2020.1102
1. Introduction
1)As a key information display and communication tool in the fourth industrial revolution, displays are very important. In particular, not only small- and medium-sized but also large-sized OLEDs are the most competitive displays that can realize form factor-free in displays for mass production[1,2]. Among them, interest in quantum dot (QD)-organic light emitting diodes (OLED) research is increasing in recent years be- cause it exhibit high color gamut in BT 2020, excellent wide-angle de- pendence (WAD) characteristics and fast response speed[3,4]. The QD-OLED display made by the combination of QD and OLED is a display that shows information using QD devices, which are nano- meter-sized microscopic semiconductor particles that emit light by themselves by absorbing the incident blue light[5]. Despite being a next-generation display with such excellent characteristics, many stud- ies have been conducted to increase the efficiency of quantum dot ma- terials themselves, including Cd-based and non-Cd-based materials and devices[6,7]. In addition, the efficiency of the QD material itself is greatly affected by various processes applied to the actual display[8].
In other words, it is important to improve the efficiency of the materi- als itself in order to maximize the light conversion efficiency by col- lecting blue incident light, but the approach to structural optimization of process architecture is also very important. Furthermore, in ap- proaching such structural optimization, color purity, which is one of the
† Corresponding Author: Kyungpook National University,
Department of Hydrogen and Renewable Energy, Daegu 41566, Republic of Korea
Tel: +82-10-7339-2064 e-mail: [email protected]
pISSN: 1225-0112eISSN: 2288-4505 @ 2021 The Korean Society of Industrial and Engineering Chemistry. All rights reserved.
biggest advantages of QD, must be considered together[9]. However, most of the papers have been reported on efficiency and color gamut of quantum dot light-emitting diodes (QLEDs), but there are few pa- pers on QD-OLED[10,11].
Therefore, first of all, in this paper, the optimization of the device structure for QD-OLED to improve the color purity of red was studied.
That is, the influence of the process architecture that affects the emis- sion spectrum of red color after passing through the red(R)-QD was systematically investigated. Especially, in organic optoelectronic devices, numerical analysis is very important when experiments are designed to extract the physical factors that control the electrical and optical prop- erties and to optimize the in device performance[12]. Therefore, in this study, the effect of the QD-OLED process architecture on the emission spectrum was systematically analyzed using Fluxim’s the semiconducting thin film optics simulation (SETFOS) tool. The SETFOS is a very use- ful tool for developing these novel optoelectronic thin film-based technologies. This tool basically follows the Monte Carlo simulation of the transport of a single-type charge carrier in a device composed of a disordered organic semiconductor located in between two electro- des[13,14]. In particular, this tool is used to analyze the influence of factors such as QD density in the QD layer and the thickness of QD layer to improve color purity, which is essential in obtain a high color gamut, and to investigate the optimal structure of QD-OLED devices.
2. Experimental
2.1. Device design of the OLED multi-layers
As shown in Figure 1, a blue OLED emitting layer consisting of dif- ferent layers was designed in this paper. Indium tin oxide (ITO) mate-
Optimization of the Emission Spectrum of Red Color in Quantum Dot-Organic Light Emitting Diodes
Byoung-Seong Jeong†
Graduate School of Advanced Integration of Science and Technology, Department of Hydrogen and Renewable Energy, Kyungpook National University, Daegu 41566, Republic of Korea
(Received December 10, 2020; Revised January 12, 2021; Accepted February 5, 2021)
Abstract
We investigated the optimal stacked structure from the perspective of process architecture (PA) through emission spectrum analysis according to the wavelength of quantum dot (QD)-organic light-emitting diodes (OLED). We confirmed that the blue-light leakage through the QD can be minimized by increasing the QD filling density above a critical value in the red QD (R-QD) layer. In addition, when the thickness of red-color filter (R-CF) at the upper part of the R-QD increased to more than 3 µm, the leakage of blue light through the R-CF was effectively blocked, and a very sharp emission spectrum in the red wavelength band could be obtained. According to these outstanding results, we expect that the development of QD-OLED displays with very excellent color gamut can be possibly realized.
Keywords: Quantum dot, OLED, Emission spectrum, Light extraction, Process architecture
Figure 1. The basic structure of the investigated OLED multi-layers and the materials used in the different layers.
Figure 2. The energy band diagram of the OLED multi-layers.
rials were selected as the anode electrode, and Ca and Al materials were selected as the cathode electrode. The 5-nm Ca layer is thinly de- posited on the 150-nm Al layer to facilitate electron’s injection effi- ciency from the cathode. For the electron injecting layer (EIL) layer, 40-nm of n-NET5 material was used and 10-nm of NET5 material was used as the electron transporting layer (ETL). The emitting layer was a fluorescent blue material, spiro-DPVBi 15-nm. A 10-nm of p-NHT5 material was used as the hole injecting layer (HIL), and 10-nm of a-NPD was used as the hole transporting layer (HTL). To maximize hole’s injection efficiency from anode and to improve electron’s in- jection efficiency from cathode, the energy level diagram of these OLED multilayer systems was examined as presented in Figure 2. The highest occupied molecular orbital (HOMO) levels of the a-NPD, blue fluorescent layer B-Spiro-DPVBi, and NET5 were -2.33, -2.55, and -5.6 eV, respectively, and the lowest unoccupied molecular orbital (LUMO) levels were -5.33, -5.6, and -5.7 eV, respectively.
2.2. Emission spectrum properties of the blue OLED
In this study, the emission spectrum according to the wavelength was first investigated using a 15 nm spiro-DPVBi, which is a fluorescent blue material. Figure 3 shows that the emission spectrum analysis indicates the maximum peak in the 445 nm wavelength band.
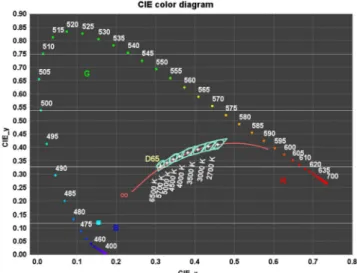
In addition, as a result of the blue color coordinated analysis using CIE1931 to investigate the color purity, we can observe that the blue
400 500 600 700
0.0 0.2 0.4 0.6 0.8 1.0
Normalized Intensity (a.u.)
Wavelength(nm)
Blue OLED
Figure 3. The emission spectrum of blue OLED.
Figure 4. The CIE1934 color diagram of blue OLED.
Figure 5. The schematic diagram of OLED stack with red quantum- dot (R-QD) layer.
color coordinate in the CIE1931 color diagram indicates that Bx is 0.15 and By is 0.12, as shown in Figure 4. In other words, the blue material spiro-DPVBi does not emit a complete deep blue light by itself.
2.3. Process architecture modeling of QD-OLED
Figure 5 shows the schematic diagram of the QD-OLED process ar- chitecture considered for the design of this study. A QD layer is addi- tionally stacked on top of the OLED multi-layers, which is shown in Figure 1. The thin film transistor is located under the OLED mul- ti-layers, and the bottom glass is located as the base layer.
400 500 600 700 0.0
0.2 0.4 0.6 0.8 1.0
Normalized Intensity (a.u.)
Wavelength(nm)
Density 1%
Density 5%
Density 10%
Density 20%
Density 30%
Figure 6. The emission spectrum according to the wavelength with different density of the red quantum dot (R-QD).
2.4. Quantum dot light extraction
The theoretical equation for calculating the external quantum effi- ciency (EQE) of the QD-OLED should be considered according to the following equation. The total EQE represents the product of the effi- ciency of the blue incident light, efficiency of the blue light con- version, and light out-coupling efficiency to the air. Therefore, as ex- pressed in the following equation, we can observe that the overall EQE increases as the blue incident-light and light-conversion efficiencies in- crease[15].
EQE = ηB × ηc × ηout (1)
where ηB is the efficiency of the blue incident light, ηC is the effi- ciency of the blue light conversion in the QD layer, and ηout is the light out-coupling efficiency.
3. Results and Discussion
3.1. Emission spectrum with different R-QD densities
First, the emission spectrum result according to the wavelength was analyzed to determine the R-QD light-conversion efficiency according to the blue incident light. In order to investigate the effect of the QD filling density on the light conversion efficiency, this study analyzed the spectrum after passing the QD according to the incident light by dividing the QD density into five stages: 1, 5, 10, 20 and 30%. The thickness of the QD layer was selected in advance as 10µm through optimal simulation, and detailed investigations were conducted accord- ing to the QD filling density. Figure 6 shows that as the QD density increased from 1 to 20%, the intensity in the blue wavelength band gradually decreased after passing through the QD, and that in the red wavelength band increased. We can observe that when the QD density was 20%, the light leakage in the blue wavelength band according to the blue incident light was very weak and rarely occurred, whereas the intensity in the red wavelength band significantly increased. Therefore, in the OLED structure investigated in this study, it was found that blue light could be effectively blocked when the QD density was at least 20%, and a very sharp red spectrum could be obtained when the QD
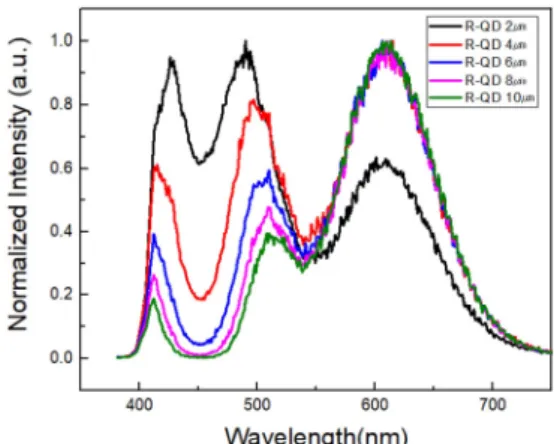
Figure 7. The emission spectrum of blue OLED with different R-QD thickness.
density was 30% or more. In other words, the QD filling density should be increased to at least 20% in order to ensure display characteristics that provide high color purity.
3.2. Emission spectrum with different R-QD thicknesses Figure 7 shows the emission spectrum according to the thiGckness of the R-QD layer containing R-QDs when the R-QD density in the R-QD layer is 10%. As shown in Figure 7, when the thickness of the R-QD layer is 2 µm, it can be seen that the emission spectrum is strong in both the blue and red wavelength bands. This happens be- cause the thickness of the R-QD layer is too thin, so the blue incident light cannot be adequately scattered in the R-QD layer. In other words, it can be seen that a large portion of the blue incident light passes through the R-QD layer and generates blue light leakage, and some of the light is scattered in the R-QD layer, contributing to the intensity of the red emission spectrum. When the thickness of the R-QD layer is increased to 4 µm, the emission spectrum in the blue wavelength band tends to decrease rapidly. However, the emission peak from the blue wavelength band is still large. This tendency shows an improved behavior when the R-QD thickness increases to 6 µm or more and is almost minimized at the 10 µm thickness. However, even at a thick- ness of 10 µm, an emission spectrum due to blue light leakage is still observed in the blue wavelength band. From the CIE1931 color space chromaticity diagram analysis (now shown in this paper) for the R-QD 10 µm thickness also show that the Rx and Ry are 0.530 and 0.450, respectively. It shows a less value than the standard color coordinates, Rx 0.708 and Ry 0.292 for deep red in Rec. 2020 or BT. 2020 that defines various aspects of ultra-high-definition television (UHDTV) with standard dynamic range (SDR) and wide color gamut[16,17]. In other words, it can be seen that it is difficult to completely block blue light leakage by simply increasing the thickness of the R-QD layer. Therefore, it seems necessary to supplement the device structure in order to in- crease the red color quality.
3.3. New device architecture capable of reducing blue light leakage From the result of Figure 7, it can be seen that blue leakage cannot be blocked entirely with only the R-QD layer itself, and thus the red
Figure 8. The schematic diagram of OLED stack with both red quan- tum-dot (R-QD) layer and red color filter (R-CF) layer.
400 500 600 700
0.0 0.2 0.4 0.6 0.8 1.0
Normalized Intensity (a.u.)
Wavelength(nm)
R-CF 1㎛
R-CF 2㎛
R-CF 3㎛
R-CF 5㎛
Figure 9. The emission spectrum according to the wavelength with different thickness of the red color filter (R-CF).
color purity is also low. Therefore, as shown in Figure 8, to com- pletely block blue light leakage and increase red color purity, this study considered the additional layering of a red color filter (R-CF) on top of the R-QD layer to investigate its effect.
3.4. Emission spectrum of R-QD with different R-CF thicknesses In the case where R-CF is applied at the upper part of the R-QD, it is necessary to first analyze the thickness of the CF that is required to completely block the blue-light leakage and ensure only the red spectrum. Therefore, as shown in Figure 9, the spectral influence of the wavelength according to the thickness of the R-CF was investigated.
After the density of the R-QD was fixed at 10%, the CF thickness was systematically split into 1, 2, 3, and 5 µm and analyzed. Figure 9 shows that when the R-CF thickness was 1 µm, a slight light-leakage phenomenon was observed in the blue wavelength band due to the thin thickness of the R-CF. It can be seen that as the thickness increases by more than 2 um, the aforementioned blue light was completely blocked. In addition, we can observe that the full width at half max- imum of the red light with a thickness of 1 µm decreased compared with that at the thickness of 3 µm or more. Thus, the red spectrum becomes very sharp. The CIE1931 color diagram (shown in Figure 10) and the changes shown in the graph of the color coordinate according to the thickness (shown in Figure 11) indicate that as the thickness in- creases from 1 to 3µm, CIE_x moved to the right (increased), and CIE_y moved down (decreased) to a deep red. As a result of the spec- trum analysis at 5µm thickness, it was confirmed that no significant
Figure 10. The CIE1931 color diagram according to the thickness of the red color filter.
R-CF 1㎛ R-CF 2㎛ R-CF 3㎛ R-CF 5㎛
0.30 0.35 0.65 0.70
Rx, Ry
R-CF Thickness(㎛)
Rx Ry
Figure 11. The color coordinate change with the different thickness of the red color filter.
difference existed from the result at 3 µm, showing both Rx and Ry are 0.685, 0.315, respectively. Therefore, we can observe that in order to ensure a high color purity, the thickness of the aforementioned R-CF on the R-QD should be ensured to be at least 3 µm.
4. Conclusion
We have investigated the optimal structure of QD-OLED from the viewpoint of process architecture through emission spectrum analysis based on the wavelength. It was confirmed that the blue light leakage through the QD can be minimized using the by QD filling density above the critical value in the R-QD layer. In addition, a very sharp red spectrum can be obtained by completely blocking the blue light leakage through the R-CF when the R-CF thickness at the upper part of the R-QD is increased by at least to 3 µm. Overall, we can observe that in order to obtain a high red color purity, the blue light must be effectively blocked, and to effectively block the blue light, the QD fill- ing density in the QD layer and the CF thickness above the QD layer
must be increased above the threshold value.
Acknowledgement
This research was supported by Kyungpook National University Research Fund, 2019
References
1. T. Sekitani, H. Nakajima, H. Maeda, T. Fukushima, T. Aida, K.
Hata, and T. Someya, Stretchable active-matrix organic light-emit- ting diode display using printable elastic conductors, Nat. Mater., 8, 494-499 (2009).
2. D. Yin, J. Feng, R. Ma, Y. Liu, Y. Zhang, X. Zhang, Y. Bi, Q.
Chen, and H. Sun, Efficient and mechanically robust stretchable organic light-emitting devices by a laser-programmable buckling process, Nat. Commun., 7, 1-7 (2016).
3. H. Shin, S. Kim, J. Lee, H. Lee, H. Jung, and J. Park, Research trends in organic light emitting diode, Appl. Chem. Eng., 26, 381- 388 (2015).
4. P. Kathirgamanathan, L. M. Bushby, M. Kumaraverl, S.
Ravichandran, and S. Surendrakumar, Electroluminescent organic and quantum dot LEDs: The state of the art, J. Disp. Tech., 11, 480-493 (2015).
5. H. Zhang, Q. Su, and S. Chen, Recent progress in the device ar- chitecture of white quantum-dot light-emitting diodes, J. Inf. Disp., 20, 169-180 (2019).
6. J. Yoo, W. Kim, S. Park, and J. Kim, Study on sonochemical syn- thesis and characterization of CdTe quantum dot, Appl. Chem. Eng., 28, 571-575 (2017).
7. J. Lim, M. Park, W.Bae, D. Lee, S. Lee, C. Lee, K. Char Lim, Highly efficient cadmium-free quantum dot light-emitting diodes enabled by the direct formation of excitons within InP@ZnSeS quantum dots, ACS Nano, 7, 9019-9026 (2013).
8. K. Kim, H. Jung, W. Bae and C. Lee, Effect of solvents and pres- sure on the performance of quantum dot light emitting diodes fab- ricated with soft-contact transfer printing, Soc. Inf. Disp. Dig., 49, 1643-1646 (2018).
9. H. Kim, M. Shin, and Y. Kim, Optical efficiency enhancement in
white organic light-emitting diode display with high color gamut using patterned quantum dot film and long pass filter, Jpn. J. Appl.
Phys., 55, 08RF01 (2016)
10. J. Manders, L. Qian, A. Titov, J. Hyvonen, J. Tokarz-Scott, K. P.
Acharya, Y. Yang, W. Cao, Y. Zheng, J. Xue, and P. H. Holloway, High efficiency and ultra-wide color gamut quantum dot LEDs for next generation displays, J. Soc. Inf. Disp., 23/11, 523-528 (2015) 11. P. Kathirgamanathan, M. Kumaraverl, N. Bramananthan, and S.
Ravichandran, High efficiency and highly saturated red emitting inverted quantum dot devices (QLEDs): Optimisation of their effi- ciencies with low temperature annealed sol-gel derived ZnO as the electron transporter and a novel high mobility hole transporter and thermal annealing of the devices, J. Mater. Chem. C, 6, 11622- 11644 (2018).
12. M. Mesta1, M. Carvelli, R. J. de Vries, H. van Eersel, J. J. M.
van der Holst, M. Schober, M. Furno, B. Lüssem, K. Leo, P.
Loebl, R. Coehoorn and P. A. Bobbert, Molecular-scale simulation of electroluminescence in a multilayer white organic light-emitting diode, Nat. Mater., 12, 652-658 (2013).
13. SETFOS, accessed Nov 15, 2020, https://www.fluxim.com/set- fos-intro.
14. J. J. M. van der Holst, F. W. A. van Oost, R. Coehoorn, and P.
A. Bobbert, Monte carlo study of charge transport in organic sand- wich-type single-carrier devices: Effects of coulomb interactions, Phys. Rev. B, 83, 085206-1-085206-13 (2011).
15. M. Choi, J. Yang, T. Hyeon and D. Kim, Flexible quantum dot light-emitting diodes for next-generation displays, npj Flex. Elec- tron., 10, 1-14 (2018).
16. Rec. 2020, last modified Nov 12, 2020, accessed Nov 30, https://
ko.wikipedia.org/wiki/Rec._2020.
17. S. Choi, S. Kim, J. Oh, and C. Yoon, Display high color gamut fluorescent materials technology, Ceramist, 21, 55-63 (2018).
Authors
Byoung-Seong Jeong; Assistant Professor, Graduate School of Advanced Integration of Science and Technology, Department of Hydrogen and Renewable Energy, Kyungpook National University, Daegu 41566, Republic of Korea; [email protected]