Veterinary Science
http://dx.doi.org/10.4142/jvs.2011.12.4.393
Received: 30 Jun. 2010, Revised: 14 Mar. 2011, Accepted: 11 Jun. 2011
Original Article
*Corresponding author
Tel: +82-2-880-1278; Fax: +82-2-880-8662 E-mail: [email protected]
Assessment of glomerular filtration rate with dynamic computed tomography in normal Beagle dogs
Jinhwa Chang
1, Sujin Kim
2, Joohyun Jung
1, Heechun Lee
3, Hojung Choi
5, Dongwoo Chang
4, Youngwon Lee
5, Junghee Yoon
1, Mincheol Choi
1,*
1
Department of Medical Imaging, College of Veterinary Medicine, and Research Institute for Veterinary Science, Seoul National University, Seoul 151-742, Korea
2
Department of Nuclear Medicine, College of Medicine and Institute of Radiation Medicine, Medical Research Center, Seoul National University, Seoul 110-460, Korea
3
Department of Medical Imaging, College of Veterinary Medicine, Gyeongsang National University, Jinju 600-701, Korea
4
Department of Medical Imaging, College of Veterinary Medicine, Chungbuk National University, Cheongju 361-763, Korea
5
Department of Diagnostic Imaging, College of Veterinary Medicine, Chungnam National University, Daejeon 305-764, Korea
The objective of our study was to determine individual and global glomerular filtration rates (GFRs) using dynamic renal computed tomography (CT) in Beagle dogs.
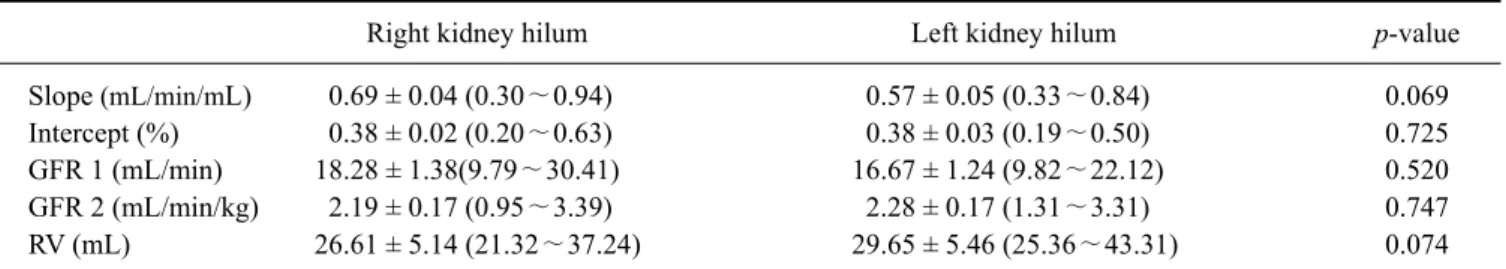
Twenty-four healthy Beagle dogs were included in the experiment. Anesthesia was induced in all dogs by using propofol and isoflurane prior to CT examination. A single slice of the kidney was sequentially scanned after a bolus intravenous injection of contrast material (iohexol, 1 mL/kg, 300 mgI/mL). Time attenuation curves were created and contrast clearance per unit volume was calculated using a Patlak plot analysis. The CT-GFR was then determined based on the conversion of contrast clearance per unit volume to contrast clearance per body weight. At the renal hilum, CT-GFR values per unit renal volume (mL/min/mL) of the right and left kidneys were 0.69 ± 0.04 and 0.57 ± 0.05, respectively. No significant differences were found between the weight-adjusted CT-GFRs in either kidney at the same renal hilum (p = 0.747). The average global GFR was 4.21 ± 0.25 mL/min/kg and the whole kidney GFR was 33.43 ± 9.20 mL/min. CT-GFR techniques could be a practical way to separately measure GFR in each kidney for clinical and research purposes.
Keywords: computed tomography, dog, glomerular filtration rate
Introduction
The glomerular filtration rate (GFR) is an important indicator of renal function, monitoring progression of kidney disease, and the best way to determine an early diagnosis of subclinical renal function [33]. When there is a need to accurately determine GFR, such as when planning chemotherapy strategies with nephrotoxic agents or staging chronic renal disease in preparation for renal replacement, it may be necessary to use direct and accurate methods to measure GFR [19]. In current practice, there has been a general shift from purely anatomical imaging to a combined structural and functional approach. For example, functional computed tomography (CT) imaging of a main organ through dynamic CT scans using contrast media has been reported [8,28]. Other reports have indicated that GFR can be evaluated through advances in CT technology and application of a specific kinetic model [7,8,24]. In addition, GFR is determined by measuring the plasma clearance of a GFR marker that may be an endogenous metabolic product (e.g. urea or creatinine) or an exogenously administered substance [3,27]. Inulin, a 5.2 kDa polymer of fructose, is regarded as a gold standard substance for GFR determination [23]. However, inulin- based determination is a time-consuming chemical analysis and clinical availability may be limited [11]. Since the advent of using inulin for measuring GFR, new methods have been studied. There is an increasing interest in the use of iodinated contrast medium, such as iohexol, as a new alternative marker for estimating GFR in humans and animals [1,3,20].
Recently, it has been possible to simply and rapidly
measure GFR using dynamic CT with a Patlak plot analysis in human and veterinary medicine [1,8,20,28].
Blood clearance per unit renal volume is generally about 0.4∼0.7 mL/min/mL in humans [9,28]. CT-GFR studies have been used to evaluate various diseases affecting renal function [29,30]. However, there are few published reports on the use of CT-GFR in normal dogs including the use of dynamic CT with a Patlak plot to measure CT-GFR in normal dogs and pigs [1,20]. There is also a lack of published reference data on CT-GFR values measured by functional CT in dogs. The purpose of this study was therefore to determine individual and global CT-GFR. We suggest the use of a CT-GFR technique combined triphasic renal imaging by presenting physiologic parameters obtained through aortic and renal time attenuation curves in clinically healthy Beagles.
Materials and Methods Experimental animals
The procedures performed in the present study were approved by the Institute of Laboratory Animal Resources (ILAR) at Seoul National University, Korea. Sixteen intact male and 8 intact female Beagles 1- to 4-years-old (average age, 1.96 ± 1.00 years) and weighing 5.5 to 11.7 kg (average weight, 8.06 ± 1.53 kg) were used for the study.
The dogs were housed individually in ILAR-approved facilities, fed a commercial diet (Jerony; Che-il Jedang, Korea) twice a day, and given water ad libitum.
All dogs were determined to be clinically normal based on physical examination, complete blood counts (CBCs), biochemical and urinalysis profiles, and heartworm antigen test results (Snap; IDEXX Laboratories, USA).
Serum biochemical analyses, including ones that measured sodium, potassium, chloride, calcium, phosphorus, total protein, creatine kinase, blood urea nitrogen (BUN), creatinine, albumin, glucose, alanine aminotransferase, aspartate aminotransferase, alkaline phosphatase, gamma- glutamyl transpeptidase, amylase, and cholesterol, were performed. Using an ultrasound-guided technique, urine was collected from all dogs for urinalysis which included specific gravity measurement by a refractometer (Reichert Vet 360; Reichert, USA), routine dipstick tests (Combostick;
YD Diagnostics, Korea), and sediment and cytologic examinations. General diagnostic imaging techniques using thoracic and abdominal radiography, abdominal ultrasonographic, and echocardiographic examinations were performed on all dogs.
Animal preparation and anesthesia
The animals were fasted for approximately 12 h before anesthesia. CBC was performed to determine hematocrit (HCT) levels before anesthesia. Twenty-two-gauge IV catheters (Becton-Dickinson Korea, Korea) were placed in
the bilateral cephalic veins for propofol (Provive;
Myungmoon Pharm, Korea) and iohexol (Omnipaque; GE Healthcare, USA) administration. No other medications were given before anesthesia induction. After inducing anesthesia with propofol (6 mg/kg, IV administration), the trachea was intubated. Anesthesia was maintained with isoflurane (Forane; Choongwae Pharm, Korea) and oxygen. The oxygen flow rate was 1 L/min, and a 1.5 to 2.0 minimum alveolar concentration of isoflurane was maintained during the CT-GFR study. Heart rate, respiratory rate, and carbon dioxide levels were monitored continuously during anesthesia. Blood pressure was measured directly or indirectly; arterial pressure was directly measured at the dorsal pedal artery or femoral artery. Indirect systolic arterial pressure was determined using a Doppler-based technique (Vet-Dop Doppler; Vmed Technology, USA). Total time spent for CT-GFR assessment was approximately 30 min from the induction of anesthesia until the conclusion of the postcontrast helical scan. The CT-GFR study was performed during a single-slice dynamic scan for 2 min after 15 to 20 min following isoflurane-induced anesthesia.
CT examination
The dogs were placed in a dorsal recumbent position on the CT table, and a CT power injector (LF CT 9000 ADV;
Liebel-Flarsheim, USA) was connected to a cephalic venous cannula to control the injection rate of the contrast medium, iohexol. CT was performed with a GE CT/e (General Electric Medical System, Japan), a single- detector CT scanner. The image acquisition parameters included a helical acquisition and matrix of 512 × 512, and a 25 cm display field of view.
The general renal CT protocols included three steps:
baseline precontrast imaging, single-slice dynamic imaging, and postcontrast imaging. To minimize motion artifacts, obtain excellent image quality, and achieve optimal results, all scans were performed following hyperventilation to induce apnea. Initial precontrast examination of both kidneys and the abdominal aorta was performed using a helical mode with 120 kVp, 50 mA, a 3 mm slice thickness, and a 1.3 pitch. Using this procedure, the exact location of the entire kidney was identified and the region for the dynamic scan was determined.
Single-slice dynamic CT was concurrently initiated with
the beginning of contrast medium injection by using an
automated power-injector and related software; iohexol
(300 mgI/mL) was also administered at a low dosage of
300 mg/kg at the rate of 3 mL/sec. Dynamic CT was
performed in one region (1 mm slice thickness) of the renal
hilum of the kidney every 1.5 sec for 2 min. Following
dynamic CT acquisition, both kidneys were again scanned
entirely to calculate the renal volume using the same scan
parameters as the initial unenhanced CT scan.
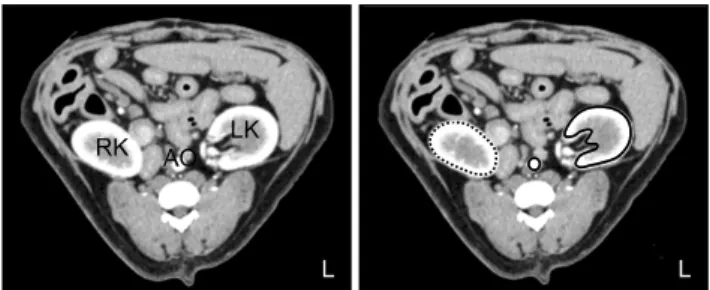
Fig. 1. Dynamic CT images centered in the left renal hilum obtained at maximal aortic enhancement with iohexol. The black circle indicates the aorta, the black line indicates the left kidney, and the dotted line indicates the right kidney. Regions of interest (ROI) are drawn around the aorta as well as left and right kidneys.
Vessels and fatty tissue are excluded from the ROIs. LK: left kidney, RK: right kidney, AO: aorta.
CT-GFR with a Patlak plot analysis
The Patlak plot analysis is a popular tool for estimating blood-to-tissue transfer constants from multiple time uptake data [18].
The basic concept of the Patlak plot is that the amount of contrast media in the nephron is proportional to the integrated concentration of the contrast media in the aorta during the 2 min dynamic CT scan after contrast media administration [8,28]. Q(t) is the contrast mass at time (t) in the circulation, b(t) is the blood concentration at time (t), and α represents the GFR. The mass transferred out of the blood into the renal tubules by time (t) will therefore be
∫
=
tb t dt t
Q ( ) α
0( ) . If this formula is divided by V, the volume of the region of interest (ROI) under consideration, we obtain Q V ( t ) = V α ∫0tb ( t ) dt
. This represents the concent- ration at any time (t) relative to the total concentration in the ROI filtered contrast. For example, C(t) represents the total amount of iodine in a given volume, V; therefore, C(t) = V
× c(t). In this equation, C(t) is the sum of iodine in the renal blood volume B(t) and in the renal glomerular filtrates Q(t).
Therefore, when C(t) = B(t) + Q(t) is divided by V, it
becomes V
t Q V
t B V
t t Q
c ( ) ( ) ( )
)
( = = + . If it substituted with
∫
=
tb t dt V
V t Q
0