Korean Circulation Journal
Introduction
For decades, functional assessment of coronary artery stenosis in the catheterization laboratory has been performed by measuring
Print ISSN 1738-5520 • On-line ISSN 1738-5555
Prediction of Fractional Flow Reserve without Hyperemic Induction Based on Resting Baseline Pd/Pa
Jeong Su Kim, MD
1, Heon Deok Lee
2, Yong Kweon Suh, PhD
2, June Hong Kim, MD
1, Kook Jin Chun, MD
1, Yong Hyun Park, MD
1, Jun Kim, MD
1, Dong Cheul Han, MD
1, and Chang Bae Sohn, MD
11Division of Cardiology, Department of Internal Medicine and Research Institute for Convergence of Biomedical Science and Technology, Pusan National University Yangsan Hospital, Pusan National University School of Medicine, Yangsan,
2Department of Mechanical Engineering, Dong-A University, Busan, Korea
Background and Objectives: The purposes of this study are 1) to investigate the relationship between resting baseline Pd/Pa, determined by the ratio of the pressures proximal (Pa) and distal (Pd) to the target lesion before, inducing hyperemia and fractional flow reserve (FFR) and 2) to identify a resting baseline Pd/Pa range that might reliably preclude the need for hyperemic induction.
Subjects and Methods: A total of 622 pressure wire data sets obtained from intermediate stenotic lesions were analyzed.
Results: There was a good linear relationship between resting baseline Pd/Pa and FFR (r=0.746, p<0.001). Receiver-operating characteristic curves of the resting baseline Pd/Pa with FFR ≤0.80 as the reference variable showed an area under the curve of 0.89 (95% confidence in- tervals 0.863-0.914, p<0.001) with a diagnostic accuracy of 82.3% when the resting baseline Pd/Pa was ≤0.92. These results showed that certain cutoff values can reliably predict FFR, whether positive or negative. The resting baseline Pd/Pa >0.95 (n=257, 41.3%) had a negative predictive value (NPV) of 98.1% and a sensitivity of 97.3%. the resting baseline Pd/Pa ≤0.88 (n=65, 10.5%) had a positive predictive value (PPV) of 96.2% and a specificity of 99.8%. These were consistent regardless of coronary vessel, lesion location, lesion length, or degree of stenosis.
Conclusion: In intermediate lesions, the resting baseline Pd/Pa was linearly related to FFR. A certain range of the resting baseline Pd/Pa val- ues had an excellent NPV with high sensitivity or excellent PPV with high specificity for determining the lesion significance. (Korean Circ J 2013;43:309-315)
KEY WORDS: Cardiovascular physiological phenomana; Fractional flow reserve, myocardial.
Received: December 6, 2012 Revision Received: February 26, 2013 Accepted: March 13, 2013
Correspondence: June Hong Kim, MD, Division of Cardiology, Department of Internal Medicine and Research Institute for Convergence of Biomedi- cal Science and Technology, Pusan National University Yangsan Hospital, Pusan National University School of Medicine, 20 Geumo-ro, Mulgeum- eup, Yangsan 626-770, Korea
Tel: 82-55-360-1459, Fax: 82-55-360-2204 E-mail: [email protected]
• The authors have no financial conflicts of interest.
This is an Open Access article distributed under the terms of the Creative Commons Attribution Non-Commercial License (http://creativecommons.
org/licenses/by-nc/3.0) which permits unrestricted non-commercial use, distribution, and reproduction in any medium, provided the original work is properly cited.
the coronary flow reserve and/or fractional flow reserve (FFR).1) In contemporary guidelines, FFR is the most widely used index as a surrogate test for the detection of myocardial ischemia.2) However, the utility of the pressure wire remains low due to several limitations in measuring FFR, most notably the high cost, laboriousness of this manual procedure, and possible adverse systemic effects of adenos- ine administration, such as bradyarrhythmia, chest pain, or bron- chospasm.3) FFR is determined by the ratio of the pressures proxi- mal (Pa) and distal (Pd) to the target lesion under maximal hypere- mia.4) The pressure gradient across the stenotic lesion becomes greater as blood flow across the lesion increases during induction of hyperemia (flow augmentation). We have studied this pressure ch- ange across the stenotic lesion in response to flow augmentation, while investigating the relationship between the resting baseline Pd/
Pa and FFR.5) Based on this relationship, we also determined the re- sting baseline Pd/Pa range that might reliably preclude the necessity for induction of hyperemia to determine the functional significance of the lesion.
Subjects and Methods
Patient population
We retrospectively investigated a total of 622 pressure wire data sets from 452 patients obtained during routine clinical practice at the Cardiovascular Center at Pusan National University Yangsan Hospi- tal (Yangsan, Korea), from December 2008 through November 2011.
We excluded pressure wire data for infarction-affected arteries or for the resting baseline Pd/Pa ≤0.80, and cases of minimal diameter stenosis assessed by subsequent quantitative coronary angiography (QCA) analysis. This study was approved by the Institutional Review Board of Pusan National University Yangsan Hospital.
Coronary angiography and pressure measurements
Invasive conventional coronary angiography was performed by st- andard techniques using either a transradial or transfemoral appro- ach. At least four views of the left and two views of the right coro- nary arteries were obtained. Intermediate coronary artery stenosis was defined as a diameter stenosis of 40-70% by visual estimation by two expert interventional cardiologists. A physiological study was also performed to assess the intermediate stenotic lesions, using a pressure wire (Radi Medical Systems, St. Jude Medical, Inc., USA).
Hemodynamic measurements, including heart rate and aortic blood pressure, and the ratio of differential pressure at the aorta and distal to the stenosis were recorded continuously and stored throughout all phases of the study. Maximal hyperemia was induced by continu- ous intravenous infusion (140 μg/kg/min) of adenosine through the large forearm (antecubital) vein, following a standard protocol. We did not get the pullback data for the resting baseline Pd/Pa. Lesions with FFR ≤0.8 were considered functionally significant. Coronary angiograms were analyzed using QCA software (QantCor, QCA, Pie Medical Imaging, Maastricht, the Netherlands) by cardiologists who were blinded to the data of pressure wire study.
Statistical analysis
All statistical analyses were performed using Statistical Package for the Social Sciences software version 15.0 for Windows (IBM Corp.
Armonk, NY, USA), and MedCalc software version 11.4 (MedCalc®, Mariakerke, Belgium). Continuous variables are expressed as the mean±standard deviation and categorical variables as frequencies (N) and percentages (%). Pearson’s correlation coefficient (r) was used to assess the relationship between the resting baseline Pd/Pa and FFR. Receiver-operating characteristic (ROC) area under the curve (AUC) analysis was used to estimate the diagnostic perform- ance of resting baseline Pd/Pa and to identify the appropriate cut- off value compared with the FFR threshold of 0.8. Sensitivity, spec- ificity, negative predictive value (NPV), and positive predictive value
(PPV) with corresponding 95% confidence intervals (CI) were cal- culated. Subgroup analyses were also performed according to the diseased vessel {left anterior descending artery (LAD), left circum- flex artery (LCx), or right coronary artery (RCA)}, lesion location (pro- ximal or mid-to-distal), lesion length (<20 mm or ≥20 mm) and di- ameter stenosis by QCA (<50% or ≥50%).
Results
Patient demographics and angiographic data
A total of 622 pressure wire data sets from 452 patients were an- Table 1. Patient demographic and angiographic lesion data (452 patients, 622 lesions)
Variables
Age (years, n=452) 63.0±9.9
Mean blood pressure (n=452)
Baseline (mm Hg) 102.5±15.7
After hyperemia (mm Hg) 93.6±15.6
Heart rate (n=452)
Baseline (beats/min) 71.6±13.8
After hyperemia (beats/min) 75.5±13.8
Male (n=452) (%) 323 (71.5)
Clinical diagnosis (n=452) (%)
Stable angina 223 (49.3)
Unstable angina 122 (27.0)
Myocardial infarction* 64 (14.2)
Others 43 (9.5)
Coronary artery (n=622) (%)
Left main coronary artery 13 (2.1)
Left anterior descending artery 332 (53.4)
Left circumflex artery 127 (20.4)
Right coronary artery 150 (24.1)
Quantitative coronary angiography data (n=622)
Reference vessel diameter (mm) 3.22±0.61
2.5-2.99 (%) 263 (42.3)
3.0-3.49 (%) 186 (29.9)
3.5-3.99 (%) 96 (15.4)
≥4.0 (%) 77 (12.4)
Lesion length (mm) 26.0±12.8
<10 (%) 36 (5.8)
10-19.99 (%) 193 (31.0)
≥20 (%) 393 (63.2)
Diameter stenosis (%) 54.0±8.0
40-49 203 (32.6)
50-59 284 (45.7)
60-69 116 (18.6)
70-79 19 (3.1)
Values are n (%) or mean±SD. *Studied at non-infarct related coronary artery
alyzed retrospectively. The resting baseline characteristics of pa- tients are presented in Table 1. The mean age was 63.0±9.9 years, and 323 patients (71.5%) were men. One hundred twenty-two pa- tients (27.0%) had diabetes mellitus, 207 patients (45.8%) had hy- pertension, 102 patients (22.6%) had dyslipidemia, and 134 patients (29.6%) were current or former smokers. Patients had been referred for coronary angiography for stable angina (49.3%), unstable angina (27.0%), myocardial infarction (14.2%), or other reasons (9.5%), in- cluding atypical chest pain, silent ischemia, syncope, or structural heart disease. The target vessels were the left main coronary artery in 13 (2.5%) cases, LAD in 332 (53.4%) cases, LCx in 127 (20.4%) cas- es, and RCA in 150 (24.1%) cases. QCA results are also presented in Table 1. The mean diameter stenosis was 54.0±8.0% and the mean lesion length was 26.0±12.8 mm.
Relationship between resting baseline Pd/Pa and fractional flow reserve
The range of resting baseline Pd/Pa values was 0.81 to 1.0, and the range of FFR values was 0.47 to 1.0. Based on the established FFR cut- off threshold of 0.8 to define a positive result, 183 of 622 (29.4%) lesions were considered functionally significant (positive) and 439 of
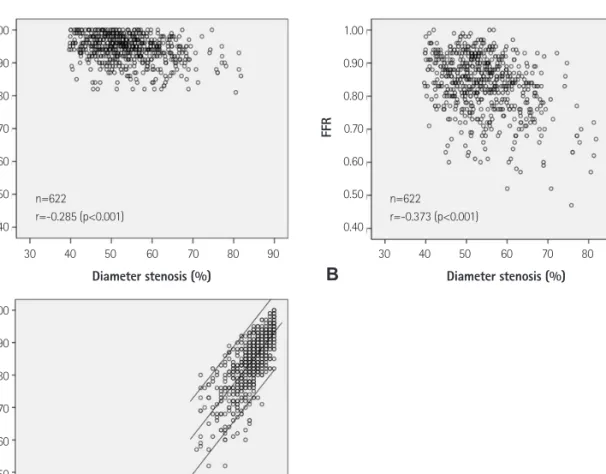
622 (70.6%) lesions were considered functionally non-significant (negative). Pearson’s correlation analysis between the resting base- line Pd/Pa and diameter stenosis, as well as between FFR and diame- ter stenosis showed poor linear relationships in terms of its strength:
r=-0.285 between the resting baseline Pd/Pa and diameter stenosis (p<0.001) (Fig. 1A), and r=-0.373 between FFR and diameter stenosis (p<0.001) (Fig. 1B). By contrast, there was a good linear relationship between the resting baseline Pd/Pa and FFR (r=0.746, p<0.001) (Fig. 1C).
The ROC curve for the resting baseline Pd/Pa, using an FFR ≤0.80 as the reference standard variable showed an AUC of 0.89 (95% CI=
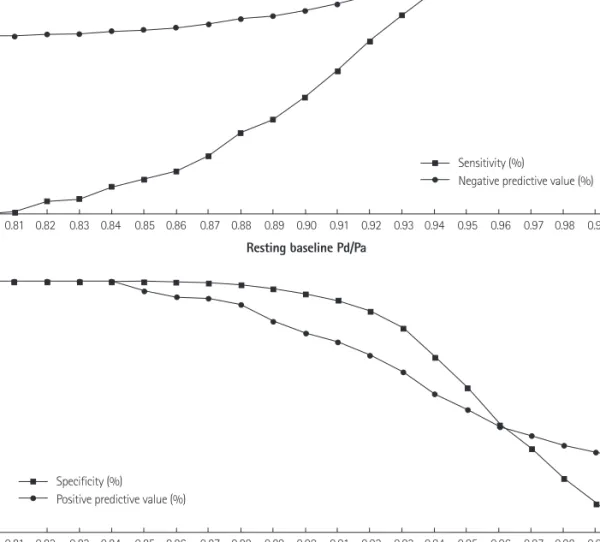
0.863-0.914, p<0.001). The resting baseline Pd/Pa ≤0.92 was asso- ciated with the greatest diagnostic accuracy (82.3%) for the predic- tion of FFR, whether positive or negative (Fig. 2, Table 2). Examining the diagnostic test performances according to the value for the rest- ing baseline Pd/Pa more closely, we found two arbitrary points for the resting baseline Pd/Pa. At one point, the sensitivity and NPV be- gan to decrease simultaneously and at the other point, the specifici- ty and PPV began to descend simultaneously (Fig. 3). These patterns indicated that the resting baseline Pd/Pa >0.95 had >97% sensitivi- ty and >98% NPV, and that the resting baseline Pd/Pa ≤0.88 had
>98% specificity and >90% PPV.
Fig. 1. Scatter plots. A: scatter plots of diameter stenosis versus the resting baseline Pd/Pa (n=622, r=-0.285, p<0.001). B: scatter plots of diameter stenosis vs. FFR (n=622, r=-0.373, p<0.001). C: scatter plots of the resting baseline Pd/Pa vs. FFR (n=622, r=0.746, p<0.001). A single dot may represent many iden- tical pressure wire data points. FFR: fractional flow reserve, r: Pearson’s correlation coefficient.
1.00 0.90 0.80 0.70 0.60 0.50 0.40
1.00 0.90 0.80 0.70 0.60 0.50 0.40
Diameter stenosis (%)
Baseline Pd/Pa
Baseline Pd/PaFFR
30 40 50 60 70 80 90
0.40 0.50 0.60 0.70 0.80 0.90 1.00 n=622
r=-0.285 (p<0.001)
n=622 r=0.746 (p<0.001)
1.00 0.90 0.80 0.70 0.60 0.50 0.40
Diameter stenosis (%)
FFR
30 40 50 60 70 80 90 n=622
r=-0.373 (p<0.001)
A B
C
When the resting baseline Pd/Pa was >0.95, as was the case in 257 of 622 (41.3%) data sets, sensitivity was 97.3% (95% CI=93.7- 99.1%), NPV was 98.1% (95% CI=95.5-99.4%), specificity was 57.4%
(95% CI=52.6-62.1%), and PPV was 48.8% (95% CI=43.5-54.0%).
In the subgroup analysis, the sensitivity and NPV were consistently high, regardless of the diseased vessel (LAD or LCx/RCA), lesion loc- ation (proximal or mid-to-distal), lesion length (≤20 mm or >20 mm), or diameter stenosis (<50% or ≥50%) (Table 3-1).
When the resting baseline Pd/Pa was ≤0.88, which was the case in 65 of 622 (10.5%) data sets, specificity was 98.6% (95% CI=
97.0-99.5%), PPV was 90.8% (95% CI=81.0-96.5%), sensitivity was 32.2% (95% CI=25.5-39.5%), and NPV was 77.7% (95% CI=74.1- 81.1%). In the subgroup analysis, the specificity and PPV were con- sistently high, regardless of the diseased vessel (LAD or LCx/RCA), le-
sion location (proximal or mid-to-distal), lesion length (≤20 mm or
>20 mm), or diameter stenosis (<50% or ≥50%) (Table 3-2).
Discussion
Our study demonstrated that there is a range of the resting base- line Pd/Pa values that may reliably predict FFR guided lesion signific- ance before the induction of hyperemia in company with a good cor- relation between the resting baseline Pd/Pa and FFR (r=0.746, p<
0.001) (Fig. 1C).
The concept of an instantaneous wave-free ratio (iFR) introduc- ed recently by the authors of the ADVISE study has attracted inter- est.6) However, this drug-free index of stenosis severity correlates weakly with FFR and seems not to be independent of hyperemia. In Fig. 2. Receiver operating characteristic area under the curve (AUC) of the resting baseline Pd/Pa values, using FFR ≤0.80 as the reference standard vari- able. A: all vessels (AUC 0.89, n=662). B: left anterior descending artery (LAD; AUC 0.85, n=332). C: right coronary artery (RCA; AUC 0.93, n=150). D: left circumflex artery (LCx; AUC 0.84, n=127). FFR: fractional flow reserve.
100
80
60
40
20
0
100-specificity
Sensitivity
0 20 40 60 80 100 Resting baseline Pd/Pa (all vessel)
AUC 0.89 (n=622)
≤0.92
Diagnostic accuracy 82.3%
A
100
80
60
40
20
0
100-specificity
Sensitivity
0 20 40 60 80 100 Resting baseline Pd/Pa (LAD)
AUC 0.85 (n=332)
≤0.92
Diagnostic accuracy 77.7%
B
100
80
60
40
20
0
100-specificity
Sensitivity
0 20 40 60 80 100 Resting baseline Pd/Pa (RCA)
AUC 0.93 (n=150)
≤0.93
Diagnostic accuracy 85.3%
C
100
80
60
40
20
0
100-specificity
Sensitivity
0 20 40 60 80 100 Resting baseline Pd/Pa (LCx)
AUC 0.94 (n=127)
≤0.91
Diagnostic accuracy 89.8%
D
the VERIFY study by Berry et al.7) the diagnostic accuracy of an iFR value ≤0.80 was only 60% for all vessels, compared with the FFR cutoff value of ≤0.80. The resting baseline Pd/Pa has similar limit- ations to iFR. The resting baseline Pd/Pa can change under various situations. Different degrees of stenosis with identical resting ba- seline Pd/Pa can generate completely different FFR values. In our study, the diagnostic accuracy of the resting baseline Pd/Pa was 82.3% at best when used with the FFR cutoff value of ≤0.80. This suggests that the diagnostic accuracy is not high enough to justify skipping hyperemic induction for FFR measurement (Fig. 2). In par- ticular, the diagnostic accuracy of the resting baseline Pd/Pa of 0.89- 0.95 was very poor, and this range might have limited clinical use- fulness. By contrast, when we examined more closely of the NPV and PPV of the resting baseline Pd/Pa together with their corresp- onding sensitivity or specificity simultaneously, the resting baseline Pd/Pa >0.95 or ≤0.88 appeared to be reliable points that predicted negative or positive FFR without losing its accurate diagnostic per- formances (Fig. 3).
We noted that about half of the cases of angiographically inter- mediate lesions had resting baseline Pd/Pa >0.95 (n=257, 41.3%) or ≤0.88 (n=65, 10.5%). These two cutoff values were not depen- dent on the vessel territory (LAD vs. non-LAD), lesion location (pro- ximal vs. mid-to-distal), lesion length (short vs. long), or diameter st- enosis (<50% vs. ≥50%). Our study result is similar to that of Mamas et al.8) who found a strong correlation between the resting Pd/Pa and FFR and a similar cutoff value for the resting baseline Pd/Pa
(resting Pd/Pa ≥0.96 or ≤0.87). However, their study contained all of the consecutive pressure wire data, including tight or minimal stenotic lesions, which comprised about one-third of all cases, and did not demonstrate sensitivity, specificity, and predictive values for every decimal point of the resting baseline Pd/Pa measured simul- taneously.
During FFR studies, pharmacologic vasodilation is essential for as- sessing the severity of stenosis, and adenosine is the most com- monly used agent for inducing hyperemia. Although most patients feel chest discomfort or breathlessness during adenosine infusion, these side effects are short lived and well tolerated. Quite harmful or life-threatening systemic adverse reactions happen very rarely, and the only absolute contraindication for adenosine is severe bronchial asthma. As in previous studies,9)10) we failed to induce hyperemia using adenosine in a small number of patients (less than 1% of our accumulated data over the past 5 years) because of the unexpected bronchospasm, profound chest pain and atrioventricular conduction block. In such patients, other vasodilators, such as nicorandil, can be used safely and efficiently as the hyperemic agent for FFR mea- surements.12) However, some interventional cardiologists may still feel some pressure for using adenosine for the FFR study.
Our study has several limitations. First, our data were obtained from a single hospital center. However, we analyzed 622 pressure wire data sets from 452 patients and ensured that the volume of our data was quantitatively sufficient to get good quality results.
Second, we routinely induced hyperemia using adenosine through Table 2. Criterion values and coordinates of the receiver operating characteristic curve
Criterion Sensitivity (%) Specificity (%) PPV (%) NPV (%) Diagnostic accuracy (%)
<0.81 - 100 - 70.6 70.6
≤0.84 10.9 100 100 72.9 73.8
≤0.85 13.7 99.8 96.2 73.5 74.5
≤0.86 16.9 99.5 93.9 74.2 75.2
≤0.87 23.0 99.3 93.3 75.6 76.9
≤0.88 32.2 98.6 90.8 77.7 79.1
≤0.89 37.7 97.0 84.1 78.9 79.6
≤0.90 46.5 95.0 79.4 81.0 80.7
≤0.91 56.8 92.5 75.9 83.7 82.0
≤0.92* 68.9 87.9 70.4 87.1 82.3*
≤0.93 79.2 81.3 63.9 90.4 80.7
≤0.94 89.1 69.7 55.1 93.9 75.4
≤0.95 97.3 57.4 48.8 98.1 68.9
≤0.96 98.4 42.6 41.7 98.4 59.2
≤0.97 100 33.3 38.4 100 -
≤1.00 100 0 29.4 - -
*Resting baseline Pd/Pa ≤92 was associated with the greatest diagnostic accuracy (82.3%) for the prediction of FFR, whether positive or negative. NPV:
negative predictive value, PPV: positive predictive value, FFR: fractional flow reserve
the forearm (antecubital) vein, and not through the central (femoral) vein. In the study by Lindstaedt et al.,13) this method was slightly less effective than that of femoral vein infusion. However, recent studies by De Bruyne et al.14) and Seo et al.15) have shown that hyperemic ef- ficacy of adenosine does not differ between infusion into the central vein and peripheral vein. Third, this study was performed in Korean patients with relatively low body mass index, and these results might not be directly applicable to patients with a large body mass
index in Western populations.
In conclusion, the resting baseline Pd/Pa had good linear relation- ship with FFR in the intermediate lesions. A certain range of the resting baseline Pd/Pa values had an excellent NPV and sensitivity (resting baseline Pd/Pa >0.95) or PPV and specificity (resting base- line Pd/Pa ≤0.88) for determining lesion significance. These results might help the clinician predict the significance of the lesion with- out the need for inducing hyperemia to examine angiographically Table 3-1. Subgroup analysis results for resting baseline Pd/Pa >0.95
Diseased vessel* Lesion location* Lesion length (mm) Diameter stenosis
LAD (n=332)
LCx or RCA (n=277)
Proximal (n=266)
Mid-to-distal (n=343)
<20 mm (n=229)
≥20 mm (n=393)
<50%
(n=224)
≥50%
(n=398) Sensitivity (%) 99.2 (95.5-100) 94.8 (85.6-98.9) 98.9 (93.8-100) 96.7 (90.8-99.3) 95.8 (85.7-99.5) 97.8 (93.6-99.5) 95.7 (85.5-99.5) 97.8 (93.7-99.5) Specificity (%) 37.0 (30.4-43.9) 76.7 (70.5-82.1) 56.4 (48.8-63.8) 57.8 (51.4-64.0) 56.9 (49.4-64.2) 57.8 (51.5-63.9) 62.2 (54.6-69.3) 54.2 (48.0-60.3) PPV (%) 39.6 (33.4-46.0) 62.9 (53.7-71.5) 48.6 (40.6-56.6) 48.8 (41.7-56.0) 48.1 (39.4-56.9) 49.1 (42.5-55.8) 51.3 (42.1-60.5) 47.1 (40.7-53.6) NPV (%) 99.1 (94.1-100) 97.3 (93.3-99.2) 99.2 (95.0-100) 97.7 (93.7-99.5) 97.0 (91.3-99.4) 98.4 (95.1-99.7) 97.2 (91.8-99.5) 98.3 (94.8-99.7)
*13 pressure wire studies for left main coronary artery were excluded. LAD: left anterior descending artery, LCx: left circumflex artery, NPV: negative predic- tive value, PPV: positive predictive value, RCA: right coronary artery
Fig. 3. Diagnostic test performances according to the resting baseline Pd/Pa. When the resting baseline Pd/Pa was >0.95, sensitivity was 97.3% (95%
CI=93.7-99.1%) and negative predictive value was 98.1% (95% CI=95.5-99.4%). When the resting baseline Pd/Pa was ≤0.88, specificity was 98.6% (95%
CI=97.0-99.5%) and positive predictive value was 90.8% (95% CI=81.0-96.5%). CI: confidence intervals.
100 90 80 70 60 50 40 30 20 10 0
100 90 80 70 60 50 40 30 20 10 0
Resting baseline Pd/Pa
Resting baseline Pd/Pa
0.80 0.81 0.82 0.83 0.84 0.85 0.86 0.87 0.88 0.89 0.90 0.91 0.92 0.93 0.94 0.95 0.96 0.97 0.98 0.99 1.00
0.80 0.81 0.82 0.83 0.84 0.85 0.86 0.87 0.88 0.89 0.90 0.91 0.92 0.93 0.94 0.95 0.96 0.97 0.98 0.99 1.00 Sensitivity (%)
Negative predictive value (%)
Specificity (%)
Positive predictive value (%)
intermediate stenotic lesions. We hope that, by overcoming the per- ceived difficulties of assessing FFR, our study will facilitate wider use of the pressure wire for the purpose of increasing physiology- guided revascularization and consequent reduction of unnecessary percutaneous coronary intervention.
Acknowledgments
This study was supported by a Medical Research Institute Grant (2012), Pusan National University Yangsan Hospital.
References
1. Tobis J, Azarbal B, Slavin L. Assessment of intermediate severity coro- nary lesions in the catheterization laboratory. J Am Coll Cardiol 2007;
49:839-48.
2. Levine GN, Bates ER, Blankenship JC, et al. 2011 ACCF/AHA/SCAI Guide- line for Percutaneous Coronary Intervention: a report of the American College of Cardiology Foundation/American Heart Association Task Force on Practice Guidelines and the Society for Cardiovascular Angi- ography and Interventions. Circulation 2011;124:e574-651.
3. Task Force on Myocardial Revascularization of the European Society of Cardiology (ESC) and the European Association for Cardio-Thoracic Surgery (EACTS); European Association for Percutaneous Cardiovascu- lar Interventions (EAPCI), Wijns W, et al. Guidelines on myocardial re- vascularization. Eur Heart J 2010;31:2501-55.
4. Pijls NH, van Son JA, Kirkeeide RL, De Bruyne B, Gould KL. Experimental basis of determining maximum coronary, myocardial, and collateral blood flow by pressure measurements for assessing functional stenosis severity before and after percutaneous transluminal coronary angio- plasty. Circulation 1993;87:1354-67.
5. Kim JH, Park JH, Choo K, et al. Pressure-wire based assessment of mi- crovascular resistance using calibrated upstream balloon obstruction:
a predictor of myocardial viability. Catheter Cardiovasc Interv 2012;80:
581-9.
6. Sen S, Escaned J, Malik IS, et al. Development and validation of a new
adenosine-independent index of stenosis severity from coronary wave- intensity analysis: results of the ADVISE (ADenosine Vasodilator Inde- pendent Stenosis Evaluation) study. J Am Coll Cardiol 2012;59:1392- 402.
7. Berry C, van‘t Veer M, Witt N, et al. VERIFY (VERification of Instanta- neous Wave-Free Ratio and Fractional Flow Reserve for the Assess- ment of Coronary Artery Stenosis Severity in EverydaY Practice): A Multicenter Study in Consecutive Patients. J Am Coll Cardiol 2013;61:
1421-7.
8. Mamas MA, Horner S, Welch E, et al. Resting Pd/Pa measured with in- tracoronary pressure wire strongly predicts fractional flow reserve. J Invasive Cardiol 2010;22:260-5.
9. Tonino PA, De Bruyne B, Pijls NH, et al. Fractional flow reserve versus angiography for guiding percutaneous coronary intervention. N Engl J Med 2009;360:213-24.
10. De Bruyne B, Pijls NH, Kalesan B, et al. Fractional flow reserve-guided PCI versus medical therapy in stable coronary disease. N Engl J Med 2012;367:991-1001.
11. Jung HO, Seung KB, Kim PJ, et al. Comparison between nicorandil and adenosine in the measurement of coronary flow reserve using a Dop- pler guide wire. Korean Circ J 2002;32:391-7.
12. Jang HJ, Koo BK, Lee HS, et al. Safety and efficacy of a novel hyperae- mic agent, intracoronary nicorandil, for invasive physiological assess- ments in the cardiac catheterization laboratory. Eur Heart J 2013. [Epub ahead of print]
13. Lindstaedt M, Bojara W, Holland-Letz T, et al. Adenosine-induced maxi- mal coronary hyperemia for myocardial fractional flow reserve mea- surements: comparison of administration by femoral venous versus antecubital venous access. Clin Res Cardiol 2009;98:717-23.
14. De Bruyne B, Pijls NH, Barbato E, et al. Intracoronary and intravenous adenosine 5’-triphosphate, adenosine, papaverine, and contrast medi- um to assess fractional flow reserve in humans. Circulation 2003;107:
1877-83.
15. Seo MK, Koo BK, Kim JH, et al. Comparison of hyperemic efficacy be- tween central and peripheral venous adenosine infusion for fractional flow reserve measurement. Circ Cardiovasc Interv 2012;5:401-5.
Table 3-2. Subgroup analysis results for resting baseline Pd/Pa ≤0.88
Diseased vessel* Lesion location* Lesion length (mm) Diameter stenosis
LAD (n=332)
LCx or RCA (n=277)
Proximal (n=266)
Mid-to-distal (n=343)
<20 mm (n=229)
≥20 mm (n=393)
<50%
(n=224)
≥50%
(n=398) Sensitivity (%) 33.9 (25.5-43.0) 31.0 (19.5-44.5) 32.2 (22.6-43.1) 33.7 (24.2-44.3) 33.3 (20.4-48.4) 31.9 (24.1-40.4) 27.7 (15.6-42.6) 33.8 (25.9-42.4) Specificity (%) 97.6 (94.6-99.2) 99.5 (97.5-100) 97.2 (93.6-99.1) 99.6 (97.8-100) 97.8 (94.4-99.4) 99.2 (97.2-99.9) 99.4 (96.9-100) 98.1 (95.6-99.4) PPV (%) 85.6 (70.4-94.9) 96.6 (81.0-99.9) 82.8 (64.6-94.0) 97.2 (85.0-99.9) 86.3 (67.1-96.5) 94.5 (81.9-99.3) 95.3 (74.8-99.9) 88.1 (74.7-95.9) NPV (%) 78.0 (72.8-82.6) 77.6 (71.9-82.6) 77.5 (71.6-82.6) 78.3 (73.2-82.8) 77.9 (71.5-83.4) 77.7 (73.0-82.0) 76.7 (70.3-82.3) 78.1 (73.4-82.3)
*13 pressure wire studies for left main coronary artery were excluded. LAD: left anterior descending artery, LCx: left circumflex artery, NPV: negative predic- tive value, PPV: positive predictive value, RCA: right coronary artery