A Ankle MRI for Anterolateral Soft TissueImpingement: Increased Accuracy withthe Use of Contrast-Enhanced Fat-Suppressed 3D-FSPGR MRI
7
0
0
전체 글
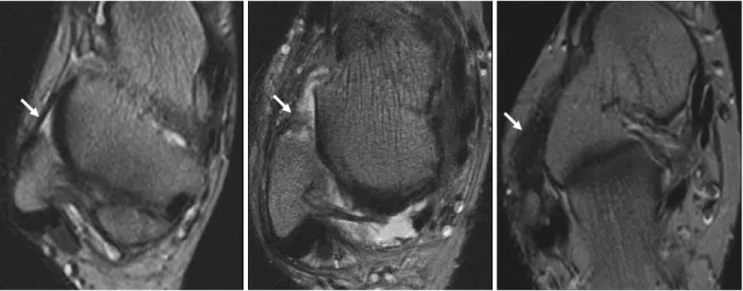
(2) Choo et al.. ment (15). However, in this previous study, further validation was needed, as the original sample size of the study population was small, particularly for the use of the method with soft tissue impingement. Additionally, there was no comparison with the use of routine MRI. This study was designed to determine retrospectively the effectiveness of the use of CE fat-suppressed 3D-FSPGR MRI in the diagnosis of anterolateral soft tissue impingement of the ankle as compared to the use of routine MRI in a large patient population.. MATERIALS AND METHODS Patient Population Between December 2002 and May 2006, ankle CE MR scans were performed on 1,170 patients at our institute. Among the patients, 45 patients (32 men and 13 women) who had arthroscopically proved anterolateral impingement were enrolled. The mean age of these patients was 34 years, ranging from 17 to 68 years. During this same period, 45 consecutive control patients (32 men and 13 women) also underwent MRI examinations before surgery, including arthroscopy, for surgically documented diagnoses other than anterolateral soft tissue impingement. Twentyeight of these patients had an impingement syndrome at the other ankle recesses, 23 patients had osteochondral lesions, 13 patients had loose bodies within the ankle, eight patients had syndesmotic injuries, and one patient had a tear of the anterior talofibular ligament. The mean age of. the control patients was 30 years, ranging from 15 to 64 years. Patients with a history of prior surgery, known fractures, or inflammatory or infectious arthritis were excluded from the study. Written informed consent was obtained from all patients prior to imaging, and our institutional review board approved the study. For all 90 cases, an expert arthroscopic orthopedic surgeon conducted a clinical evaluation, including a medical history and physical examination. The clinical parameters included patient demographic data and the interval from the preoperative MRI examination to arthroscopy. As described previously (15), anterolateral soft tissue impingement was characterized as synovitis and abnormal reactive tissues occupying space within the capsular reflection that corresponded to the injured and painful site of the anterolateral gutter, regardless of the presence of other traumatic ankle lesions. The other traumatic ankle lesions included osteochondral lesions, soft tissue impingements other than at the anterolateral gutter, syndesmotic injury and intra-articular loose bodies. MRI MRI was performed on a 1.5-T imager (Horizon; General Electric Medical Systems, Milwaukee, WI) with a dedicated extremity coil. Supine patients were examined with the ankle placed in the neutral position. For each patient, we acquired routine MRI and fat suppressed 3D-FSPGR MRI images with and without contrast enhancement. This was a. A B C Fig. 1. Imaging findings of normal anterolateral recess of ankle and soft tissue impingement at anterolateral recess of ankle as depicted by use of routine MR. Images are transverse T2-weighted (TR/TE of 2000/20/70, 256 × 256 matrix, 1 NEX [number of excitatid], FOV [field of view] of 12 cm) spin echo MRI, taken approximately at level of malleolar fossa. A. Normal anterolateral recesses were defined as clear anterolateral recesses of ankle without thickened anterior talofibular ligament (arrow). B, C. Anterolateral soft tissue impingement of ankle was defined as filling of anterolateral gutter with soft tissue (B), fuzzy and marked thickening of anterior talofibular ligament (C).. 410. Korean J Radiol 9(5), October 2008.
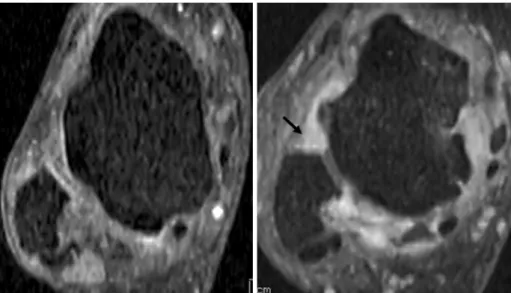
(3) Contrast-Enhanced Fat-Suppressed 3D-FSPGR Ankle MR Imaging for Anterolateral Soft Tissue Impingement. routine protocol for ankle MRI in our practice. Routine MRI was comprised of a) axial T1-weighted SE (spin echo) images (TR/TE, 700/11 msec; matrix, 256 × 256; number of acquisitions, one; field of view, 12 cm; imaging time, 2 minutes 29 seconds), b) axial intermediateand T2-weighted SE images (TR/TE1/TE2 of 2000/20/70 msec; matrix, 256 × 256; number of acquisitions, one; field of view, 12 cm; imaging time, 6 minutes 48 seconds) and c) coronal intermediate- and T2-weighted SE images (TR/TE1/TE2 of 2000/20/70 msec; matrix, 256 × 256; number of acquisitions, one; field of view, 12 cm; imaging time, 6 minutes 48 seconds). The thickness of routine MRI slices was 4 mm with no gap. Intravenous CE fat-suppressed 3D-FSPGR MRI (TR/TE 20.9/2.2 msec, flip angle 15°; matrix, 256 × 192; number of acquisitions, one; field of view, 12 cm) was obtained on the coronal plane. A 9 cm thick slab was partitioned into 60 sections, resulting in 1.5 mm sections. For gadoliniumenhanced dynamic MR imaging, either gadopentetate dimeglumine (Magnevist; Schering, Berlin, Germany) or gadodiamide (Omniscan; Nycomed Amersham, Oslo, Norway) was injected as a rapid bolus by hand injection at a dose of 0.1 mmol/kg and was immediately followed by a 10-20 mL saline flush. This sequence was acquired in 4 minutes and 22 seconds. Image Analysis Retrospectively, two musculoskeletal radiologists, who were blinded to the patient data, clinical history, and arthroscopic results, independently reviewed the two sets of MRI images in a random order. The interpretation of the routine MR images and CE fat-suppressed 3D-FSPGR images was performed separately. The interval between the two reviewing sessions was at least two weeks for both. readers. The CE fat-suppressed 3D-FSPGR images and its multiplanar reformatted images, postprocessed with the use of 3D reconstruction software (AW Workstation; General Electric Medical Systems) were reviewed in a workstation. Each observer recorded the presence of anterolateral soft tissue impingement using a five-point confidence rating score for each lesion; 1 equals “no lesion,” 2 equals “probably not a lesion,” 3 equals “an equivocal lesion,” 4 equals “a probable lesion” and 5 equals “a definite lesion.” The features suggesting anterolateral soft tissue impingement as depicted on routine MRI were soft tissue fullness at the anterolateral gutter of the ankle or fuzzy and marked-thickening of the anterior talofibular ligament (Fig. 1). In contrast, the feature suggesting anterolateral soft tissue impingement as depicted on CE fat-suppressed 3D-FSPGR MRI was focal nodular or irregular thick enhancement in the anterolateral recess (Fig. 2). Statistical Analysis An alternative free response receiver operating characteristic (ROC) curve was fitted to the confidence ratings of each reader using a maximum-likelihood estimation (ROCKIT 0.9B; Metz CE, University of Chicago, Chicago, IL 1998). The performance of each observer in characterizing anterolateral soft tissue impingement of the ankle was assessed using the area (Az) under the ROC curve. The difference between the areas under the ROC curves was determined by the use of a univariate z-score test. In order to compare clinical characteristics and arthroscopic results between patients with anterolateral soft tissue impingement and controls, continuous variables (e.g. age) were analyzed using the Mann-Whitney U test, while categorical variables (such as sex) were analyzed using Fig. 2. Imaging findings of normal anterolateral recess of ankle and soft tissue impingement at anterolateral recess of ankle by use of 3D-FSPGR MR. Images are reformatted-axial contrast-enhanced fat-suppressed 3DFSPGR images (TR/TE of 20.9/2.2 msec, flip angle of 15° , 256 × 192 matrix, 1 number of excitatid, field of view of 12 cm) using coronal contrast enhanced 3D-FSPGR imaging. A. Normal image shows no enhancing lesion at anterolateral recess of ankle. B. Anterolateral soft tissue impingement of ankle was defined as a nodular thick enhancement with internal intrusion (arrow).. A Korean J Radiol 9(5), October 2008. B. 411.
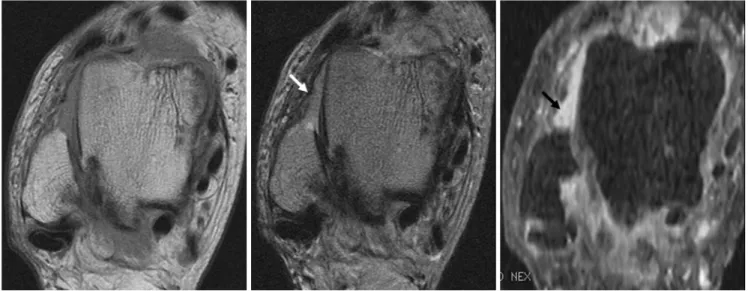
(4) Choo et al.. Fisher’s exact test. For all tests, a two-tailed p < 0.05 was considered statistically significant. Sensitivity, specificity, and accuracy of MRI for the depiction of anterolateral soft tissue impingement of the ankle were calculated by using arthroscopic results as reference standards. We considered a score of 4 and 5 as positive MRI results for both routine MRI and 3D-FSPGR MRI. Each of the false positive and false negative results for the routine MRI set was compared with the respective. results with the use of 3D-FSPGR MRI. On the contrary, false positive and negative 3D-FSPGR MRI results were evaluated. The weighted Kappa (κ) test was used to assess agreement of the interobserver performance for the characterization of anterolateral soft tissue impingement as the data were categorized. The degree of agreement was categorized as follows: κ< 0, poor; κfrom 0 to 0.20, slight agreement; κfrom 0.21 to 0.40, fair agreement; κfrom. A B C Fig. 3. 56-year old woman with chronic ankle pain. This was true positive case diagnosed by both routine MRI and contrast enhanced fat-suppressed 3D-FSPGR MRI. A, B. Axial intermediate (A) and T2 (B) weighted spin echo (2000/20/70) MRI showing soft tissue fullness in anterolateral recess (arrow). C. Reformatted-axial contrast enhanced fat-suppressed 3D FSPGR images also show enhancing soft tissue fullness in anterolateral recess (arrow).. A B C Fig. 4. 30-year-old man with chronic ankle pain. This case was correctly diagnosed by CE fat-suppressed 3D-FSPGR MRI and was missed by use of routine MRI. A, B. Axial T2 (A) weighted spin echo (2000/70) MRI shows mild fuzzy anterior talofibular ligament (arrow). However, reformatted axial CE fat-suppressed 3D-FSPGR (B) MRI shows irregular thick enhancement in anterolateral recess (arrow) of ankle. C. Arthroscopic findings confirm presence of anterolateral impinged soft tissue (*).. 412. Korean J Radiol 9(5), October 2008.
(5) Contrast-Enhanced Fat-Suppressed 3D-FSPGR Ankle MR Imaging for Anterolateral Soft Tissue Impingement. 0.41 to 0.60, moderate agreement; κfrom 0.61 to 0.80, substantial agreement; and κfrom 0.81 to 1, near perfect agreement (16). Statistical analyses were performed with SPSS 12.0 for Windows (SPSS, Chicago, IL), Microsoft Excel 2000 (Microsoft, Redmond, WA) and MedCalc (MedCalc Software, Mariakerke, Belgium).. RESULTS. Table 1. Comparison of Clinical Characteristics and Arthroscopic Results between Patients with Anterolateral Soft Tissue Impingement and Control Subjects Group ALSI (n = 45). Control (n = 45). p value. Sex M 32 32 F 13 13 Age (years) Mean 34 30 Range 17-68 15-64 Preoperative MRI to arthroscopy (days) Median 43 36 Mean 89 79 Range 4-241 12-265 OCL 16 23 Syndesmotic injury 10 08 Loose bodies 07 13 ATFL tear 10 01 Impingement (other sites) Anteromedial 16 20 Anterior 03 09 posterior 03 05. 11. 0.082. 0.252. 0.201 0.791 0.201 0.011 0.021. Note.─ ALSI = anterolateral soft tissue impingement, OCL = osteochondral lesion; ATFL = anterior talofibular ligament 1 By Fisher’s exact tes; 2 By Mann-Whitney U test. There was no significant difference in the clinical characteristics between patients with anterolateral soft tissue impingement and the control group of patients, indicating a homogenous distribution of clinical data between the two groups. However, according to the findings of the arthroscopic examinations, anterior talofibular ligament tears were more frequent (p < 0.05) in patients with anterolateral soft tissue impingement than in the control group of patients. Soft tissue impingements at other recesses of the ankle were more frequent (p < 0.05) in the control group of patients than in patients with anterolateral soft tissue impingement (Table 1). The areas under the alternative free response ROC curve for the overall ability to characterize the lesions are presented in Table 2. For the two viewing sessions, the overall accuracy in lesion characterization was significantly higher (p < 0.05) using CE fat-suppressed 3D FSPGR MRI (Az = 0.892 for reader 1, 0.881 for reader 2) than using routine MRI (Az = 0.763 for reader 1, 0.745 for reader 2) (Table 2). Sensitivity, specificity, and accuracy were higher for the use of CE fat-suppressed 3D-FSPGR MRI than for the use of routine MRI in diagnosing anterolateral soft tissue impingement of the ankle (Table 3). Readers 1 and 2 identified 17 and 20 false negatives, respectively, for the detection of anterolateral soft tissue impingement using routine MRI. There were fewer false negative results with the use of CE fat-suppressed 3DFSPGR MRI, as reader 1 identified 11 of the 17 routine MRI false negatives and reader 2 identified 11 of the 20 routine MRI false negatives (Fig. 4). Readers 1 and 2. Table 2. Accuracy of Characterization for Each Reader and Each Method Routine Set. CE Set p. Reader 1 Reader 2. Az. 95% CI. Az. 95% CI. 0.763 0.745. (0.665, 0.862) (0.643, 0.847). 0.892 0.881. (0.816, 0.968) (0.843, 0.976). < 0.05 < 0.05. Note.─ Values are mean values of areas (Az) under the ROC curve. CI = confidence interval, p = univariate z-score test under ROC curve. Table 3. Diagnostic Performances of Each Technique for Assessment of Anterolateral Soft Tissue Impingement of Ankle Routine Set. Reader 1 Reader 2. CE Set. Sensitivity. Specificity. Accuracy. Sensitivity. Specificity. Accuracy. 64.4 (29/45) 55.6 (25/45). 66.7 (34/45) 66.7 (34/45). 70.0 (63/90) 65.6 (59/90). 82.2 (37/45) 77.8 (35/45). 95.6(43/45) 93.3 (42/45). 88.9 (80/90) 85.6 (77/90). Note.─ Values in all columns are percentages; values in parentheses are the number of ankles. CE = contrast enhanced. Korean J Radiol 9(5), October 2008. 413.
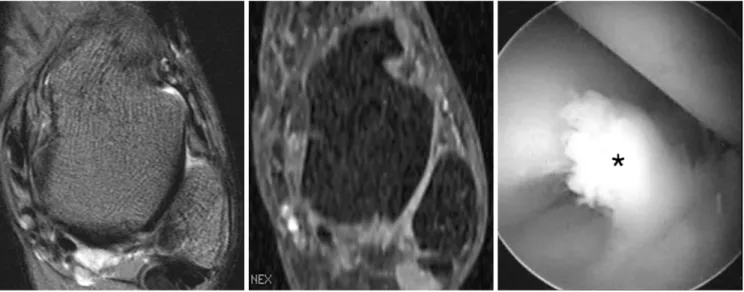
(6) Choo et al.. identified 10 and 11 false positives, respectively, using routine MRI. Using CE fat-suppressed 3D-FSPGR MRI, reader 1 correctly diagnosed 9 of 10 false positives that were diagnosed by the use of routine MRI, and reader 2 correctly diagnosed 9 of 11 false positives that were diagnosed by the use of routine MRI. For CE fatsuppressed 3D-FSPGR MRI, readers 1 and 2 both diagnosed 6 false negative results (Fig. 5) and 2 false positive results. The degree of the interobserver agreement was 0.738 and 0.891 for the use of both routine MRI and CE fatsuppressed 3D-FSPGR MRI, indicating a substantial to near perfect interobserver agreement for the overall characterization of anterolateral soft tissue impingement using both imaging techniques.. DISCUSSION Conventional ankle MRI has been routinely used with controversial results for the assessment of anterolateral impingement of the ankle. Direct magnetic resonance arthrography has also been used to improve the accuracy of diagnosis, regardless of the invasiveness of the method (8-14). Recently, Huh et al. (15) introduced the use of CE fat-suppressed 3D-FSPGR as a less invasive alternative modality for assessing synovitis and soft tissue impingement of the ankle. For the diagnosis of anterolateral impingement, the results were comparable to the use of direct magnetic resonance arthrography with respect to accuracy, sensitivity and specificity. However, the study by. Huh and colleagues had limitations due to the inclusion of a small number of patients (7 patients) and no comparison with the use of routine MRI. In the present study, 90 patients were included, and CE fat-suppressed 3D-FSPGR MRI performed in a superior manner for assessing anterolateral soft tissue impingement when compared to the use of routine ankle MRI. CE fatsuppressed 3D-FSPGR MRI had a lower partial volume effect than routine MRI and could more accurately identify the anterolateral soft tissue impingement. A higher z-axis resolution also enabled us to obtain good quality images of the anterolateral gutter along any plane, with minimal stepladder artifacts. The major drawbacks of the use of routine MRI in assessing the anterolateral gutter were a greater partial volume effect and a lower conspicuity as compared to the use of CE fat-suppressed 3D-FSPGR. As compared to the use of CE fat-suppressed 3D-FSPGR MRI, the use of routine MRI with 3-mm slices was not satisfactory for assessing anterolateral soft tissue impingement due to its low resolution. As routine T2-weighted images led to a high signal contrast between joint fluid and adjacent tissue, the images helped to depict conspicuously the lesions in cases with joint effusion. Thus, routine MRI had a higher specificity than sensitivity in assessing anterolateral soft tissue impingement. Our results suggest that routine MRI use is complimentary with CE fat-suppressed 3D-FSPGR MRI for the diagnosis of anterolateral soft tissue impingement. The injuries implicated in the development of anterolateral impingement may result in cartilage and ligament. A B C Fig. 5. 33-year-old man with chronic ankle pain. This was contrast enhanced 3D-FSPGR MRI false negative case but routine MRI true positive case. A. Axial T2-weighted spin echo (2000/70) MRI shows focal soft tissue mass. B. Reformatted axial contrast enhanced fat-suppressed 3D-FSPGR MRI shows no enhancing lesion in anterolateral recess of ankle. C. Arthroscopic findings confirm presence of anterolateral impinged soft tissue (*).. 414. Korean J Radiol 9(5), October 2008.
(7) Contrast-Enhanced Fat-Suppressed 3D-FSPGR Ankle MR Imaging for Anterolateral Soft Tissue Impingement. damage as well as in the development of reactive synovitis (1-7). An anterior talofibular ligament tear was seen more frequently in patients with anterolateral impingement than in control subjects. Other common accompanying lesions were osteochondral lesions, syndesmotic injuries and loose bodies, although the incidence of these lesions was not significantly different between the two groups of patients. There are limitations to this study. First, the study has potential subject-selection bias because of the retrospective design. Second, the criteria are different for comparing the diagnostic accuracy of routine MRI with CE fat-suppressed 3D-FSPGR MRI. However, each criterion of both MR sequences was based on the findings of previous reports (9, 13). The discrepancy of criteria may affect the statistical results of this study. Third, discrimination between extracapsular enhancing structures and impinged synovialenhanced tissue is difficult in some cases. Fourth, nonenhancement of impinged tissue could not be conspicuously depicted. Fifth, intra-articular diffusion of the MRI contrast agent could be mistaken for synovitis, even though we minimized the imaging time to 4 minutes and 22 seconds to minimize the diffusion effect (15, 17). Finally, we did not acquire a further delayed sequence for the indirect magnetic resonance arthrographic effect in our investigation protocol. We did not conduct a comparative study for images obtained with the use of routine MRI and images obtained with the use of non-CE fat-suppressed 3D-FSPGR sequences, because a fat-suppressed 3D-FSPGR sequence without contrast-enhancement is not properly used to reveal abnormalities where fat and ligaments are seen as a low signal. The use of CE fat-suppressed T1-weighted SE images, as with routinely used CE MR images, may be helpful to detect anterolateral soft tissue impingement of the ankle. Li et al. (18) suggested that small lesions were better visualized in the thin CE 3D gradient MR images than in the thick CE SE images, by reduction of partial volume effects, minimization of signal losses caused by field inhomogeneities, and better-reformatted images. As the anterolateral recess of the ankle is a small space, anterolateral soft tissue impingement may be better detected with the use of CE 3D-FSPGR MRI than with CE T1-weighted SE images. However, since a comparison study of anterolateral soft tissue impingement of the ankle on CE SE and CE 3D gradient-echo sequences has not yet reported, a comparative investigation may be needed in the future. In summary, the use of CE fat-suppressed 3D-FSPGR MRI is a helpful adjunct to the use of non-enhanced. Korean J Radiol 9(5), October 2008. routine SE MRI sequences to identify patients with anterolateral impingement syndrome.. References 1. Kim SH, Ha KI. Arthroscopic treatment for impingement of the anterolateral soft tissues of the ankle. J Bone Joint Surg Br 2000;82:1019-1021 2. Ferkel RD, Karzel RP, Del Pizzo W, Friedman MJ, Fischer SP. Arthroscopic treatment of anterolateral impingement of the ankle. Am J Sports Med 1991;19:440-446 3. Martin DF, Curl WW, Baker CL. Arthroscopic treatment of chronic synovitis of the ankle. Arthroscopy 1989;5:110-114 4. Meislin RJ, Rose DJ, Parisien JS, Springer S. Arthroscopic treatment of synovial impingement of the ankle. Am J Sports Med 1993;21:186-189 5. Liu SH, Raskin A, Osti L, Baker C, Jacobson K, Finerman G, et al. Arthroscopic treatment of anterolateral ankle impingement. Arthroscopy 1994;10:215-218 6. Thein R, Eichenblat M. Arthroscopic treatment of sports-related synovitis of the ankle. Am J Sports Med 1992;20:496-498 7. McCarroll JR, Schrader JW, Shelbourne KD, Rettig AC, Bisesi MA. Meniscoid lesions of the ankle in soccer players. Am J Sports Med 1987;15:255-257 8. Robinson P, White LM, Salonen DC, Daniels TR, Ogilvie-Harris D. Anterolateral ankle impingement: MR arthrographic assessment of the anterolateral recess. Radiology 2001;221:186-190 9. Robinson P, White LM. Soft-tissue and osseous impingement syndromes of the ankle: role of imaging in diagnosis and management. Radiographics 2002;22:1457-1471 10. Cerezal L, Abascal F, Canga A, Pereda T, Garcia-Valtuille R, Perez-Carro L, et al. MR imaging of ankle impingement syndromes. AJR Am J Roentgenol 2003;181:551-559 11. Rubin DA, Tishkoff NW, Britton CA, Conti SF, Towers JD. Anterolateral soft tissue impingement in the ankle: Diagnosis using MR imaging. AJR Am J Roentgenol 1997;169:829-835 12. Liu SH, Nuccion SL, Finerman G. Diagnosis of anterolateral ankle impingement. Am J Sports Med 1997;25:389-393 13. Farooki S, Yao L, Seeger LL. Anterolateral impingement of the ankle: effectiveness of MR imaging. Radiology 1998;207:357360 14. Jordan LK 3rd, Helms CA, Cooperman AE, Speer KP. Magnetic resonance imaging findings in anterolateral impingement of the ankle. Skeletal Radiol 2000;29:34-39 15. Huh YM, Suh JS, Lee JW, Song HT. Synovitis and soft tissue impingement of the ankle: assessment with enhanced threedimensional FSPGR MR imaging. J Magn Reson Imaging 2004;19:108-116 16. Kundel HL, Polansky M. Measurement of observer agreement. Radiology 2003;228:303-308 17. Steinbach LS, Palmer WE, Schweitzer ME. Special focus session. MR arthrography. Radiographics 2002;22:1223-1246 18. Li D, Haacke EM, Tarr RW, Venkatesan R, Lin W, Wielopolski P. Magnetic resonance imaging of the brain with gadopentetate dimeglumine-DTPA: comparison of T1-weighted spin-echo and 3D gradient-echo sequences. J Magn Reson Imaging 1996;6:415-424. 415.
(8)
수치
관련 문서
with the experimental C versus t data. If the fit is unsatisfactory, another rate equation is guessed and tested. Integral method is especially useful for fitting simple
Osteomyelitis in the right distal femur with surrounding
So, the presence of a grain removes a strange barrier between unitary dynamics and the collapse of the wave vector, which is a hindrance for modeling dynamics, since the use
The Volume structure of the STA308A consists of individual volume registers for each channel and a master volume register that provides an offset to each channels volume
• Each observed shape is now a point (vector) x in 2*K dimensional space. • The “mean shape” is the center of mass of
Four circular bone defects with a diameter of 8mm were formed on each of the calvaria of rabbits. Each defect in the calvarium was allocated to 1) control group,.. 2)
For patients treated for chin augmentation using either genioplasty with Medpor Ⓡ or osteotomy, the predictive value of the correlation of the hard and
Purpose: Calcaneal fracture is a rare fracture, which accounts for about 2% of all fractures, but is one of the most common fractures in the ankle bone.. There is
