Effects of Propranolol on the Left Ventricular Volume of Normal Subjects During CT Coronary Angiography
Yuan Heng Mo, MD
1-3, Fu Shan Jaw, MD
1, Yung Cheng Wang, MD
2, 3, Chin Ming Jeng, MD
2, 3, Shinn Forng Peng, MD
41Institute of Biomedical Engineering, College of Engineering and the College of Medicine, National Taiwan University, Taipei, Taiwan; 2Department of Radiology, Cathay General Hospital, Taipei, Taiwan; 3College of Medicine, Fu Jen Catholic University, Taipei, Taiwan; 4Department of Medical Imaging, National Taiwan University Hospital, Taipei, Taiwan
Objective: The purpose of this study is to determine the effects of propranolol on the left ventricular (LV) volume during CT coronary angiography.
Materials and Methods: The LV volume of 252 normal Chinese subjects (126 subjects with propranolol medication and 126 age- and gender-matched Chinese subjects without medication) was estimated using 64 slices multi-detector CT (MDCT).
The heart rate difference was analyzed by the logistic linear regression model with variables that included gender, age, body height, body weight, systolic blood pressure (SBP), diastolic blood pressure (DBP) and the dosage of propranolol.
The following global LV functional parameters were calculated: the real-end diastolic volume (EDV), the real-end systolic volume (ESV) and the real-ejection fraction (EF).
Results: The female subjects had a greater decrease of heart rate after taking propranolol. The difference of heart rate was negatively correlated with the dosage of propranolol. The real-EDV, the real-ESV and the real-EF ranged from 48.1 to 109 mL/m2, 6.1 to 57.1 mL/m2 and 41% to 88%, respectively. There was no significant difference in the SBP and DBP between the groups without and with propranolol medication (123 ± 17 and 80 ± 10 mmHg; 120 ± 14 and 80 ± 11 mmHg, respectively). The real-EDV showed no significant difference between these two groups, but the real-ESV and real- EF showed significant differences between these two groups (69.4 ± 9.3 and 70.6 ± 8.9 mL/m2; 23.5 ± 5.7 and 25.6 ± 3.7 mL/m2, 66.5 ± 5.1% and 63.5 ± 4.6%, respectively).
Conclusion: The difference of heart rate is significantly influenced by gender and the dosage of propranolol. Propranolol will also increase the ESV, which contributes to a decreased EF, while the SBP, DBP and EDV are not statistically changed.
Index terms: Left ventricular volume; Ejection fraction; Heart rate; Beta-blocker; Propranolol, 64-slice MDCT; CT coronary angiography
Received December 20, 2010; accepted after revision February 16, 2011.
This study was supported by a grant from Cathay General Hospital (CMRI-9811).
Corresponding author: Shinn Forng Peng, MD, Department of Medical Imaging, National Taiwan University Hospital, No. 7, Chung Shan South Road, Taipei 100, Taiwan.
• Tel: (8862) 27082121-3865 • Fax: (8862) 66362695
• E-mail: [email protected]
This is an Open Access article distributed under the terms of the Creative Commons Attribution Non-Commercial License (http://creativecommons.org/licenses/by-nc/3.0) which permits unrestricted non-commercial use, distribution, and reproduction in any medium, provided the original work is properly cited.
pISSN 1229-6929 · eISSN 2005-8330 Korean J Radiol 2011;12(3):319-326
INTRODUCTION
CT coronary angiography using 64-slice multi-detector CT (MDCT) is an emerging, less invasive imaging modality for evaluating the coronary arteries (1-5). CT coronary angiography is obtained by using retrospective electrocardiography (ECG)-gating and this allows the reconstruction of datasets in any phase of the cardiac cycle.
In addition to the angiography, the dimensions and volumes of the cardiac chambers can be measured at the same time while performing the CT coronary angiography examination (6).
slice MDCT scanner (Brilliance; Philips Medical Systems, Cleveland, OH) during a single breath-hold period (8-10 seconds). The parameters of our scanning protocol were 64 × 0.625-mm collimation, 120-140 kV, 800-1000 mA, a 0.42 second rotation time, a pitch value of 0.2, a 0.8- mm slice thickness and a 0.6-mm reconstruction interval.
The bolus-tracking method was used and the scanning field included the entire heart from the proximal aorta (1-2 cm below the carina) to the cardiac apex. Sixty to 90 mL of iodinated contrast medium (Ioversol, Optiray 320 mg I/
mL, Tyco Healthcare, Canada) was injected intravenously via an antecubital vein at a flow rate of 5 mL/s and this was followed by 50 mL of saline at the same flow rate. A region of interest was placed on the aortic root. The scan was automatically initiated 6 seconds after the CT number of the region of interest reached 120 Hounsfield units. According to the scanning protocol of our hospital, no radiation dose modulation was used to secure good image quality. The average radiation dose was 17.9 ± 3.2 mSv.
Image Analysis
The retrospective ECG-gated reconstructions were performed to generate image data at every 5% of the R-R interval from 0% to 95% of the R-R interval and then the image data was transferred to the workstation for further post-processing (Philips Extended Brilliance Workspace v3.5, The Netherland). The LV volume of twenty phases was estimated by semi-automated methods and this was normalized by the body surface area. The endocardial contours were automatically detected by the software of the workstation; the contour detection was visually checked and manually corrected if considered necessary (Fig. 1A, B). Papillary muscles were included in the LV cavity. The following global LV functional parameters were calculated:
the minimal volume as the end-systolic volume (real-ESV), the maximal volume as the end-diastolic volume (real-EDV) and the ejection fraction (real-EF) by using the formula EF (%) = (EDV-ESV) × 100 / EDV.
Data Collection and Statistical Analysis
The average heart rates before the CT scans, after medication if necessary, after breath holding and during the CT scans were recorded. The dosage of propranolol, the heart rate, the systolic blood pressure (SBP) and the diastolic blood pressure (DBP) before and after taking propranolol were recorded.
Data analysis was performed using the STATA 10 software For patients with cardiac diseases such as coronary artery
disease or cardiomyopathy, precise and reliable assessment of the left ventricular (LV) function and dimensions are important for predicting the prognosis (7). Previous studies have demonstrated that the retrospectively, ECG-gated MDCT determination of the LV volumes and consequently the global LV function parameters was feasible and the results were in good agreement with the established imaging modalities such as cine ventriculography, echocardiography and cine magnetic resonance imaging (6-26).
A regular and appropriate range of the heart rate (below 65 beats per minute in our hospital) is necessary for good imaging quality. A beta-blocker such as propranolol is the most widely used drug to slow down the heart rate. Previous studies reported that propranolol had inhibitory effects on the LV function (27-30). However, the sample size of those studies was small and there has been only one study that reported about the hemodynamic effects of propranolol in normal subjects. The purpose of this retrospective study is to determine the effects of propranolol (10 mg) on the LV volume during CT coronary angiography in normal subjects.
MATERIALS AND METHODS
Study Population
According to our cardiac imaging data base, 897 Chinese subjects came to our hospital for health screening examinations, which included CT coronary angiography, from March 2007 to July 2008. All the subjects received beta- blocker (propranolol, 10 mg) per-oral 30 minutes before the CT scan, except those having a heart rate below 65 beats per minutes. The dosage of propranolol was adjusted according to the heart rate to ensure the heart rate was below 65. A total of 403 subjects were excluded from this study due to one of the following criteria: 1) any luminal diameter stenosis in any of the coronary arteries found on images, 2) arrhythmia or an abnormal ECG, or 3) a history of hypertension with or without medication. In the remaining 494 subjects, 126 who took propranolol to decrease their heart rate and another 126 age- and gender-matched ones who had a heart rate below 65 beats were chosen for this retrospective study. The approval from the institutional ethical committee was obtained before undertaking the study. Informed consent was not required.
CT Coronary Angiography Protocol
CT coronary angiography was performed on a 64-
A
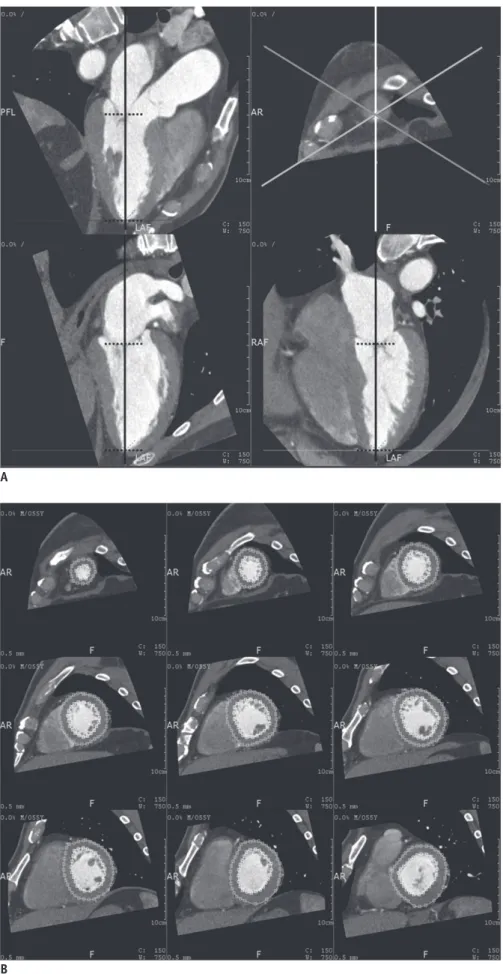
Fig. 1. Left ventricular volume of twenty phases’ estimation.
A. Cardiac axial images were automatically calculated and displayed on workstation.
If necessary, we corrected axis by rotating vertical long axis (black solid line) to make axis orthogonal to plane of mitral valve and it passed center of mitral valve and apex.
We defined area of interest by designating cardiac apex and concave center of mitral valve on planar images (dash horizontal short lines). B. Nine-slices of short-axis sections and contours of endocardial border of left ventricle were automatically traced and when necessary, traced contours were edited manually. Volume of papillary muscles was included in volume of ventricle.
B
(Stata, TX). To evaluate the inter- and intra-observer reproducibility, two observers performed the analyses independently and one did the second analyses the next week. We then calculated the concordance correlation coefficient for the continuous data. We tested whether the volume of a particularly chosen diastolic phase such as the 0% phase and the systolic phase such as the 35%, 40%
and 45% phases could replace the real-EDV and the real- ESV through the use of Student’s t-test. The heart rate difference was analyzed by the logistic linear regression model for the mixture of categorical and numerical data with the independent variables, which included the gender, age, height, weight, SBP, DBP and the dosage of propranolol. The differences of parameters, including the real-EF, real-EDV, real-ESV, SBP and DBP, in 252 subjects whether or not propranolol medication was used were tested through Student’s t-test. P values less than 0.05 were considered statistically significant.
RESULTS
A total of 252 normal subjects (M:F = 150:102; mean age, 56 ± 11 years; mean body height, 163.1 ± 8.3 cm;
mean body weight, 66.7 ± 12 kg and mean body surface area, 1.72 ± 0.18 m2) (Table 1) were included in this study.
All the images of the coronary CT angiography were of diagnostic image quality. For the inter-observer analysis, no statistically significant difference was found between the estimations of the real-EDV (r = 0.976, p > 0.05) and the real-ESV (r = 0.957, p > 0.05). For the intra-observer analysis, no statistically significant difference was found between the repeated measurements of the real-EDV (r = 0.996, p > 0.05) and the real-ESV (r = 0.997, p > 0.05).
The mean heart rate of the 126 subjects who did not take propranolol was 59 ± 6 beats per minute; the mean heart rates of the other 126 subjects, who had taken propranolol, was 72 ± 7 beats per minute before medication and 63 ±
5 beats per minute after medication, respectively. After evaluation of the factors, including gender, age, height, weight, SBP, DBP and the number of pills of 10 mg
propranolol from the logistic regression model, the difference of heart rate before and during CT scan was significantly influenced only by gender and dosage of beta-blocker (Table 2).
The LV volume of the total 252 subjects was estimated and normalized; the real-EDV ranged from 48.1 to 109 (mean: 70.9 ± 9.9) mL/m2 and the real-ESV ranged from 6.1 to 57.1 (mean: 24.6 ± 6.9) mL/m2. The real-EF ranged from 41% to 88% (mean: 65.6 ± 7%). According the volume data of twenty phases, a volume-time curve (Fig. 2) was obtained. The three global LV functional parameters showed no difference according to gender. The mean real-EDV, the real-ESV and the real-EF of the male and female subjects were 69.1 ± 9.3 and 70.8 ± 8.9 mL/m2 (p > 0.05), 24.1 ± 5.6 and 24.7 ± 4.3 mL/m2 (p > 0.05) and 65.3 ± 5.5 and 65.1
± 4.8% (p > 0.05), respectively. Fifty eight percent (147 of 252) of the subjects had a maximal LV volume at the 0%
phase and 42% (105 of 252) had a maximal LV volume at the 95% phase. Two percent (4 of 252) of the subjects had a minimal volume at the 30% phase, 32% (81 of 252) had a minimal LV volume at the 35% phase, 52% (131 of 252)
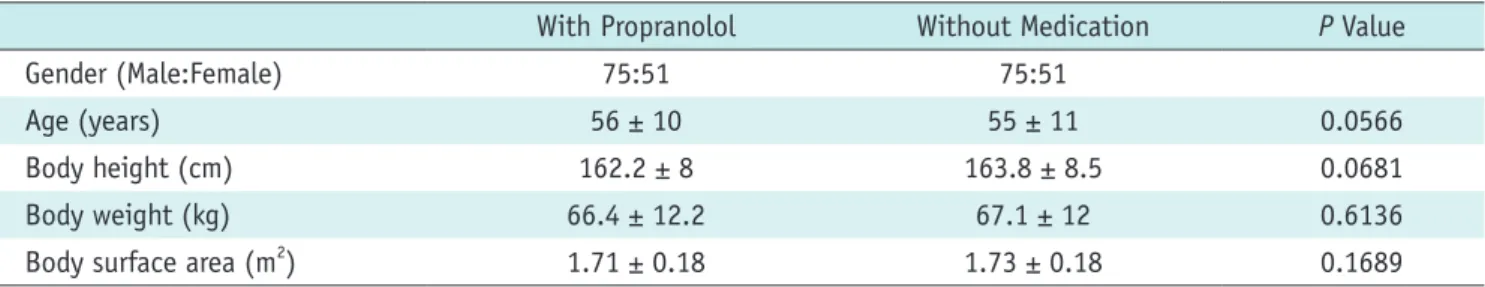
Table 1. Demographic Data of 126 Normal Subjects with Propranolol Medication and 126 Normal Subjects without Medication
With Propranolol Without Medication P Value
Gender (Male:Female) 75:51 75:51
Age (years) 56 ± 10 55 ± 11 0.0566
Body height (cm) 162.2 ± 8 163.8 ± 8.5 0.0681
Body weight (kg) 66.4 ± 12.2 67.1 ± 12 0.6136
Body surface area (m2) 1.71 ± 0.18 1.73 ± 0.18 0.1689
Table 2. Analysis of Heart Rate Difference Using Logistic Linear Regression Model after Deletion of Noncontributory Factors
Heart Rate Difference Coefficient P Value
Gender -1.27 0.011*
Number of pills of
propranolol (10 mg) 3.29 0*
Constant -2.42 0*
Note.— Pseudo R-squared = 0.79
*for significant value
had a minimal LV volume at the 40% phase, 14% (35 of 252) had a minimal LV volume at the 45% phase and 0.4% (1 of 294) had a minimal LV volume at the 50% phase.
The mean difference between the real-EDV (70.9 ± 9.9 mL/m2), the 0% EDV (70.5 ± 9.8 mL/m2), and the mean difference between the real-EDV, the 95% phase EDV (70.1
± 10 mL/m2) had no statistical significance (p > 0.05), and neither did the mean difference between the real-ESV (24.6
± 6.9 mL/m2) and the 40% phase LV volume (26.4 ± 7.5 mL/m2, p > 0.05). However, the mean difference between the real-ESV, the 35% phase LV volume (26.4 ± 7.5 mL/m2, p = 0.0023), and the mean difference between the real- ESV, the 45% phase LV volume (28.9 ± 8.1 mL/m2, p = 0) were significantly different as were the real-EF (65.6 ± 7%) compared to the EF calculated from the 0-35% (62.8 ± 7.9%, p = 0), 0-40% (64.1 ± 7.3%, p = 0.01) and 0-45% phase volumes (59.3 ± 8.6%, p = 0). The percentage of the mean difference between the real- and 0-35%, the real- and
0-40% and the real- and 0-45% phase EF was 3%, 2% and 6%, respectively.
The mean SBP and DBP of the 126 subjects who had not taken propranolol was 123 ± 17 and 80 ± 10 mmHg, respectively. The mean SBP and DBP of the other 126 subjects, who had taken propranolol, were 120 ± 14 mmHg and 80 ± 11 mmHg, respectively. There was no significant difference in the SBP and DBP between these two groups (p > 0.05). The real-EDV, real-ESV and real-EF were 69.4 ± 9.3 mL/m2, 23.5 ± 5.7 mL/m2 and 66.5 ± 5.1% for the 126 subjects without the medication, respectively; and the real- EDV, real-ESV and real-EF were 70.6 ± 8.9 mL/m2, 25.6 ± 3.7 mL/m2 and 63.5 ± 4.6% for the 126 subjects who had taken propranolol, respectively. The real-ESV and real-EF had significant differences between the groups without and with medication (p < 0.05), but the real-EDV showed no significant difference between these two groups (Table 3).
DISCUSSION
Beta-blocker is commonly used to reduce the heart rate to less than 65 beats per minutes in order to get good imaging quality for coronary angiography. Our results show the heart rate difference is influenced by gender and the administered dosage of propranolol during CT coronary angiography. The female subjects in our study had a greater decrease of the heart rate than did the males after taking propranolol. One report showed that women had greater metoprolol exposure than did the men and a greater reduction of the exercise heart rate (31).
In our study, the 35-40% and 65-80% phases of the RR interval in males and the 35-45% and 70-80% phases of the RR interval in females showed the smallest slope,
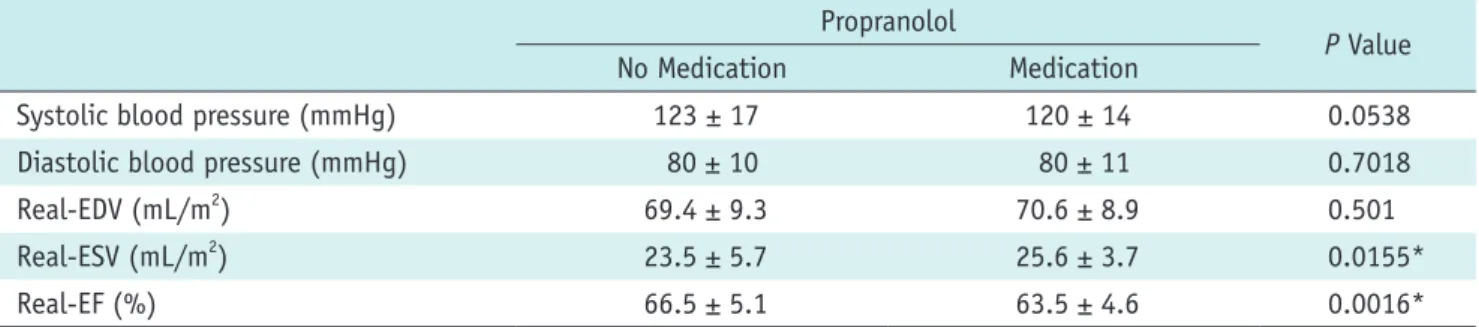
Table 3. Relationship of Parameters of Left Ventricular Function in Subjects without or with Propranolol and as Analyzed Using Unpaired Student t-test
Propranolol
P Value
No Medication Medication
Systolic blood pressure (mmHg) 123 ± 17 120 ± 14 0.0538
Diastolic blood pressure (mmHg) 80 ± 10 80 ± 11 0.7018
Real-EDV (mL/m2) 69.4 ± 9.3 70.6 ± 8.9 0.501
Real-ESV (mL/m2) 23.5 ± 5.7 25.6 ± 3.7 0.0155*
Real-EF (%) 66.5 ± 5.1 63.5 ± 4.6 0.0016*
Note.— Real-EDV = real-end diastolic volume of left ventricle, Real-ESV = real-end systolic volume of left ventricle, Real-EF = real- ejection fraction
*for significant values
Fig. 2. Mean volume-time curve obtained from data of twenty phases’ reconstruction.
35-40% and 65-80% phases of R-R interval in males (dash line) and 35-45% and 70-80% phases in females (solid line) showed smallest slope, which indicated least volumetric change.
% reconstruction phase of R-R interval
normalized LV volume (ml)
which indicates the least LV volumetric change. These are the most frequent reconstruction phases we used for the evaluation of the coronary arteries (32). One study claimed that 64-slice CT coronary angiography provided the best image quality in mid-diastole such as the 60%
and 65% phases with using a Siemens 64-slice CT scanner (33). In another study using dual-source CT, the optimal reconstruction phase was at 75% of the R-R interval in subjects with low or intermediate heart rates. In patients with heart rates faster than 80 beats per minutes, the systolic reconstructions often yield superior image quality as compared to the diastolic reconstructions (34). The slightly different preference in phase selection could be related to the different definition of the % phase of the R-R interval of different CT scanners, such as the beginning of the acquisition window within the R-R interval for the Siemens scanner and the center of the acquisition window for the General Electric, Philips and Toshiba scanners.
Left ventricular EF is one of the indices of cardiac function and it is usually evaluated by the safer but operator dependant echocardiography. It can be calculated from post-processing of the raw data from the CT coronary angiography by retrospective reconstruction of the systolic phase and diastolic phase images, which is nearly as good as MRI and better than two-dimensional echocardiography or ECG-gated single photon emission computed tomography (SPECT) (23-26). Underestimation of the left ventricular volume in our study is possible due to the exclusion of some volume below the mitral valve when we set the upper limit at the concave center of the mitral valve. Overestimation or underestimation of the LV volume has been reported because of the different criteria for selecting the
endocardial boundary or the inclusion/exclusion of papillary muscle (6-15, 18, 20-24). Estimation of the real-EF from all twenty phases is more precise; however, this takes more than half an hour with some efforts. From our results, direct choices of the 40% RR interval as the systolic phase and the 0% RR interval as the diastolic phase are recommended because the real-ESV has no statistically significant difference compared to the 40% phase LV volume, and the EF calculated from the 0-40% phase volume has the least variation (2%) from the real-EF, and this is similar to the conclusion of Suzuki’s study (17).
One study reported that propranolol administration in the normal subjects decreased the resting heart rate and the EF, it increased the EDV and ESV, but had no effect on the systolic and diastolic blood pressure, although the sample
size was small (28). Some of the animal and patient studies have demonstrated that medicating with beta-blocker in subjects who have cardiac disease results in a significant reduction of the heart rate and ejection fraction, whereas the EDV and ESV are increased (27, 29). One animal study reported that the inhibitory effects of propranolol on the LV function were represented by the negative inotropic action on cardiac contractility, which was shown as an increase in the ESV and a marked reduction in the HR, but there was little dilating action on the EDV (30). Similarly, our results revealed that propranolol had no effect on the SBP and DBP, but it caused an increase of the ESV, which contributed to the decrease of the EF; the EDV was not statistically influenced by propranolol medication, but a slight increase was noted.
Our study had some limitations. First, different subject groups were compared for the assessing the effect of beta- blocker effect, although we used age- and gender-matched inclusion criteria to minimize the heterogeneity. Second, there may have been additional independent variables that affected the reduction of the heart rate such as variability of the vasovagal response while breath holding or individual differences of susceptibility to the beta-blocker.
In conclusion, the difference of heart rate is only significantly influenced by gender and the use of propranolol. In addition to the decreased heart rate, propranolol will also increase the end systolic volume of the left ventricle, which contributes to a decrease in the ejection fraction, while the systolic blood pressure, diastolic blood pressure and the end diastolic volume of the left ventricle are not statistically changed.
REFERENCES
1. Leschka S, Alkadhi H, Plass A, Desbiolles L, Grunenfelder J, Marincek B, et al. Accuracy of MSCT coronary angiography with 64-slice technology: first experience. Eur Heart J 2005;26:1482-1487
2. Raff GL, Gallagher MJ, O’Neill WW, Goldstein JA. Diagnostic accuracy of noninvasive coronary angiography using 64-slice spiral computed tomography. J Am Coll Cardiol 2005;46:552- 557
3. Mollet NR, Cademartiri F, van Mieghem CA, Runza G, McFadden EP, Baks T, et al. High-resolution spiral computed tomography coronary angiography in patients referred for diagnostic conventional coronary angiography. Circulation 2005;112:2318-2323
4. Nikolaou K, Knez A, Rist C, Wintersperger BJ, Leber A, Johnson T, et al. Accuracy of 64-MDCT in the diagnosis of
ischemic heart disease. AJR Am J Roentgenol 2006;187:111- 117
5. Budoff MJ, Achenbach S, Blumenthal RS, Carr JJ, Goldin JG, Greenland P, et al. Assessment of coronary artery disease by cardiac computed tomography: a scientific statement from the American Heart Association Committee on Cardiovascular Imaging and Intervention, Council on Cardiovascular Radiology and Intervention, and Committee on Cardiac Imaging, Council on Clinical Cardiology. Circulation 2006;114:1761-1791
6. Stolzmann P, Scheffel H, Trindade PT, Plass AR, Husmann L, Leschka S, et al. Left ventricular and left atrial dimensions and volumes: comparison between dual-source CT and echocardiography. Invest Radiol 2008;43:284-289 7. van der Vleuten PA, Willems TP, Gotte MJ, Tio RA, Greuter
MJ, Zijlstra F, et al. Quantification of global left ventricular function: comparison of multidetector computed tomography and magnetic resonance imaging. a meta-analysis and review of the current literature. Acta Radiol 2006;47:1049-1057 8. Wu YW, Tadamura E, Yamamuro M, Kanao S, Okayama S, Ozasa
N, et al. Estimation of global and regional cardiac function using 64-slice computed tomography: a comparison study with echocardiography, gated-SPECT and cardiovascular magnetic resonance. Int J Cardiol 2008;128:69-76 9. Puesken M, Fischbach R, Wenker M, Seifarth H, Maintz D,
Heindel W, et al. Global left-ventricular function assessment using dual-source multidetector CT: effect of improved temporal resolution on ventricular volume measurement. Eur Radiol 2008;18:2087-2094
10. Busch S, Johnson TR, Wintersperger BJ, Minaifar N, Bhargava A, Rist C, et al. Quantitative assessment of left ventricular function with dual-source CT in comparison to cardiac magnetic resonance imaging: initial findings. Eur Radiol 2008;18:570-575
11. Bastarrika G, Arraiza M, De Cecco CN, Mastrobuoni S, Ubilla M, Rabago G. Quantification of left ventricular function and mass in heart transplant recipients using dual-source CT and MRI:
initial clinical experience. Eur Radiol 2008;18:1784-1790 12. Bansal D, Singh RM, Sarkar M, Sureddi R, McBreen KC, Griffis
T, et al. Assessment of left ventricular function: comparison of cardiac multidetector-row computed tomography with two- dimension standard echocardiography for assessment of left ventricular function. Int J Cardiovasc Imaging 2008;24:317- 325
13. Schlosser T, Mohrs OK, Magedanz A, Voigtlander T,
Schmermund A, Barkhausen J. Assessment of left ventricular function and mass in patients undergoing computed
tomography (CT) coronary angiography using 64-detector-row CT: comparison to magnetic resonance imaging. Acta Radiol 2007;48:30-35
14. Nakamura K, Funabashi N, Uehara M, Suzuki K, Terao M, Okubo K, et al. Quantitative 4-dimensional volumetric analysis of left ventricle in ischemic heart disease by 64-slice computed tomography: a comparative study with invasive left ventriculogram. Int J Cardiol 2008;129:42-52
15. Chaosuwannakit N, Rerkpattanapipat P, Wangsuphachart S, Srimahachota S. Reliability of the evaluation for left ventricular ejection fraction by ECG-gated multi-detector CT (MDCT): comparison with biplane cine left ventriculography. J Med Assoc Thai 2007;90:532-538
16. Abbara S, Chow BJ, Pena AJ, Cury RC, Hoffmann U, Nieman K, et al. Assessment of left ventricular function with 16- and 64-slice multi-detector computed tomography. Eur J Radiol 2008;67:481-486
17. Suzuki S, Furui S, Kaminaga T, Yamauchi T, Suzuki D, Kuwahara S, et al. Accuracy and efficiency of left ventricular ejection fraction analysis, using multidetector row computed tomography: effect of image reconstruction window within cardiac phase, slice thickness, and interval of short-axis sections. Circ J 2006;70:289-296
18. Sugeng L, Mor-Avi V, Weinert L, Niel J, Ebner C, Steringer- Mascherbauer R, et al. Quantitative assessment of left ventricular size and function: side-by-side comparison of real-time three-dimensional echocardiography and computed tomography with magnetic resonance reference. Circulation 2006;114:654-661
19. Schepis T, Gaemperli O, Koepfli P, Valenta I, Strobel K, Brunner A, et al. Comparison of 64-slice CT with gated SPECT for evaluation of left ventricular function. J Nucl Med 2006;47:1288-1294
20. Raman SV, Shah M, McCarthy B, Garcia A, Ferketich AK.
Multi-detector row cardiac computed tomography accurately quantifies right and left ventricular size and function compared with cardiac magnetic resonance. Am Heart J 2006;151:736-744
21. Orakzai SH, Orakzai RH, Nasir K, Budoff MJ. Assessment of cardiac function using multidetector row computed tomography. J Comput Assist Tomogr 2006;30:555-563 22. Juergens KU, Fischbach R. Left ventricular function studied
with MDCT. Eur Radiol 2006;16:342-357
23. Henneman MM, Schuijf JD, Jukema JW, Holman ER, Lamb HJ, de Roos A, et al. Assessment of global and regional left ventricular function and volumes with 64-slice MSCT:
a comparison with 2D echocardiography. J Nucl Cardiol 2006;13:480-487
24. Belge B, Coche E, Pasquet A, Vanoverschelde JL, Gerber BL.
Accurate estimation of global and regional cardiac function by retrospectively gated multidetector row computed tomography:
comparison with cine magnetic resonance imaging. Eur Radiol 2006;16:1424-1433
25. Yamamuro M, Tadamura E, Kubo S, Toyoda H, Nishina T, Ohba M, et al. Cardiac functional analysis with multi-detector row CT and segmental reconstruction algorithm: comparison with echocardiography, SPECT, and MR imaging. Radiology 2005;234:381-390
26. Juergens KU, Grude M, Maintz D, Fallenberg EM, Wichter T, Heindel W, et al. Multi-detector row CT of left ventricular function with dedicated analysis software versus MR imaging:
initial experience. Radiology 2004;230:403-410
27. Dell’Italia LJ, Walsh RA. Effect of intravenous metoprolol
on left ventricular performance in Q-wave acute myocardial infarction. Am J Cardiol 1989;63:166-171
28. Port S, Cobb FR, Jones RH. Effects of propranolol on left ventricular function in normal men. Circulation 1980;61:358- 366
29. Silke B, Verma SP, Frais MA, Reynolds G, Taylor SH.
Comparative effects of metoprolol and celiprolol on cardiac hemodynamics and left ventricular volume at rest and during exercise-induced angina. Clin Pharmacol Ther 1986;39:5-14 30. Tsusaki H, Yonamine H, Tamai A, Shimomoto M, Kuwano
K, Iwao H, et al. Left ventricular volume and function in cynomolgus monkeys using real-time three-dimensional echocardiography. J Med Primatol 2007;36:39-46
31. Luzier AB, Killian A, Wilton JH, Wilson MF, Forrest A, Kazierad
DJ. Gender-related effects on metoprolol pharmacokinetics and pharmacodynamics in healthy volunteers. Clin Pharmacol Ther 1999;66:594-601
32. Goo HW. State-of-the-art CT imaging techniques for congenital heart disease. Korean J Radiol 2010;11:4-18
33. Leschka S, Husmann L, Desbiolles LM, Gaemperli O, Schepis T, Koepfli P, et al. Optimal image reconstruction intervals for non-invasive coronary angiography with 64-slice CT. Eur Radiol 2006;16:1964-1972
34. Seifarth H, Wienbeck S, Pusken M, Juergens KU, Maintz D, Vahlhaus C, et al. Optimal systolic and diastolic reconstruction windows for coronary CT angiography using dual-source CT.
AJR Am J Roentgenol 2007;189:1317-1323