Received May 26, 2020; revised September 20, 2020; accepted October 14, 2020.
Corresponding author: Sang-Ho Park, Division of Cardiology, Department of Internal Medicine, Soonchunhyang University Cheonan Hospital, 31 Suncheonhyang 6-gil, Dongnam-gu, Cheonan 31151, Korea. E-mail: [email protected]
Copyright Ⓒ 2020 The Korean Academy of Clinical Geriatrics
This is an open access article distributed under the term s of the Creative Com m ons Attribution Non-Com m ercial License (http://creativecom m ons.org/licenses/by-nc/4.0) which perm its unrestricted non-com m ercial use, distribution, and reproduction in any m edium , provided the original work is properly cited.
Associations among Coronary Artery Calcium Score, Left Ventricular Mass Index and Septal E/E’ Ratio in Subjects with Normal Left Ventricular Ejection Fraction
Ung Jeon , Sang-Ho Park
Division of Cardiology, Department of Internal Medicine, Soonchunhyang University Cheonan Hospital, Cheonan, Korea
Background: The objective of this study is to determine if associations among the coronary artery calcium (CAC) score (CACS), left ventricular mass index (LVMI), and septal E/E’ ratio.
Methods: We investigated 1230 consecutive subjects with a normal left ventricular ejection fraction who underwent multidetector computed tomography and echocardiography. The CACS was measured using the Agatstone method. Participants were classified as follows, in a two-fold manner: first, negative CAC (CACS=0) group and positive CAC (CACS >0) group; second, no (CACS=0), mild (1-100), moderate (101-400), and severe CAC deposits ( >400).
Results: In multivariate binary logistic regression adjusted for covariates, the LVMI and septal E/E’ ratio were independent pre- dictors of positive CAC deposits (CACS >0) and severe CACS (CACS >400). Regarding the “composite score” based on a septal E/E’ ratio ≥15 and LVMI ≥90 g/m
2, a higher score was associated with a greater CACS. Per the severity criteria of the CACS, severe CAC deposits were significantly associated with “composite score 2” group and the odds ratios in each group were 1.790, 2.126, and 5.705, respectively.
Conclusion: In our study, the LVMI and septal E/E’ ratio were associated with the CACS, independent of classic risk factors in patients with chest pain or without symptoms with a normal left ventricular ejection fraction.
Key Words: Calcium, Coronary, Echocardiography, Multidetector computed tomography
INTRODUCTION
Coronary artery calcium score (CACS) is a good marker of atherosclerosis which represents the degree of atheromatous plaque burden [1,2]. Coronary artery calcification (CAC) can be quantified by multidetected row computed tomography (MDCT), and the CACS is proportionally related to the se- verity of atherosclerotic disease [3].
Population-based studies indicate that at least one third of
all patients with symptomatic heart failure have normal LV ejection fractions [4] and a part of these patients have coro- nary artery disease (CAD) [5]. Left ventricular diastolic dys- function is a common condition associated with increased risk for heart failure and mortality [6]. Left ventricular (LV) dia- stolic dysfunction is commonly seen in patients with LV hy- pertrophy [7].
Tissue doppler imaging (TDI) is a rapid, inexpensive and
non-invasive method for the assessment of both systolic and
diastolic cardiac function. Also, it has been proven to be a useful prognostic tool in the general population [8,9].
However, although there have been several studies for the relathionship of CACS with left ventricular mass index (LVMI) [10-13] and with tissue Doppler imaging (E/E’) [14,15] reflecting LV diastolic function, it has not been es- tablished whether there is an independent association between CACS and LVMI and septal E/E’ ratio in patient presented with chest pain with normal LV systolic function or asympto- matic subjects with high coronary risk factors.
The purpose of this study is to determine if a meaningful relation between CACS and LVMI and tissue Doppler imag- ing (E/E’) reflecting diastolic function exists in patient pre- sented by chest pain or asymptomatic subjects with normal LV ejection fraction. Additionally, the relationship between the CAC and traditional or possible biomarkers [lipid profile, high sensitivity C-reactant protein (hs-CRP), uric acid, mean platelet volume (MPV), calcium, phosphate] that play a role in coronary artery calcification was assessed.
MATERIALS AND METHODS
1. Study population
We retrospectively enrolled 1230 consecutive subjects (mean age±standard deviation, 67.64±12.85) who were clin- ically indicated to undergo MDCT angiography for coronary artery evaluation from September 2007 to August 2011 at Soonchunhyang University Cheonan Hospital. Clinical in- dication for MDCT coronary scanning were as follows: pa- tients with typical or atypical chest pain, asymptomatic pa- tients who were required to take a preoperative coronary ar- tery evaluation due to coronary risk factors (age >70, dia- betes, hypertension), other cardiovascular disease such as valv- ular heat disease, congenital heart disease. Exclusion criteria were as follows; acute coronary syndrome, left ventricular ejection fraction <50%, baseline creatinine ≥2.0 mg/dL, at- rial fibrillation, frequent extrasystoles, previous percutaneous coronary intervention or bypass surgery. The study protocol was approved by the ethics committee, and was conducted ac- cording to the principles of the Declaration of Helsinki. All patients enrolled in this study provided written informed consent.
2. Cardiovascular risk factors
Basic demographic data including age, gender, hypertension, diabetes mellitus, and smoking history were acquired from electronic medical record. Hypertension was defined as systolic pressure ≥140 mmHg, diastolic pressure ≥90 mmHg, or cur- rent use of antihypertensive medication. Diabetes was defined as fasting glucose >125 mg/dL (if untreated) or previous physician diagnosis and treatment with diet, oral hypo- glycemic drugs, or insulin. Current or past history of smok- ing was relevant if the subject had smoked >10 cigarettes/day for at least 1 year.
3. Biochemical determinations
Blood samples were drawn by venipuncture after a fasting period of 12 hours. Total cholesterol, triglyceride (TG), high-density lipoprotein cholesterol (HDL-C), low-density lipoprotein cholesterol (LDL-C), creatinine, uric acid, total calcium, and phosphate concentrations were determined by Hitachi 7600 automated clinical chemistry analyzer (Hitachi, Tokyo, Japan). The hs-CRP and glycated hemoglobin (HbA1c) were determined by Cobas Integra 800 (Roche Diagnostics, Mannheim, Germany) using reagent for immunoassay. For whole blood cell counts, tubes containing K3-ethylenediaminetertraacetic acid (EDTA) were used. Hemoglobin, platelet, and MPV were measured using Sysmex XE-2100 (Sysmex, Kobe, Japan) hematology analyzer within an hour of blood sampling, in or- der to prevent EDTA-induced platelet swelling. The intra-assay coefficient of variation was <5% for all tests.
The level of kidney function was ascertained by estimated glomerular filtration rate (eGFR) calculated using the formula developed and validated in the MDRD study [16] as follows:
eGFR=(mL/min/1.73 m
2)=186.3×(serum creatinine [mg/dL]−
1.154)×(age [years]−0.203)×(0.742, if female).
4. Echocardiographic measurements
Two-dimensional echocardiography was performed using a
Vivid T-dimension (GE, VingMed, Horten, Norway) with a
3.5 MHz probe in subjects lying in the left decubitus posi-
tion by experienced (10 year) echocardiographers blinded to
all clinical details about the patients. All findings were con-
firmed by the cardiologist blinded to all of the patients’ clin-
ical details. Left ventricle (LV) mass was normalized for body surface area and expressed as the LV mass index (LVMI, g/m
2). The LV mass was obtained by the LV short-axis dimension and a simple geometric cube formula.
According to Devereux et al. [17], the following equation provides a reasonable determination of LV mass in grams:
1.04×{(LVID+PWT+IVST)
3−LVID
3}×0.8+0.6, where left ventricular internal diameter at end-diastole (LVID) repre- sents the internal dimension at diastole, posterior wall thick- ness (PWT) represents the PWT, interventricular septal thickness (IVST) represents the interventricular septal thick- ness, 1.04 is the specific gravity of the myocardium, and 0.8 is the correction factor. The definition of LVH was LVMI
≥89 g/m
2in female, LVMI ≥103 g/m
2in male [18]. Pulse wave Doppler and tissue Doppler image echocardiography was used to assess LV diastolic function. The peaks velocity of the early diastolic filling wave (E wave) were recorded. The ven- tricular filling pressure was estimated by combining the mitral inflow early diastolic velocity (E) and the septal annulus ve- locity (E’). The E/E’ ratio at rest in the all patients was recorded. Increased LV filling pressure was defined as septal E/E’ ratio ≥15 [19].
5. Coronary calcium imaging and quantification MDCT examinations were performed using a 64-slice MDCT scanner (GE Lightspeed VCT, GE Healthcare, Milwaukee, WI, USA). Subjects with a heart rate >70 beats/min were given beta-blocking agents before MDCT imaging. Intravenous contrast material was not required to determine CACS. A stand- ard scanning protocol was utilized, with 64×0.625 mm slice collimation, 350 ms rotation time, 120 kV tube voltage, and 300-600 mA tube current, according to subject body habitus.
Electrocardiographic triggering was used. Trigger delay was 70%. Images were reconstructed by 2.5 mm thickness, 2.5 mm interval and 25 cm DFOV. CACSs were measured on a remote workstation (Advantage Workstation; General Electric, Milwaukee, WI) using the Agaston method [20]. A sum to- tal across all four arteries (left main, left anterior descending, left circumflex, and right coronary arteries) was defined CACS. Participants, on the basis of the CACS, were catego- rized in the two following manner that have been known as
predictors for coronary events or acute myocardial infarction in previous studies [21,22]: first, negative CAC (CACS=0) group and positive CAC (CACS >0); second, no (CACS =0), mild (0.1 to 100), moderate (100.1 to 400), and severe calci- fication ( >400).
6. Statistical analysis
The association between coronary artery calcification and variables (demographic, biochemical, echocardiographic varia- bles) was assessed. Continuous variables were expressed as mean±standard deviation (SD) and analyzed using Student’s t-test. Categorical variables were expressed as percentages and compared using chi-square test.
The Pearson correlation was used to identify the correla- tion between CACS and biochemical and echocaridographic variables. CACS was not normal distribution. So, CACS was analyzed to be transformed into log CACS when Pearson correlation was used.
Variables that showed significant relationships in previous studies and those with a P <0.3 on univariate logistic regression analysis were regarded as confounding variables related to the dependent and independent variables. These included age, gender, diabetes, hypertension, smoking, and MDRD eGFR.
To assess the association with dependent variables (including positive CAC and severe CACS) and independent variables (including hemoglobin, MPV glucose, HbA1c, uric acid, cal- cium, phosphate, hs-CRP >2.0, triglyceride, total cholesterol, LDL-cholesterol, HDL-cholesterol, LVMI, LVH, septal E/E’
ratio, and septal E/E’ ratio ≥15), multivariate logistic re- gression analysis was used. The covariate-adjusted odds ratios (OR) and their 95% confidence intervals (CI) for each depend- ent variable (positive CAC and severe CACS) were calculated.
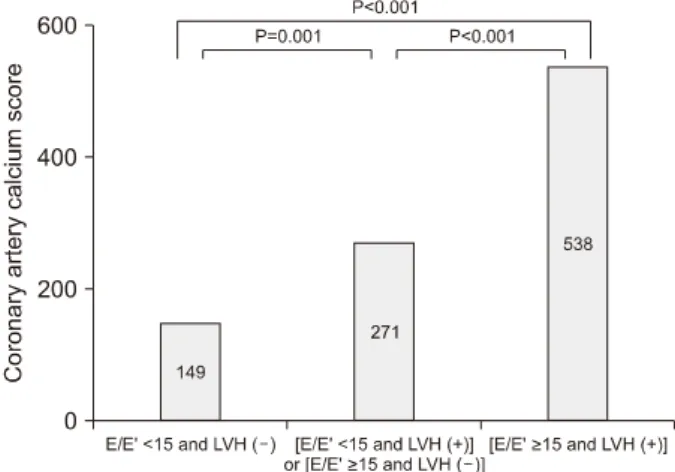
We used “the composite score” composed of E/E’ and LVMI, more accurately to predict the severity of coronary ar- tery calcification. The “composite score” were classified into three groups (score 0, 1, 2) according to the presence of E/E’
≥15 and positive LVH (LVMI ≥90 g/m
2), that each one point was scored; 1. score 0 (E/E’ <15 and LVMI <90 g/m
2), 2.
score 1 (E/E’ <15 and LVMI ≥90 g/m
2or E/E’ ≥15 and LVMI <90 g/m
2), 3. score 2 (E/E’ ≥15 and LVMI ≥90 g/m
2).
ANOVA with Bonferroni test for post hoc analysis and co-
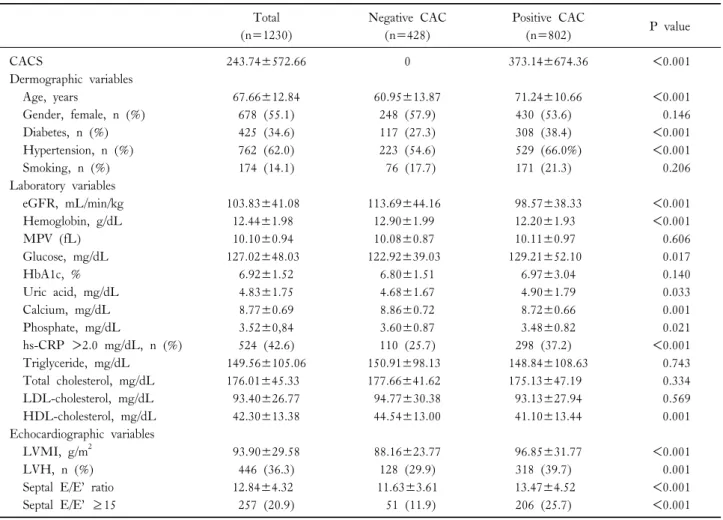
Table 1. Comparison between negative and positive coronary artery calcium (CAC) Total
(n=1230)
Negative CAC (n=428)
Positive CAC
(n=802) P value
CACS 243.74±572.66 0 373.14±674.36 <0.001
Dermographic variables
Age, years 67.66±12.84 60.95±13.87 71.24±10.66 <0.001
Gender, female, n (%) 678 (55.1) 248 (57.9) 430 (53.6) 0.146
Diabetes, n (%) 425 (34.6) 117 (27.3) 308 (38.4) <0.001
Hypertension, n (%) 762 (62.0) 223 (54.6) 529 (66.0%) <0.001
Smoking, n (%) 174 (14.1) 76 (17.7) 171 (21.3) 0.206
Laboratory variables
eGFR, mL/min/kg 103.83±41.08 113.69±44.16 98.57±38.33 <0.001
Hemoglobin, g/dL 12.44±1.98 12.90±1.99 12.20±1.93 <0.001
MPV (fL) 10.10±0.94 10.08±0.87 10.11±0.97 0.606
Glucose, mg/dL 127.02±48.03 122.92±39.03 129.21±52.10 0.017
HbA1c, % 6.92±1.52 6.80±1.51 6.97±3.04 0.140
Uric acid, mg/dL 4.83±1.75 4.68±1.67 4.90±1.79 0.033
Calcium, mg/dL 8.77±0.69 8.86±0.72 8.72±0.66 0.001
Phosphate, mg/dL 3.52±0,84 3.60±0.87 3.48±0.82 0.021
hs-CRP >2.0 mg/dL, n (%) 524 (42.6) 110 (25.7) 298 (37.2) <0.001
Triglyceride, mg/dL 149.56±105.06 150.91±98.13 148.84±108.63 0.743
Total cholesterol, mg/dL 176.01±45.33 177.66±41.62 175.13±47.19 0.334
LDL-cholesterol, mg/dL 93.40±26.77 94.77±30.38 93.13±27.94 0.569
HDL-cholesterol, mg/dL 42.30±13.38 44.54±13.00 41.10±13.44 0.001
Echocardiographic variables
LVMI, g/m
293.90±29.58 88.16±23.77 96.85±31.77 <0.001
LVH, n (%) 446 (36.3) 128 (29.9) 318 (39.7) 0.001
Septal E/E’ ratio 12.84±4.32 11.63±3.61 13.47±4.52 <0.001
Septal E/E’ ≥15 257 (20.9) 51 (11.9) 206 (25.7) <0.001
Data are expressed as mean±SD or n (%).
CACS, coronary artery calcium score; eGFR, estimated glomerular filtration rate; MPV, mean platelet volume; hs-CRP, high sensitivity C-reactant protein; LDL, low density lipoprotein; HDL, high density lipoprotein; LVMI, left ventricular.
variate-adjusted linear regresssion analysis were performed to identify the association of the severity of CACS and
“composite score”. Also, to assess the association with the composite score 2 group according to the CACS severity, multivariate logistic regression analysis adjusted by co-varia- teds was used.
A probability value of a P <0.05 was considered statisti- cally significant. All statistical analyses were performed using Statistical Package for Social Science (SPSS) for windows (version 18.0; SPSS, Inc., Chicago, IL, USA).
RESULTS
The clinical characteristics of study subjects according to positive and negative CAC are shown in Table 1. The mean
age was 67.66±12.84 years, and 678 (55.1%) of subjects were female. In addition, 425 (34.6%) of subjects had dia- betes, 762 (62.0%) hypertension, and 174 (14.1%) smoking.
The average of CACS was 243.74±572.66 and the median was 23.50. The number of negative CAC (CACS=0) group was 428 of 1230 and positive CAC (CACS >0), 802 of 1230. Age was older in positive CAC group (P <0.001).
Diabetes (P <0.001), hypertension (P<0.001), and hs-CRP
>2.0 mg/dL (P<0.001) were more frequent in the positive
CAC group, compared to the negative CAC group. Fasting
glucose (P=0.017), uric acid (P=0.033), LVMI (P <0.001),
septal E/E’ ratio (P <0.001) were higher in the positive CAC
group, compared to the negative CAC group. Conversely,
eGFR (P=0.001), hemoglobin (P <0.001), calcium (P=0.001),
phosphate (P=0.021), and HDL-C (P=0.001) were lower in
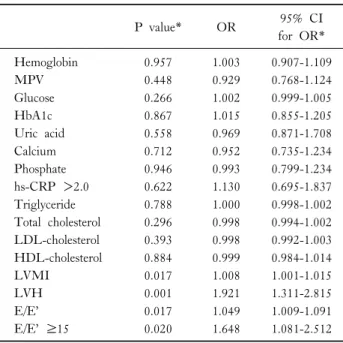
Table 3. Multivariate binary logistic regression analysis of factors associated with severe CACS (CACS >400)
P value* OR 95% CI
for OR*
Hemoglobin 0.957 1.003 0.907-1.109
MPV 0.448 0.929 0.768-1.124
Glucose 0.266 1.002 0.999-1.005
HbA1c 0.867 1.015 0.855-1.205
Uric acid 0.558 0.969 0.871-1.708
Calcium 0.712 0.952 0.735-1.234
Phosphate 0.946 0.993 0.799-1.234
hs-CRP >2.0 0.622 1.130 0.695-1.837
Triglyceride 0.788 1.000 0.998-1.002
Total cholesterol 0.296 0.998 0.994-1.002 LDL-cholesterol 0.393 0.998 0.992-1.003 HDL-cholesterol 0.884 0.999 0.984-1.014
LVMI 0.017 1.008 1.001-1.015
LVH 0.001 1.921 1.311-2.815
E/E’ 0.017 1.049 1.009-1.091
E/E’ ≥15 0.020 1.648 1.081-2.512
CACS, coronary artery calcium score; OR, odds ratio; CI, con- fidence interval; MPV, mean platelet volume; hs-CRP, high sensi- tivity C-reactant protein; LDL, low density lipoprotein; HDL, high density lipoprotein; LVMI, left ventricular mass index; LVH, left ventricular hypertrophy.
*Adjusted by gender, age, diabetes, hypertension, smoking, and es- timated glomerular filter rate.
Table 2. Multivariate binary logistic regression analysis of factors associated with positive CAC (CACS >0)
P value* OR 95% CI
for OR*
Hemoglobin 0.136 0.936 0.857-1.021
MPV 0.105 1.148 0.971-1.356
Glucose 1.001 0.653 0.997-1.004
HbA1c 0.261 1.090 0.938-1.267
Uric acid 0.233 1.064 1.961-1.178
Calcium 0.210 0.869 0.698-1.082
Phosphate 0.635 1.043 0.877-1.247
hs-CRP >2.0 0.088 1.352 0.956-1.910
Triglyceride 0.077 1.001 1.000-1.003
Total cholesterol 0.231 1.002 0.999-1.006 LDL-cholesterol 0.523 0.997 0.989-1.006 HDL-cholesterol 0.018 0.984 0.970-0.997
LVMI <0.001 1.018 1.010-1.026
LVH 0.004 1.693 1.186-2.418
Septal E/E’ ratio 0.002 1.075 1.026-1.126 Septal E/E’ ratio ≥15 0.009 1.808 1.160-2.817 CACS, coronary artery calcium score; OR, odds ratio; CI, con- fidence interval; MPV, mean platelet volume; hs-CRP, high sensi- tivity C-reactant protein; LDL, low density lipoprotein; HDL, high density lipoprotein; LVMI, left ventricular mass index; LVH, left ventricular hypertrophy.
*Adjusted by gender, age, diabetes, hypertension, smoking, and es- timated glomerular filter rate.
the positive CAC group. Two groups did not differ with re- gard to gender, smoking, MPV, HbA1c, TG, total cholester- ol, and LDL-C levels.
In multivarate logistric regression analysis adjusted by gen- der, age, diabetes, hypertension, smoking, eGFR for the asso- ciation between classic risk factors and positive CAC, male (P value=0.015; OR, 1.546, 95% CI, 1.086-2.200), age (P value
<0.001; OR, 1.072, 95% CI, 1.057-1.087), diabetes (P value
<0.001; OR, 2.368, 95% CI, 1.666-3.367), eGFR (P value=
0.002; OR, 0.994, 95% CI, 0.990-0.998) were associated with the positive CAC.
As seen in Table 2, HDL-cholesterol (OR: 0.984, 95%
CI: 0.970-0.997, P=0.018), LVMI (OR: 1.018, 95% CI:
1.010-1.026, P <0.001), LVH (OR: 1.693, 95% CI:
1.186-2.418, P=0.004), septal E/E’ (OR: 1.075, 95% CI:
1.026-1.126, P=0.002), and septal E/E’ ≥15 (OR: 1.808, 95% CI: 1.160-2.817, P=0.009) were independent risk fac- tors of positive CAC, when adjusting for co-variates includ- ing age, gender, diabetes, hypertension, smoking, and eGFR,
but the others not.
Also, in the multivariate logistic regression analysis to as- sess the association with severe CACS (CACS >400) and in- dependent variables (including hemoglobin, MPV glucose, HbA1c, uric acid, calcium, phosphate, hs-CRP >2.0, trigly- ceride, total cholesterol, LDL-cholesterol, HDL-cholesterol, LVMI, LVH, septal E/E’ ratio, and septal E/E’ ratio ≥15), LVMI (OR: 1.008, 95% CI: 1.001-1.015, P=0.017), LVH (OR: 1.693, 95% CI: 1.186-2.418, P=0.004), septal E/E’
(OR: 1.049, 95% CI: 1.009-1.091, P=0.017), and septal E/E’ ≥15 (OR: 1.648, 95% CI: 1.081-2.512, P=0.020) were independent risk factors of severe CACS (Table 3). We additionally evaluated the relationship between log CACS and LVMI, E/E’, and HDL-C. The significant relationship was observed as follows; LVMI (r=0.161, P <0.001), septal E/E’
ratio (r=0.215, P <0.001), and HDL-cholesterol (r=−0.126, P=0.001). After adjusted by age and sex, there still continued the statistic significance; LVMI (r=0.185, P <0.001), E/E’
(r=0.139, P=0.001), and HDL-C (r=−0.108, P=0.008).
Table 4. Linear regression analysis showing the scoring composed of septal E/E’ ratio ≥15 and LVH is a significant independent predictor of coronary artery calcium score
B coefficient (SE) P value*
Composite score 0, 1, 2
†158.244 (27.611) <0.001
*Adjusted by age, sex, diabetes, hypertension, smoking history, es- timated glomerular filter rate. LVH, left ventricular hypertrophy.
†