http://dx.doi.org/10.7848/ksgpc.2016.34.4.443
Landslide Susceptibility Mapping for 2015 Earthquake Region of Sindhupalchowk, Nepal using Frequency Ratio
Yang, In Tae
1)ㆍAcharya, Tri Dev
2)ㆍLee, Dong Ha
3)Abstract
Globally, landslides triggered by natural or human activities have resulted in enormous damage to both property and life. Recent climatic changes and anthropogenic activities have increased the number of occurrence of these disasters. Despite many researches, there is no standard method that can produce reliable prediction.
This article discusses the process of landslide susceptibility mapping using various methods in current literatures and applies the FR (Frequency Ratio) method to develop a susceptibility map for the 2015 earthquake region of Sindhupalchowk, Nepal. The complete mapping process describes importance of selection of area, and controlling factors, widespread techniques of modelling and accuracy assessment tools. The FR derived for various controlling factors available were calculated using pre- and post- earthquake landslide events in the study area and the ratio was used to develop susceptibility map. Understanding the process could help in better future application process and producing better accuracy results. And the resulting map is valuable for the local general and authorities for prevention and decision making tasks for landslide disasters.
Keywords : Landslide, Susceptibility, Mapping, Process, Earthquake, Sindhupalchowk, Nepal
Original article
Received 2016. 07. 26, Revised 2016. 08. 16, Accepted 2016. 08. 31
1) Member, Dept. of Civil Engineering, Kangwon National Univ., Korea (E-mail : [email protected])
2) Corresponding Author, Member, Dept. of Civil Engineering, Kangwon National Univ., Korea (E-mail : [email protected]) 3) Member, Dept. of Civil Engineering, Kangwon National Univ., Korea (E-mail : [email protected])
This is an Open Access article distributed under the terms of the Creative Commons Attribution Non-Commercial License (http://
1. Introduction
Many part of the world are exposed to several types of hazards, each of them have their own spatial characteristics.
Landslides, are major natural geological hazards in hilly regions, responsible for enormous annual property damage involving both direct and indirect costs (Petley, 2012).
Landslides are natural phenomenon, defined as the movement of a mass of rock, debris or earth down a slope (Cruden, 1993). It is a gravitational movement which does not require any transportation medium such as water, air or ice (Crozier, 1986). Landslides are usually classified on the basis of the material involved (rock, debris, earth, mud) and the type of movement (fall, topple, avalanche, slide, flow, spread). Thus, the generic term landslide also refers to mass movements such as rock falls, mudslides and debris flows.
Volcanic mudflows and debris flows are also called lahars.
Shallow landslides usually involve only the soil layer and upper regolith zone, while deep-seated landslides additionally involve bedrock at higher depth. Landslide volume can vary from some tens of cubic meters to several cubic kilometers for giant landslides, while landslide speed may range from a few centimeters per year for slow-moving landslides to tens of kilometers per hour for fast, highly destructive landslides.
According to the state of activity or movement, existing
landslides can be classified as active, dormant (potentially
reactivated) or inactive (often relict or fossil). It can occur
singularly or in groups of up to several thousands. Multiple
landslides, for example, occur almost simultaneously when
slopes are shaken by an earthquake or over a period of hours
or days when failures are triggered by intense rainfall or
snow melting (Guzzetti et al., 2005).
Landslides are triggered by different natural phenomena or human activities or by any combination of these processes.
Natural phenomenon includes meteorological changes, such as intense or prolonged rainfall or snowmelt, rapid tectonic forcing, such as earthquakes or volcanic eruptions, undercutting by rivers or sea waves and permafrost thawing) whereas human activities such as slope excavation and loading (e.g. road and buildings construction, open-pit mining and quarrying), land use changes (e.g. deforestation), rapid reservoir drawdown, irrigation, blasting vibrations, water leakage from utilities etc. (Guzzetti et al., 2005).
More detail on trigging factors can be found in van Asch et al., (2007) and Varnes and IAEG (1984). With increasing anthropogenic activities coupled with heavy and prolonged precipitation have increased the risk of landslides in future.
Disaster events cannot be prevented but the scale of damage can be reduced, which can be done by understanding the mechanism of occurrence, prediction through susceptibility assessment and zonation and early warning system (Dai et al., 2002; Sassa and Canuti, 2008). In such case, preparation of landslide susceptibility zone maps can be an initial step towards mitigation and control. These assessments can help authorities prevent and reduce damage through proper land use management for infrastructural development and environmental protection (Bui et al., 2013). Due to the complex nature of landslides, modeling and developing reliable maps are big challenges among researchers. The best landslide model for an area depends not only on the quality of the data used (Jebur et al., 2014) but also strongly on the employed modeling approaches (Yilmaz, 2009). To address this, a broad range of methods and techniques have been proposed from different points of view to understand their controlling factors and to predict their spatial-temporal distribution.
With the advancement of computing technology and availability of cheap powerful computers, several modeling techniques have been applied for the assessment of landslide susceptibility. These approaches have been applied single, multiple or comparative in different locations by researchers.
This article discusses the process of landslide susceptibility mapping used in the current literatures. Some of the early good reviews on landslide hazard assessments can be found
on: Kanungo et al., (2009), and Pardeshi et al., (2013). Also, a case study of developing landslide susceptibility map in the 2015 earthquake hit region of Sindhupalchowk, Nepal using FR (Frequency Ratio) has been conducted. FR is widely used methodology that could be easily applied in GIS (Geographic Information System) environment. The method has not been used in the area previously.
2. Landslide Susceptibility Mapping
The Landslide susceptibility can be defined as the spatial probability of landslides on the basis of the relationships between distribution and a set of conditioning factors (Guzzetti et al., 2005). Similarly, landslide susceptibility mapping allows for the identification of slopes for which failure probability is high and to consequently make prevention and protection decisions accordingly (Guillard and Zezere, 2012). Landslide susceptibility zonation, which can formally be defined as the division of land surface into near-homogeneous zones and then ranking these according to the degrees of actual or potential hazard due to landslides.
All the available approaches for landslide susceptibility mapping are based upon assumptions that landslides in future are more likely to occur under similar geological, geomorphological, hydrogeological and climatic conditions, which were and are responsible for the occurrence of past and present landslides. Landslides with distinct geomorphological features can be identified, classified and mapped both through field surveys and remote sensing image interpretations and are controlled by identifiable internal factors (i.e., inherent attributes of the ground) known as causative factors, which can also be mapped from field surveys and remote sensing image interpretations.
Landslide susceptibility mapping involves the following methods:
2.1 Selection of study area
Selection of study area will incorporate the available
historical landslide inventory which will train the models
and based on them the susceptible zones are classified. In
various studies, area are selected inside a polygon, watershed
or administrative boundaries based on rainfall or earthquake
events at various scale.
2.2 Landslide inventory preparation
Preparation of a landslide inventory is an essential primary step of any landslide zoning and is a critical requirement in understanding pre- and post- disaster hazard and risk management (Martha et al., 2010). Cruden (1991) defined landslide inventory as ‘the simplest form of landslide information which records the location and where known, the date of occurrence, type of landslides that have left identifiable traces in the area’. Field investigation, examination of historical archives, analysis of stereoscopic aerial photographs, geological and geomorphological field mapping, engineering geological slope investigations, visualization and analysis techniques of satellite images, has been used to detect and prepare inventories. Earlier reviews on landslide inventory maps can be can be found on Guzzetti et al., (2012). Similarly, Xu (2015) has describes the principles for preparing inventory maps of earthquake- triggered landslides, focusing on varied methods and their criteria.
2.3 Spatial database of controlling factors Landslides vary in their morphology greatly and caused by several factors. It is difficult to identify exact factors.
But relationships with various controlling factors can be established with the present and past landslides events. The relationship can help in zonation of different hazard levels.
The controlling factors can be divided into internal (existing) and external (triggering) factors (Crozier, 1986). Internal factors represent the inherent attributes of the ground which reduce the shear stress ratio and makes the slopes susceptible to failures. Their effect are show which could take long period of time. But, the external factors could trigger movement in an instant. Internal factors include geomorphology, lithology of slope material, structural features, vegetation and hydro- geologic conditions, whereas external factors are seismicity, climatic (rainfall) and anthropogenic (landuse) factors.
2.4 Landslide susceptibility modelling and mapping Landslide susceptibility modeling, have experienced extensive development during the last few decades. Many
methods have been carried out in to evaluate landslide susceptibility at the regional and basin scale, road corridor sections and on Himalayas in most landslide prone countries like China, Philippines, India, Indonesia, Pakistan, Nepal, Vietnam, Malaysia, Japan and so on. Following are the broad groups of methods available in literatures (Guzzetti, 2006):
• Geomorphological mapping: Geomorphological mapping of landslide susceptibility is a direct and qualitative method that is subjective based on the ability and judgment of the investigator to recognize actual and potential slope failures, including their evolution and possible consequences.
• Distribution analysis: Distribution analysis are simply analysis of past events inventory by preparing landslide distribution and density maps.
• Heuristic methods: Heuristic methods are indirect qualitative methods that assigns empirical ranking to controlling factors based on prior knowledge.
• Statistical methods: Statistical methods determines the quantitative estimates of spatial distribution of landslides, based on the functional relationships of the past landslide events and set of controlling factors.
• Physically process based models: Process based (deterministic or physically based) models for the assessment of landslide susceptibility rely upon the understanding of the physical laws controlling slope instability.
In recent years, with the availability of many GIS technology and of user friendly statistical packages, statistical models have has been widely used compared to heuristic (knowledge based) approach. It has not only minimized the impact of subjectivity, but also facilitate greater reproducibility.
In literature, frequency ratio, weight of evidence, logistic regression model, decision tree, artificial neural networks, support vector machines etc. are commonly used methods for landslide susceptibly mapping. Single as well as multiple methods for comparison have been applied in various case studies (Hong et al., 2016; Bui et al., 2016; Xu et al., 2016;
Mohammady et al., 2012; Yilmaz, 2010; Pradhan and Lee,
2010). The susceptibility maps are classified in different
categories from low, medium, high, and very high (Guzzetti et al., 1999; Lee and Min, 2001).
2.5 Evaluation and validation
The results from the landslide susceptibility mapping need to be evaluated for accuracy. For this purpose, the collected landslide inventory is itself used by randomly splitting in two groups: one for analysis and one for validation (Regmi et al., 2014; Bui et al., 2014; Xu et al., 2012). The analysis is carried out in part of the study area or model and tested in another with different landslides. In literature, statistically, the accuracy assessment is carried by using error rates, receiver operating characteristics (ROC) curve, success and prediction rate curve and Area under curve (AUC) these curves (Regmi et al., 2014; Lee et al., 2007).
3. Case Study of 2015 Earthquake Region of Sindhupalchowk, Nepal
Nepal was hit by massive two earthquakes on 25
thApril and 12
thMay, 2015 with many aftershocks causing massive loss of lives and damage of properties. Sindhupalchowk and Gorkha district along with Kathmandu valley suffered much loss. The case study area is about 60 km away from capital and remote rural watershed located in Sindhupalchowk district of Nepal. It covers an area of 33 square kilometers, and lies between latitude 27°51'56.00"N to 27°56'38.00"N and
longitude 85°49'18.00"E to 85°52'58.00"E (Fig. 1).
Even though the area is small, the area is sloppy and elevation ranges from 1079 to 3478 meters above sea level.
The climate of the area is subtropical, temperate, and alpine having temperature range of 28.5 to 4.0 degree Celsius and average annual rainfall of 3604.3 millimeters of which 80%
occurring in monsoon season. There is a high chance that the area will suffer from future landslides (Acharya et al., 2015).
The area has six settlement areas inside it and two around the border which are at high risk of landslide at any time.
A total of 65 landslide events were detected in the area.
The methods applied for the development of inventory can be found in Acharya et al. (2016). Out of the total landslides, 75% pixels were randomly selected for calculation of the frequency and remaining 25% were used for the accuracy assessment of the result. The controlling factors play very important role in determining landslide susceptibility.
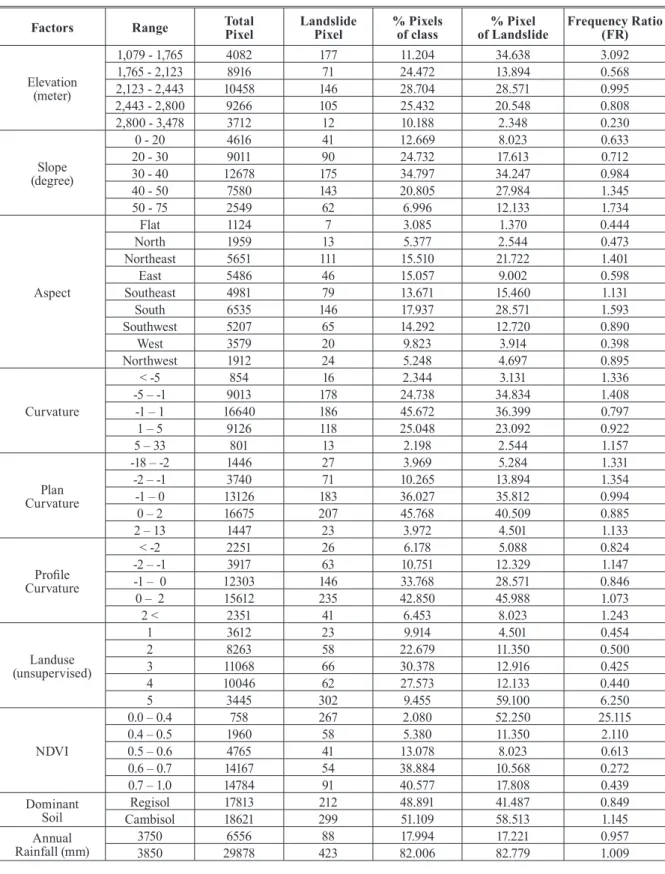
Hence, all the available and derived controlling factors namely: elevation, slope, aspect, curvature, plan curvature, profile curvature, dominant soil and annual rainfall and landuse (unsupervised) and NDVI (Normalized Difference Vegetation Index) derived from Landsat 8 acquired in 07
thOctober, 2015 were used for the mapping. Fig. 2 shows the various controlling factors and their classes used for FR.
The susceptibility of landslide in any region can be estimated on the basis of the contribution of causative factors and the relationship between them. Here, we used the summation of FR of each controlling factors available.
FR is the simplest spatial relationship between landslide occurrence and factors contributing it. It is then used to calculate the ratio of the cells with event occurrence in each class for a reclassified factor or categorical factor (i.e., geology and land use), and the ratio is assigned to each factor class again (Lee and Sambath, 2006). The FR of each factor’s type or class, C, is then expressed by: