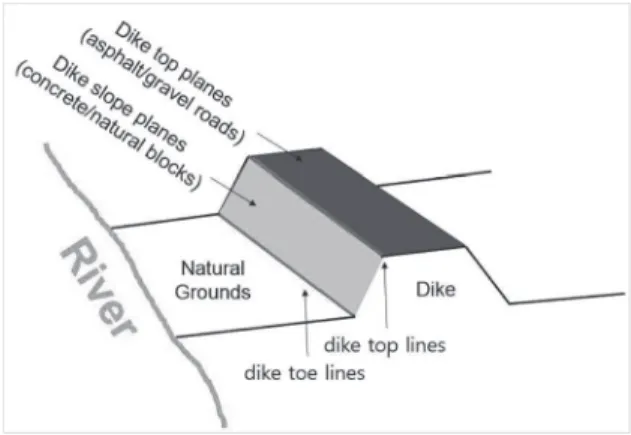
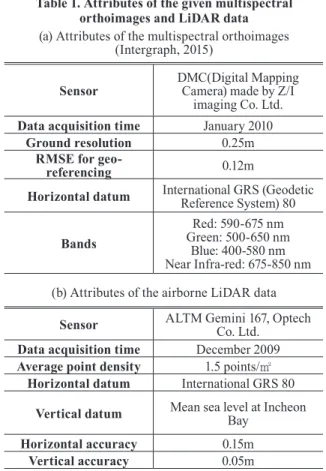
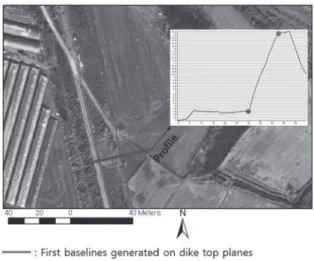
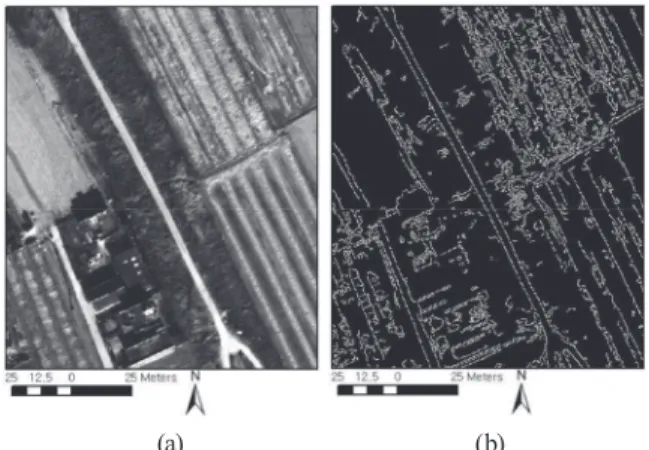
Development of a Dike Line Selection Method Using Multispectral Orthoimages and Topographic LiDAR Data Taken in the Nakdong River Basins
8
0
0
전체 글
(2)
(4)
(5)
(6)
(7)
(8)
수치
+3
관련 문서
1 John Owen, Justification by Faith Alone, in The Works of John Owen, ed. John Bolt, trans. Scott Clark, "Do This and Live: Christ's Active Obedience as the
~ The streak lines can be used to trace the travel of a pollutant downstream from a smoke stack or other discharge. ~ In steady flow, Lagrangian path lines are the same as
95 Effects of the heat treatment of the substrate on residual stress distributions for the case of the deposition of multiple lines and layers
In the heating method by line heating, the initial properties of steel are changed by variables such as temperature, time, and speed. The experimental data
On the basis of the detailed professional studies on the topic of reconciliation for all times and places, I will vision the unified Korea in peace with
Based on the research described above, a work expressing the formative beauty of lines, which is the most basic in calligraphy, was produced by using
As examined above, based on the type changes this study confirmed that <Seoyukyonmunrok> has plenty of 'aaba' type structures and most lines are
For each of several tests, elastic, plastic, and total strain data points are plotted versus life, and fitted lines are also
