1. Introduction
Various researches are being implemented for water quality improvement of rivers and lakes in water system as water quality management of the river is getting major concern due to rapid population growth, economic development, and citification(Gang et al., 1996; Gang and Yang, 1996; Gang and Hyeon, 1997;
Lee et al., 2006; Kim et al., 2009; Park et al., 2011).
Futhermore, water quality management of lake water which is mainly used for drinking water source is highly getting important according as social concern about drinking water increases. Especially, water quality management of the water in dam and the river water flowing into it that are generally used for service water in wide area will be conducted carefully in consideration of hydraulic properties on the lake which are deep and very slow in terms of the speed
Analysis of Water Quality improvement of Upper Stream for the Chung-ju Dam according to Reducing Pollution Using QUAL2E Model
Chang-Wha Han ․ Jong-Seok Park
+․ Jun-Shik Shin ․ Jae-Joo Lee Ui-Gyu Hwang ․ Kyoung-Hoon Rhee
Department of Civil Engineering, Chonnam National University
QUAL2E 모형을 이용한 오염원변화에 따른 충주댐 상류 유역의 수질 개선 효과 분석
한창화 · 박종석+ · 신준식 · 이재주 · 황의규 · 이경훈
전남대학교 토목공학과 수자원·상하수도 연구실
Abstract
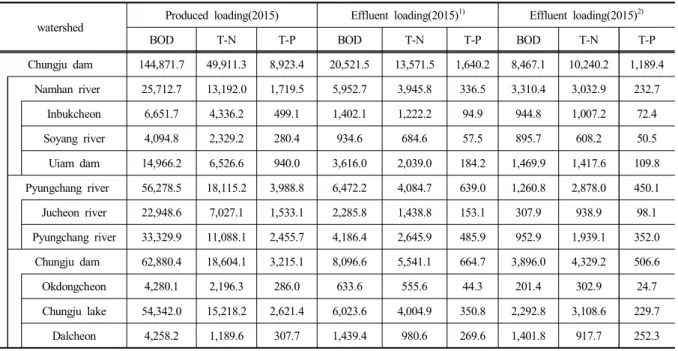
The research grasps water quality contamination source by investigating the data that are superordinate laws and the related plans implemented for establishing water quality improvement measures of upper stream for Chung-Ju Dam, present conditions of the hydraulic and hydrology, the present conditions and plans of environment basic facilities, and present conditions of main contamination source’s occurrence load and discharge load, etc. The research used the QUAL2E simulation which is being widely applied to simulation of river water quality because the QUAL2E has high credibility among water quality simulations known throughout the country. On basis of this research, regulations and politic alternatives are required in order to water quality improvement upper stream for the Chung-ju dam, especially establishing processing facilities in the region where loading amount is concentrated should be considered with the additional research regarding cost-efficient facility of pollution source.
Keywords : Environment facility, Pollutant load, Pollution source, QUAL2E model, Water quality simulation
요 약
본 연구는 충주댐 상류유역의 수질개선대책을 수립하기 위해 실시된 상위 및 관련계획, 수리·수문환경, 환경기초시설 현 황 및 계획, 수질현황, 주요 오염원 발생 및 배출현황 등의 자료조사를 통하여 수질오염원을 파악하고 국내에 알려져 있 는 수질모델 중 신뢰도가 인정되어 하천수질모의에 널리 적용되고 있는 QUAL2E 모형을 적용하였다. 연구 결과를 토대 로 하여 충주댐 상류 유역의 수질개선을 위한 규제와 정책 방안들을 고려한 수질예측이 필요할 것으로 판단되며, 특히 충주댐 상류 유역의 오염원별 수질을 관리하는 방안과 더불어 오염원별 배출부하량이 높은 지역의 대형 환경기초시설에 의한 고도처리시설 도입 및 비점오염 저감시설에 의한 부분을 고려한 추가적인 연구가 필요할 것으로 판단된다.
핵심용어 : 환경기초시설, 오염원, 배출부하, 수질모의, QUAL2E 모형
+ corresponding author email : [email protected]