1. 서 론
최근 중국에서 발생된 극심한 초미세먼지(PM2.5) 오
염이 사회적 이슈로 크게 부각되면서 오염 현상과 원 인, 대책 등 다양한 측면에서 연구가 수행되고 있다 (Jiang et al., 2014; Wang et al., 2014b). 베이징(Beijing) 을 중심으로 발생된 PM2.5 오염이 한반도까지 영향을 미치고 있어 한중일간 국제협력도 한층 강화되고 있는 추세이다. 베이징대학교(Peking University), 중국과학
최근 중국의 초미세먼지 오염 연구 동향 Review on the Recent PM
2.5Studies in China
김유미·김진영·이승복·문길주·배귀남* 한국과학기술연구원 환경복지연구단
(2015년 7월 31일 접수, 2015년 9월 22일 수정, 2015년 10월 7일 채택)
Yumi Kim, Jin Young Kim, Seung-Bok Lee, Kil-Choo Moon and Gwi-Nam Bae* Center for Environment, Health and Welfare Research,
Korea Institute of Science and Technology, Seoul, Korea (Received 31 July 2015, revised 22 September 2015, accepted 7 October 2015)
Abstract
The Korea Ministry of Environment has established an air quality standard for PM2.5 in 2012 and it is effective from January 2015. In this study, we review various aspects of PM2.5 in China, including its measurement, model- ing, source apportionment, and health effect, and suggest future research directions for PM2.5 studies in Korea.
Measurements studies for PM2.5 have examined organic marker compounds and 14C as well as inorganic aerosols for distinguishing sources. Modeling results supported that the control of PM2.5 pollution in big city needs effective cooperation between city and its surrounding regions. The major PM2.5 sources in China have been identified to be secondary sulfur, motor vehicle emissions, coal combustion, dust, biomass burning, and industrial sources, howev- er, they have seasonal dependency. Especially, the severe haze pollution event during January 2013 over eastern and northern China was driven to a large extent by secondary aerosol formation. Short-term exposure to PM2.5 is strongly associated with the increased risk of morbidity and mortality from cardiovascular and respiratory diseases, as well as total non-accidental mortality. Considered previous PM2.5 studies in China, analysis of specific organic species using online measurement, chamber experiment for secondary aerosol formation mechanism, and develop- ment of parameterizing this process in the model are needed to elucidate factors governing the abundance and com- position of PM2.5 in Korea.
Key words : PM2.5, China, Haze, Observation, Modeling, Source apportionment, Health impact
* Corresponding author.
Tel : +82-(0)2-958-5676, E-mail : [email protected] DOI: http://dx.doi.org/10.5572/KOSAE.2015.31.5.411 p-ISSN 1598-7132, e-ISSN 2383-5346
원(Chinese Academy of Sciences, CAS) 등을 중심으로 PM2.5 오염 현상을 규명하려는 연구가 다양하게 수행되 고(Wang et al., 2013a; Zhang et al., 2013b), 스위스 Paul Scherrer Institute(PSI) 등과 국제공동연구도 수행되어 과학적 자료를 생산해내고 있다(Huang et al., 2014b).
독일은행의 홍콩지점에서는 PM2.5 오염 현상을 경제적 관점에서 분석하여 저감 대책을 제안하는 특별보고서 를 2013년 2월 발간하는 등 다양한 이해당사자들이 PM2.5 오염에 적극적으로 관심을 보이고 있다(Deut- sche Bank Market Research, 2013).
우리나라의 경우 PM2.5에 대한 대기환경규제(기준:
연평균 25μg/m3 이하, 24시간 평균 50μg/m3 이하)가 2015년부터 시행되고 있으며, PM2.5에 대한 예보가 본 격적으로 이루어지면서, PM2.5의 배출원을 규명하는 것 은 매우 중요한 과제가 되었다. 따라서 과학적 방법을 기초로 PM2.5 오염에 대응하기 위한 국가적 장기전략 을 수립할 필요가 있다. 중국의 대기오염 관리정책을 포함한 동아시아 지역의 국제협력에 대해서는 한국공 학한림원 연구보고서에 상세하게 기술되어 있다(The National Academy of Engineering of Korea, 2014). 이 연구에서는 중국에서 발생된 PM2.5 오염에 대한 최근 연구결과를 분석하여 발생 원인의 규명과 대책 수립에 대한 시사점을 찾아내고, 향후 한국에서 중점적으로 추 진해야 할 연구 방향을 모색하고자 하였다.
2. 연구 동향
2. 1 연구주제
본 연구에서는 여섯 가지의 주제에 따라 중국 지역 의 PM2.5에 대한 최근 연구동향을 살펴보았다(표 1).
먼저 중국 내 PM2.5에 관한 연구의 리뷰(review) 또는 장기간의 자료를 활용한 추세 분석을 살펴보았다. Pui et al.(2014)은 PM2.5의 관측, 발생원, 시정과 건강 영향 및 저감에 대한 전반적인 연구를 리뷰하였고, Liu et al.
(2014b)은 중국 베이징에서 2004년부터 2012년까지 9 년간의 PM10과 PM2.5의 질량농도 관측을 통하여 일변 화와 계절적 변화를 분석하였다.
PM2.5의 특성을 파악하기 위해 관측과 모델링을 통 한 연구가 중국 내·외의 연구기관에서 활발히 발표되 고 있다. 중국 내 도시와 배경대기 지역에서 PM2.5 질량
농도의 변동성(Wang et al., 2013a; Zhao et al., 2009)과 무기물질 및 유기물질의 화학적 특성에 관한 관측 및 분석 연구(Zhang et al., 2014; Zhao et al., 2013b; Shen et al., 2009; Xu et al., 2005)가 수행되었으며, 더불어 인 공위성 자료를 활용하여 PM2.5 농도를 산정하는 연구도 수행되었다(Ma et al., 2014). 모델링을 활용한 연구는 특정 지역의 오염사례뿐만 아니라(Gao et al., 2014a;
Lang et al., 2013), 중국 전체에 대한 오염물질의 배출 원 지역(source region)간의 이동 및 기후변화에 미치는 영향을 산정하는 연구도 수행되었다(Gao et al., 2014b;
Ying et al., 2014).
관측과 모델링 연구와 더불어 베이징, 상하이(Shang- hai) 및 광저우(Guangzhou) 등지에서 PM2.5의 배출원 기여도를 산정하는 연구(Liu et al., 2014a; Gao et al., 2013; Wang et al., 2013b; Yu et al., 2013; Zhang et al., 2013b)를 통해 그 원인을 규명하려고 노력하고 있다.
중국에서 발생하는 연무(haze) 사례에 관해서는 과 거부터 베이징, 상하이, 항저우(Hangzhou), 샤먼(Xia- men), 광저우 등지에서 연무의 유형, 발생에 미치는 기 상장, 생성 메커니즘, 화학적 특성 등의 연구가 수행되 었다(Zhang et al., 2013a; Huang et al., 2012a; Tan et al., 2011; Xiao et al., 2011; Sun et al., 2006). 특히 2013년 1월 중국의 넓은 지역에 걸쳐 극심한 연무가 발생하면 서 이에 관해 중국 전역에서 활발하게 연구가 이루어 졌다. Jiang et al.(2014)은 74개 도시의 PM2.5와 PM10
의 시간별 질량농도를 분석하여 극심한 연무의 공간적 분포를 파악하였으며, Wang et al.(2014b)은 이러한 연 무가 발생하게 된 기상학적 원인을 규명하였다. Huang et al.(2014a, b)은 연무의 화학적 특성과 배출원 기여 도를, Wang et al.(2014a)은 물리적 특성을, 그리고 Che et al.(2014)은 광학적 특성을 살펴보았다. 이러한 지상 관측과 더불어 Wang et al.(2014c)의 경우 관측결과를 활용하여 모델을 평가하였다. 이러한 PM2.5가 사람의 건강에 어떠한 영향을 미치는지에 대한 연구도 진행되 고 있다(Cheng et al., 2013).
2. 2 연구기관
중국에서 초미세먼지에 관한 연구는 공공기관, 대학 및 외국기관과의 협력으로 이루어지고 있다. 대표적인 중국 내 기관으로는 중국과학원과 중국기상국(China Meteorological Administration)을, 대학으로는 베이징
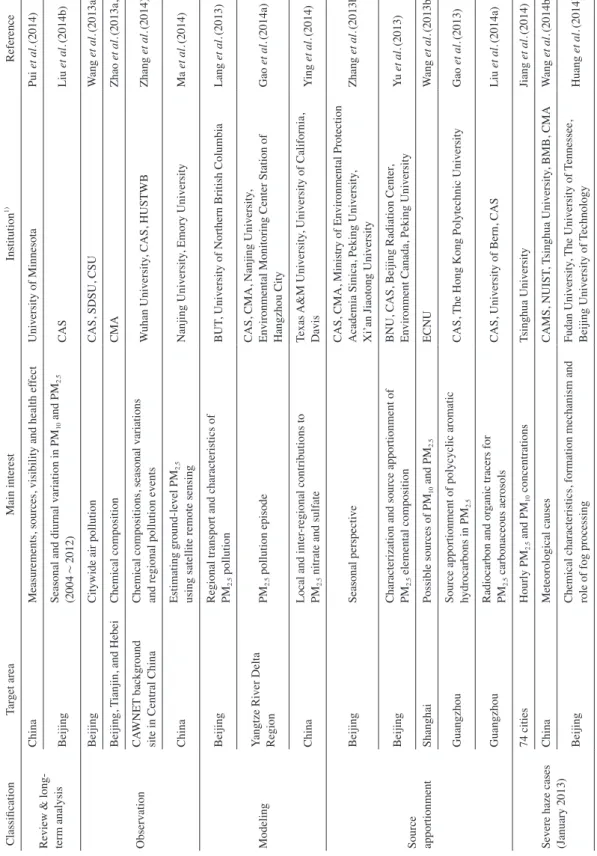
Table 1. Classification of PM2.5 studies in China. Classification Target area Main interest Institution1) Reference Review & long- term analysis
ChinaMeasurements, sources, visibility and health effectUniversity of MinnesotaPui et al.(2014) Beijing Seasonal and diurnal variation in PM10 and PM2.5 (2004~2012)CASLiu et al.(2014b) Observation
BeijingCitywide air pollutionCAS, SDSU, CSUWang et al.(2013a) Beijing, Tianjin, and HebeiChemical compositionCMAZhao et al.(2013a, b) CAWNET background site in Central ChinaChemical compositions, seasonal variations and regional pollution eventsWuhan University, CAS, HUSTWBZhang et al.(2014) ChinaEstimating ground-level PM2.5 using satellite remote sensingNanjing University, Emory UniversityMa et al.(2014) Modeling
BeijingRegional transport and characteristics of PM2.5 pollutionBUT, University of Northern British ColumbiaLang et al.(2013) Yangtze River Delta RegionPM2.5 pollution episodeCAS, CMA, Nanjing University,
Environmental Monitoring Center Station of Hangzhou City Gao et al.(2014a) ChinaLocal and inter-regional contributions to PM2.5 nitrate and sulfateTexas A&M University, University of California, DavisYing et al.(2014)
Source apportionment
BeijingSeasonal perspective
CAS, CMA, Ministry of Environmental Protection Academia Sinica, Peking University
, Xi’an Jiaotong UniversityZhang et al.(2013b) BeijingCharacterization and source apportionment of PM2.5 elemental compositionBNU, CAS, Beijing Radiation Center, Environment Canada, Peking UniversityYu et al.(2013) ShanghaiPossible sources of PM10 and PM2.5ECNUWang et al.(2013b) Guangzhou
Source apportionment of polycyclic aromatic hydrocarbons in PM
2.5CAS, The Hong Kong Polytechnic UniversityGao et al.(2013) GuangzhouRadiocarbon and organic tracers for PM2.5 carbonaceous aerosolsCAS, University of Bern, CASLiu et al.(2014a) Severe haze cases (January 2013)
74 citiesHourly PM2.5 and PM10 concentrationsTsinghua UniversityJiang et al.(2014) ChinaMeteorological causesCAMS, NUIST, Tsinghua University, BMB, CMAWang et al.(2014b) BeijingChemical characteristics, formation mechanism and role of fog processingFudan University, The University of Tennessee, Beijing University of TechnologyHuang et al.(2014)
Table 1. Classification of PM2.5 studies in China. Classification Target area Main interest Institution1)Reference Severe haze cases (January 2013) Beijing, Shanghai, Guangzhou, Xi’an
Secondary aerosol contributionPSI, CAS, University of Bern, The CUHK, University of Milano Bicocca, GmbH-HICE, University of RostockHuang et al.(2014b) Yangtze River Delta
Mechanism for the formation and microphysical characteristics
Nanjing University, Jiaxing Environmental Monitoring Station, CASWang et al.(2014a) ChinaEnhanced sulfate missing from current models
Tsinghua University, Texas A&M University at Galveston, State Environmental Protection Key Laboratory of Sources and Control of Air Pollution Complex, Dalhousie University
Wang et al.(2014c) Health effects
Beijing, Shanghai, Xi’an, Chongquing, Guangzhou, Shenyang
Total, cardiovascular, and respiratory mortalityUniversity of Minnesota, Fudan UniversityChen et al.(2011) Geng et al.(2013) Huang et al.(2009) Yang et al.(2012) Shanghai, Shenyang, Xi’an, GuangzhouMortality classified by various effect modifiersFudan UniversityDai et al.(2004) Ma et al.(2011) Huang et al.(2012b) Yang et al.(2012) 1) Abbreviation of each institution is as follows: BARI: Beijing
Automobile Research Institute Co. Ltd., BIT: Beijing Institute of Technology, BMB: Beijing Meteorological Bureau, BNU: Beijing Normal University, BUT: Beijing University of Technology, CAS: Chinese Academy of Sciences, CATRC: China Automobile Technology and Research Center, CIT: California Institute of Technology, USA, CAMS: Chinese Academy of Meteorological Sciences, CMA: China Meteorological Administration, CNEMC: China National Environmental Monitoring Center, CUIT: Chengdu University of Information Technology, CUHK: The Chinese University of Hong Kong, ECNU: East China Normal University, GIT: Georgia Institute of Technology, USA, HUSTWB: Huazhong University of Science and Technology Wuchang Branch, NASA/GSFC: The National Aeronautics and Space Administration/Goddard Space Flight Center, NUIST: Nanjing University of Information Science & Technology, SEPKLSCAPC: State Environmental Protection Key Laboratory of Sources and Control of Air Pollution Complex, SDSU: San Diego State University, USA, USTL: Université des Sciences et Technologies de Lille, UW-M: University of Wisconsin-Madison, USA, XJU: Xi’an Jiaotong Univeristy, GmbH- HICE : Helmholtz Zentrum München, German Research Center for Environmental Health (GmbH), Joint Mass Spectrometry Centre, Cooperation Group Comprehensive Molecular Analytics and Helmholtz Virtual Institute of Complex Molecular Systems in Environmental Health—Aerosol and Health (HICE), PNL: Pacific Northwest National Laboratory, PSI: Paul Scherrer Institute
Table 1. Continued.
대학교, 칭화대학교(Tsinghua University), 난징대학교 (Nanjing University) 및 푸단대학교(Fudan University) 를 들 수 있다.
중국과학원은 1949년 11월 베이징에 설립된 기초과 학연구의 중심기관으로 베이징에 본부가 있으나 부속 기관들은 각처에 산재되어 있다. 2012년 말까지 11개 의 분소들(management organizations)은 선양(Shen- yang), 창춘(Changchun), 상하이, 난징(Nanjing), 우한 (Wuhan), 광저우, 청두(Chengdu), 쿤밍(Kunming), 시안 (Xi’an), 란저우(Lanzhou)와 신장(Xinjiang)에 위치해 있으며, 104개 연구기관(research institutes), 2개 부속 대학교(University of Science and Technology of China, University of Chinese Academy of Sciences), 기타 정 보기관, 기술지원센터 및 출판보도국으로 구성되어 있 다(www.cas.cn).
중국과학원에는 6개의 학술부문(academic divisions) 이 있는데, 이것은 수학과 물리, 화학, 생명과학과 의료 과학, 지구과학, 정보기술과학 및 기술과학이다(그림 1).
이 중 초미세먼지와 관련하여 주로 Institute of Atmos- pheric Physics에서 연구를 수행 중이며, 이 외에도 Ins-
titute of Geographic Sciences and Natural Resources Research, Guangzhou Institute of Geochemistry, Insti- tute of Earth Environment에서 연구를 수행하고 있다.
중국기상국은 1949년에 설립되어 기상 관련 연구와 정책수립 등을 관장하는 국무원 직속 사업 단위의 하 나로 본사는 베이징에 위치하고 있다(www.cma.gov.
cn). 기상서비스뿐만 아니라 기상/기후와 관련된 연구 를 수행하며, 타 기관 및 대학 등과 협력하고 있다.
대학의 경우 베이징대학교의 College of Environ- mental Sciences and Engineering(http://en.cese.pku.
edu.cn/index.php), 칭화대학교의 School of Environ- ment(http://www.tsinghua.edu.cn/publish/enven/), 난징 대학교의 School of the Environment(http://hjxy.nju.
edu.cn/en_wbe/), 푸단대학교의 School of Public Health (http://sph.fudan.edu.cn/)에서 초미세먼지의 특성 및 건강 영향에 대한 연구를 수행하고 있다.
2. 3 연구기법
중국에서 PM2.5 질량농도 측정은 주로 tapered ele- ment oscillating microbalance(TEOM) 방법 또는 beta- Fig. 1. CAS Organization structure(http://english.cas.cn/ACAS/).
CAS Organizational structure
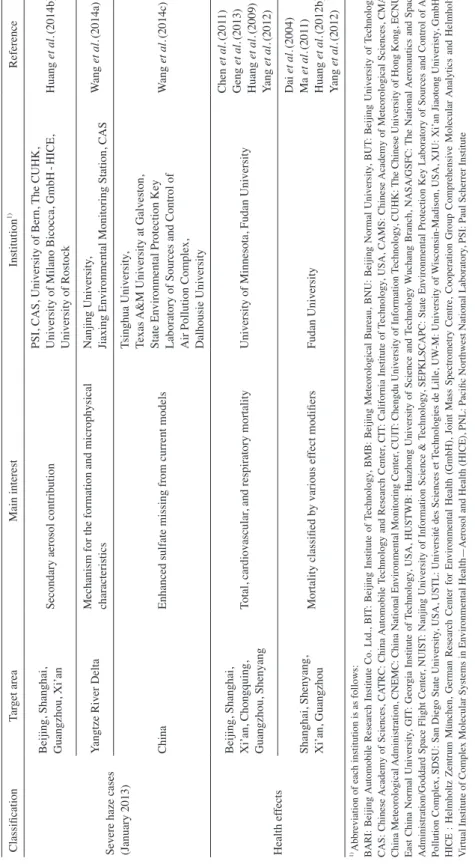
attenuation 방법으로 이루어지고 있다. 그림 2는 중국 113개 도시의 835개 PM2.5 모니터링 사이트의 분포를 나타낸 것이다(Ma et al., 2014). Ma et al.(2014)은 관 측 지역이 주요 도시에 몰려있어 시골 지역은 상대적 으로 적은 것을 지적하면서 위성의 에어로졸 광학두께 (aerosol optical depth)와 통계 모델(national-scale geo- graphically weighted regression model)을 활용한 지상 PM2.5 질량농도 추정 방법을 제시하고 있다.
표 2는 PM2.5의 화학적 특성의 측정 및 분석 방법을 정리한 것이다. 양이온과 음이온 측정은 샘플링된 필터 를 추출하여 ion chromatography(IC)로 분석하며, 유 기 탄소(organic carbon, OC)와 원소 탄소(element car- bon, EC)는 thermal optical carbon analyzer를 사용하여 thermal-optical reflectance(TOR) 또는 thermal-optical transmittance(TOT) 방법으로 분석하였다. 또한, 미량 원소들(trace elements)은 inductively coupled plasma- atomic emission spectroscopy(ICP-AES), inductively coupled plasma-mass spectrometry(ICP-MS), energy dispersive X-ray fluorescence(ED-XRF) 및 particle induced X-ray emission(PIXE) 분석방법 등을 활용하
여 개별 화학조성들의 질량농도를 분석하고 있다. 더 불어 유기성분의 화학조성을 정량 분석하기 위해 필터 샘플링 결과를 thermal desorption gas chromatography time of flight mass spectrometry(TD-GC-MS) 방법이 나 online 또는 offline의 aerosol mass spectrometer (AMS)를 운영하여, 세부 유기물 특성을 분석하고 발 생원을 알 수 있는 지표(marker)를 찾아내는 연구에 활용하고 있다. 방사성 탄소(radiocarbon, 14C)는 mini radiocarbon dating system(MICADAS)으로 분석되어 발생원의 추정에 활용되고 있다.
PM2.5의 수치모의에 관한 연구는 주로 지역적 규모를 모의하는 U.S. Environmental Protection Agency(EPA) 의 community multi-scale air quality(CMAQ) 모델을 활용하여 진행되고 있으며(Ying et al., 2014), 전지구 모델인 GEOS-Chem 역시 활용되고 있다. 모델링과 더 불어 PM2.5의 발생원을 추정하기 위해 화학조성 자료 의 PCA(principal component analysis) 분석이나 기상 장을 활용한 군집 분석 방법 및 PSCF(potential source contribution function)가 수행되고 있다. 더불어 com- plementary bilinear receptor models인 CMB(chemical Fig. 2. Spatial distribution of PM2.5 monitoring sites. There are 835 monitoring sites in 113 cities. It should be noted that the monitoring sites are clustering in the urban areas of major cities whereas rural areas have little coverage.
Many monitoring sites are overlaid in this map(Ma et al., 2014).
75°E 90°E 105°E 120°E 135°E
90°E 105°E 120°E 40°N
30°N
20°N
40°N
30°N
20°N
South China Sea
Kilometers
Elevation(m)
Ground PM2.5 Monitoring Sites 50km×50km Grid
<500 500-1000 1000-1500 1500-2000 2000-2500 2500-3000 3000-3500 3500-4000 4000-4500 4500-5000
>5000 0 250 500 1000 1500
mass balance) 모델과 PMF(positive matrix factoriza- tion) 모델이 활용되고 있다(Liu et al., 2014a; Gao et al., 2013; Wang et al., 2013b; Yu et al., 2013; Zhang et al., 2013b).
건강 영향(health effect)의 경우 PM2.5, SO2, NO2 자 료와 사망률 관련 자료 및 기상장 자료(일평균 기온과 상대습도)를 통계 모델의 입력자료로 활용하여 결과를 산출한다. 통계 모델은 연구에 따라 partial autocorrela- tion function(PACF)을 활용한 선형(linear) 모델이나 (Chen et al., 2011), log-linear 모델(Huang et al., 2012b;
Huang et al., 2009), lag non-linear 모델(Geng et al., 2013), generalized additive model(GAM) (Dai et al., 2004)을 이용하며 시간-층화된(time-stratified) 환자교 차(case-crossover) 연구방법도 제안되었다(Yang et al., 2012; Ma et al., 2011).
2. 4 연구결과
2. 4. 1 관측 연구
베이징의 경우 2004년부터 2012년까지 9년간의 평
균 PM2.5 농도는 72.3±54.4μg/m3이며, 연평균 농도는 다소 감소하는 경향을 보였다(Liu et al., 2014b). 반면 Jiang et al.(2014)은 베이징에서 2012년부터 2013년까 지 PM2.5 질량농도가 증가하는 경향이었다고 보고하였 다. PM2.5의 일변동은 오전 7시부터 8시 사이와 저녁 7 시부터 11시 사이에 피크를 보이는 이산형 분포를 보 였다(그림 3) (Liu et al., 2014b).
2009년부터 2010년의 경우 베이징, 텐진(Tianjin), 스자좡(Shijiazhuang) 지역의 PM2.5 질량농도를 비교한 경우 샘플링 날들의 90% 이상의 날짜에서 50μg/m3을 넘었으며, 스자좡의 연평균 농도가 가장 높게 나타났 다(Zhao et al., 2013a). 지역적 배경대기 지역인 China Atmosphere Watch Network(CAWNET)의 한 사이트 인 진사(Jinsha)의 경우, 2012년 3월부터 2013년 3월까 지 연평균 PM2.5 질량농도는 48.7±26.9μg/m3으로 중 국대기환경기준(35μg/m3)을 초과하였다(Zhang et al., 2014). 계절적으로는 겨울, 가을, 봄, 여름 순으로 질량 농도가 높게 나타났다.
네 도시 지역들(Beijing, Tianjin, Shijiazhuang과 Chengde)과 지역적 배경대기 측정소인 샹단지(Shang- Table 2. Summary of chemical observation and analysis methods.
Measurement Method Note Reference
Ions Ion chromatography
Anions: SO42-, NO3-, Cl-, F-, Cl-, oxalate, and methanesulfonate Cations: K+, Na+, Mg2+, Ca2+, and NH4+
Zhao et al.(2013a) Zhang et al.(2014) Huang et al.(2014a, b) Zhang et al.(2013b) OC&EC Thermal optical carbon analyzer
TOR Zhao et al.(2013a)
Zhang et al.(2013b)
TOT Zhang et al.(2014)
Huang et al.(2014b) Trace elements
ICP-AES ICP-MS ICP-OES ED-XRF
PIXE analytical method
Al, Si, P, S, Cl, K, Fe, Na, Mg, K, Ca, Ba, Ti, Mn, Co, Ni, Cu, Zn, As, Pb, Mo, Cd, Sn, Sr, Sb, Pb, Tl, Ge, Cs, Ga, V, Cr, As, Se, Ba, and Rb
Zhao et al.(2013a) Zhang et al.(2013b) Huang et al.(2014a, b) Yu et al.(2013) Organic markers Thermal desorption gas chromatography
time of flight mass spectrometry
(TD-GC-MS) method Sugars, hopanes, PAHs Huang et al.(2014b)
Radiocarbon(14C) MICADAS Huang et al.(2014b)
Chemical components of single particles
HR-ToF-AMS(Offline AMS) Organic aerosol high resolution
mass spectra Huang et al.(2014b)
SPAMS manufactured by Hexin
Analytical Instrument Co., Ltd. 0.2~2.0μm Wang et al.(2014a)
dianzi)의 2009년부터 2010년까지 측정결과에 따르면, 이차 무기 이온들(secondary inorganic ions; NH4+, NO3-, SO42-의 합)이 가장 주요한 성분으로 PM2.5의 24
~43% 정도를 차지하였으며, 네 계절 중 여름에 강 한 광화학 산화로 인해 높게 나타났다(그림 4)(Zhao et al., 2013a). 다섯 지역 모두 OC와 EC가 봄과 여름 Fig. 3. PM2.5 concentration in relation to month and local time. The red bars at top denote mean PM2.5 over the entire
period 2004 to 2012 for each hour(month). The blue curves denote PM concentration trend in Beijing from 2004 to 2012(Liu et al., 2014b).
PM2.5(μg/m3)
Local time(hour) PM2.5(μg/m3)
PM2.5(μg/m3) PM2.5 trend (μg/m3/yr) 90
80 70 60 Dec Nov Oct Sep Aug Jul Jun May Apr Mar Feb Jan 110 105 100 95.0 90.0 85.0 80.0 75.0 70.0 65.0 60.0 55.0 50.0
Dec Nov Oct Sep Aug Jul Jun May Apr Mar Feb Jan 2 4 6 8 10 12 14 16 18 20 22 24
2 4 6 8 10 12 14 16 18 20 22 24 50 60 70 80 90 - 4 0 4 0
- 1 - 2
Fig. 4. Seasonal concentrations of secondary inorganic ions, total carbon(TC), and crustal elements at Beijing(BJ), Tianjin(TJ), Shijiazhuang(SJZ), Chengde(CD), and Shangdianzi(SDZ) (Zhao et al., 2013a).
Seasonal concentrations (μg/m3)
Sampling sites
SDZ BJ TJ SJZ CD Secondary inorganic ions TC Crustal elements
Spring Summer Autumn Winter Spring Summer Autumn Winter Spring Summer Autumn Winter Spring Summer Autumn Winter Spring Summer Autumn Winter
100 80 60 40 20 0
에 가을과 겨울보다 낮았으며, 이것은 난방이나 연료 연소 사용 증가에 기인한다. OC/EC 비율은 여름에 가 장 낮고 겨울에 가장 높게 나타났다. 더불어 SOC(sec- ondary organic carbon) 또한 가을과 겨울에 높고 여름 에 가장 낮았다. 이것은 안정적 대기 상태와 낮은 온도 가 겨울과 가을에 더 빈번히 나타나므로 오염물질이 적체되며 휘발성 유기화합물(volatile organic com- pounds)의 흡수나 응결이 가속되기 때문이다. 베이징 의 EC 농도의 경우 난방을 위한 석탄 연소의 배출 감 소로 인해 지난 십 년간(1999~2009년) 감소 경향이 관측되었다(Zhao et al., 2013b). 지각 원소(Al, Ca, Fe, Mg, Ti, Ba와 Sr)는 봄과 가을에 떠있거나 날리는 먼지 (dust)로 인해 높았으며, 중금속(heavy metals)은 샹단 지에 비해 베이징, 텐진 및 허베이(Hebei) 지역이 더 높았다.
2. 4. 2 모델링 연구
모델링을 통한 연구는 초미세먼지의 이동 및 발생 과정을 규명하는데 유용한 결과를 내고 있다. Lang et al.(2013)에 따르면 베이징 지역에서 연평균 전체 월 경성 영향이 PM2.5, 황산염(sulfate), 질산염(nitrate)과 암모늄(ammonium)이 각각 42.2%, 46.3%, 77.4%, 그 리고 61.6%로 나타났으며, 고농도 오염 사례의 경우 그 영향이 더 증가하여 베이징 지역의 PM2.5를 제어하 기 위해서는 인근 주변지역의 협조가 필요함을 밝히고 있다.
항저우의 2011년 12월 8일~16일에 나타난 PM2.5
오염사례의 경우 에어로졸 진행 과정(생성, 이류, 침적 등)의 분석을 통해 살펴볼 때, 일차와 이차 PM2.5 농도 에 배출량과 에어로졸 과정 모두 기여함을 알 수 있었 다. 이류과정(the process of advection)은 질량을 증가 시켰으며, 확산과정이 가장 두드러진 제거과정이었다.
건조와 습윤 침적과 비균질 과정도 PM2.5 제거에 영향 을 미쳤다. PM2.5 농도가 가장 높게 나타난 날은 확산 을 통한 제거과정이 비효율적이었기 때문인 것으로 밝 혀졌으며, 항저우 외부 지역에서 발생한 오염물질 역 시 항저우의 PM2.5 농도를 증가시켰을 뿐만 아니라 기 간도 연장시켰다(Gao et al., 2014a).
Ying et al.(2014)은 CMAQ 모델의 배출원 지역을 북중국, 북동중국, 동중국, 중앙중국, 남중국, 남서중국, 북서중국과 나머지 지역 등 총 8개 영역으로 나누어
각각의 배출원에서 배출된 물질이 타 지역으로 이동하 여 PM2.5의 황산염과 질산염 농도에 어떠한 영향을 미 치는지 살펴보았다(그림 5). 2009년 1월의 모의 결과 에서 쓰촨 분지(Sichuan Basin)뿐만 아니라 화베이 평 원(North China Plain, NCP)과 중하 양쯔 평원(Middle and Lower Yangtze Plain, MLYP)에서 고농도 질산염 이 나타났다(그림 6). 북, 중앙 그리고 동중국으로부터 배출된 NOx는 장거리를 이동하여 NCP와 MLYP 지역 에서 다소 균일한 질산염 농도를 형성하였으며, 남중국 의 주강삼각주(Pearl River Delta, PRD) 지역까지 질산 염 농도에 중요한 영향을 미쳤다. 겨울에 황산염 농도 는 질산염보다 더 넓은 공간적 분포를 보였다. 이것은 SO2의 체류시간(life time)이 더 길기 때문이다. 2009년 8월에는 느린 북풍과 북동풍이 배출원 지역 간 이동을 감소시켰다. 질산염과 황산염 농도는 북중국에서 최고 치를 나타냈는데, 이것은 더 북쪽에 위치한 산들에 의 해 확산이 심각하게 제한되었기 때문이다.
질산염과 황산염 농도가 상위 5위에 드는 지방들 (Chongqing, Sichuan, Guizhou, Anhui와 Hunan)은 모 두 북, 중앙과 동중국의 배출량에 영향을 받았으며, 더 불어 그들의 국지적 배출량에 영향을 받았다. 상위 다 섯 곳 중 세 지방(Tianjin, Hebei와 Beijing)은 북중국 에 위치하며 국지적 기여가 55% 이상으로 나타났다.
북중국 배출이 다른 두 지방(Shandong in East China, Henan in Central China)의 오염도에 미치는 기여도는 20% 정도로 계산되었다. 북중국의 배출량과 더불어 상 위 다섯 곳 중 네 지방(Tianjin, Henan, Hebei, Shan- Fig. 5. Emission source region designation and abbre
viation of 34 provincial level divisions(Ying et al., 2014).
North Northeast EastCentral South Southwest Northwest
dong)은 30% 또는 그 이상 동중국 배출량의 영향을 받 았다. 세 지역의 대규모 도시들(Beijing, Shanghai와 Chongqing)과 큰 도시 집단(PRD)도 여름보다 겨울에 더 강하고 빈번하게 외부 지역의 영향을 받았다. 비록 도시들이 대개 국지적 배출량에 주로 영향을 받지만 배출원 지역별 이동에 의한 영향은 특히 겨울에 PRD 지역의 황산염 농도에 대해 뚜렷하게 나타나며, 전체
농도의 80% 이상이 북, 동 그리고 중앙 중국의 배출량 에 영향을 받았다.
2. 4. 3 배출원 기여도 산정 연구 (source apportionment study)
베이징 지역의 경우 PM2.5 질량농도의 계절 변동성 과 일변동성은 대기경계층과 배출원의 배출량에 영향 Fig. 6. Regional contributions to average primary and secondary PM2.5 nitrate and sulfate in January, 2009. Units are
μg/m3. The scales of the panels are different to better illustrate spatial distribution(Ying et al., 2014).
Primary Nitrate Primary Sulfate Secondary Nitrate Secondary Sulfate
North
Northeast
East
Central
South
Southwest
Northwest
Other 8 Source regions
0 0.02 0.04 0.06 0.08 0.1 0 0.2 0.4 0.6 0.8 1 0 2 4 6 8 10 0 2 4 6 8 10
을 받으며, 교통량과 연소 배출의 영향이 가장 주요한 영향으로 나타났다. 기상학적으로는 베이징 남쪽에 위 치한 이차 에어로졸의 발원지에서 기원하는 남풍계열 의 바람과 관련성이 높았다(Liu et al., 2014b).
Yu et al.(2013)은 베이징 지역 PM2.5의 배출원 기여 도를 산정하기 위해 PMF 모델 내 주요 배출원을 이차 생성 황(secondary sulfur), 차량 배출(vehicle exhaust), 화석연료 연소(fossil fuel combustion), 도로 먼지(road dust), 바이오매스 소각(biomass burning), 토양 먼지 (soil dust), 그리고 금속 가공업(metal processing) 등 총 일곱 가지로 나누었다(그림 7). 연평균 기여도는 26.5
%, 17.1%, 16.0%, 12.7%, 11.2%, 10.4%, 그리고 6.0%
로 나타났으며, 계절별로 차이를 보였다. 봄은 토양 먼 지와 도로 먼지가 20.7%로 가장 높은 기여도를 보였 으며, 다른 계절에 비해 2배 이상 높았다. 연소와 관련 하여 가을과 겨울이 다른 두 계절에 비해 기여도가 높 았으며, 이차 생성 황은 여름에 주된 기여도를 보였다.
차량과 금속 가공은 뚜렷한 계절적 차이를 보이지 않 았다.
Zhang et al.(2013b) 역시 PMF 모델을 활용하여 베 이징 지역의 배출원을 토양 먼지, 석탄 연소(coal com- bustion), 바이오매스 소각, 차량(traffic)과 폐기물 소각 장 배출(waste incineration emission), 산업 오염(indus- trial pollution), 그리고 이차 무기 에어로졸(secondary
inorganic aerosol) 등 총 여섯 가지로 나누어 각각의 연 평균 기여도를 16%, 14%, 13%, 3%, 28%, 그리고 26%
로 산정하였다. 계절별 기여도 차이를 살펴보았을 때, 봄에는 토양 먼지(23%)와 차량과 폐기물 소각장 배출 (5%)이, 겨울에는 석탄 연소(57%), 가을에는 산업 오 염(42%), 그리고 여름에는 이차 무기 에어로졸(54%) 이 높게 나타났다. 더불어 PSCF 분석으로 베이징 남쪽 지역이 모든 물질의 주요한 배출원 지역으로 나타났으 며, 이차 무기 에어로졸과 유기 에어로졸과 같이 인위 적 물질은 동쪽 지역이 중요하게 나타났다. 북서쪽은 자연 기원 먼지(dust)나 인위적 유기 에어로졸의 배출 원 지역으로 분석되었다.
베이징과 근처 다른 지역의 석탄 연소와 차량 배출 기여도를 살펴보면, 스자좡과 청더(Chengde)에서는 주 요 배출원이 석탄 연소이며, 텐진에서는 석탄 연소와 차량 배출이 모두 중요한 배출원으로 나타났다. 하지 만 베이징의 경우 최근 석탄 사용의 감소와 차량의 급 격한 증가로 인해 차량 배출이 더 주요한 요인으로 나 타났다. 샹단지는 남쪽 도시로부터 이동해오는 오염물 질이 주요 원인으로 나타났다(Zhao et al., 2013a). 상하 이의 경우 주로 산업 활동(industrial activities), 석탄 연소(coal combustion)와 차량 배출원이 주로 기여하 였다(Wang et al., 2013b).
이와 더불어 세부 유기물질 분석이 가능해지면서 이 Fig. 7. Seasonal and annual average source contributions to PM2.5 mass in Beijing from January 1 to December 31,
2010(Yu et al., 2013).
Source contributions (μg/m3)
Secondary sulphur,
26.5%
Metal processing,
6.0% Fossil fuel combustion,
16.0%
Biomass burning, 11.2%
Road dust, 12.7%
Soil dust, 10.4%
Vehicle exhaust,
17.1%
Annual percentages of sources
Spring Summer Fall Winter Annual Secondary sulphur 12.1 19.5 13.9 9.9 13.8
Vehicle exhaust 9.3 8.7 8.2 9.5 8.9
Soil dust 10.6 3.0 4.9 3.2 5.4
Road dust 10.1 6.2 5.4 4.7 6.6
Biomass burning 4.1 5.8 6.1 7.1 5.8
Fossil fuel combustion 5.5 2.2 8.1 17.4 8.3 Metal processing 3.4 3.6 2.9 2.5 3.1
60.0 50.0 40.0 30.0 20.0 10.0 0.0
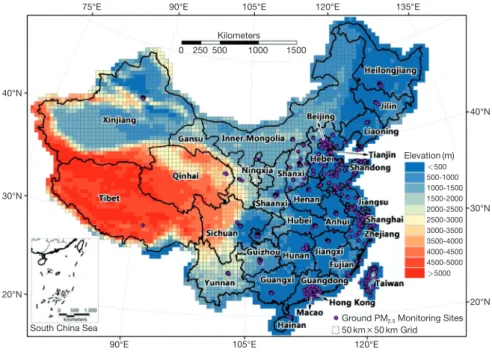
에 대한 배출원 기여도를 산정하는 연구가 최근 이루 어지고 있다. Gao et al.(2013)이 광저우에서 관측한 다 환방향족 탄화수소(polycyclic aromatic hydrocarbons, PAHs)의 배출원을 PMF로 추정한 결과에 의하면, 전 체 PAHs와 세 종류의 PAHs의 배출원 기여도에 차이 를 보였다(그림 8). Pyrene의 경우 바이오매스 소각이 가장 크게 기여하였으나, 분자량이 증가할수록(예, benzo[g,h,i]perylene) 바이오매스 소각의 영향은 덜 중 요한 반면, 석탄 연소가 더 중요한 영향을 끼쳤다. Liu et al.(2014a)는 14C 분석과 세 가지 당무수물 이성질체 (three anhydrosugar isomers: levoglucosan, galactosan 과 man nosan)를 활용하여 바이오매스 소각과 화석연 료의 기여도를 나누었고, 광저우에서 이차 유기 탄소 (secondary organic carbon)의 33%가 화석(fossil) 기원 임을 밝혔다.
2. 4. 4 2013년 1월에 발생한 극심한 연무 사례 2013년 1월 중국에서 발생한 극심한 연무에 대한 특 성 분석 및 원인 규명과 관련하여 다양한 연구가 수행 되었다. 먼저 농도 수준을 살펴보면 74개 도시에서 1월
한 달의 PM2.5 평균 농도는 중국대기환경기준치를 훌 쩍 넘는 128.7μg/m3이었다. 가장 오염이 심했던 2013 년 1월 12일은 13개 도시에서 일평균 300μg/m3을 넘 는 극심한 오염 상태가 관측되었고, 다른 18개 도시에 서도 200~300μg/m3 수준을 보였다. 특히 지역적으로 보았을 때, 징진지(Jing-Jin-Ji) 지역(Beijing, Tianjin과 Hebei province)이 포함된 NCP에서 가장 오염이 심하 게 나타났다(그림 9)(Jiang et al., 2014).
Wang et al.(2014b)은 PM2.5 관측자료와 기상관측 및 모델자료를 활용하여 베이징의 남쪽 허베이성으로부 터 이동한 오염물질이 베이징에 영향을 미쳤음을 시사 하였다. 이것에 영향을 준 기상학적 원인은 (1) 위도에 따른 대규모 대기 순환이 연무 형성에 이로웠으며, (2) 지역적으로 안정하게 성층화된 대기경계층과 약한 난 류가 연무 형성에 좋은 조건이었고, (3) 850~925 hPa 공기의 이동 흐름이 남쪽 허베이에서 베이징으로 오염 물질이 이송되기 용이한 상태였음을 밝히고 있다.
Huang et al.(2014b)은 이 기간 동안 베이징, 상하이, 광저우, 그리고 시안 4개의 도시에서 PM2.5의 화학적 조성과 배출원 기여도에 대한 연구를 수행하였다(그림
(a) Total PAHs (b) Pyrene
(c) Chrysene (d) Benzo[g,h,i]perylene
Fig. 8. Average source contributions to (a) the total PAHs, (b) Pyrene, (c) Chrysene, and (d) Benzo[g,h,i]perylene in Guangzhou(mean±standard error)(Gao et al., 2013).
BB 31%±4%
BB 30%±4%
BB 48%±4%
BB 75%±3%
VE 11%±2%
VE 21%±3%
VE 14%±2%
VE 20%±2%
CC 58%±4%
CC 32%±3%
CC 4%±1%
CC 57%±4%
BB: Biomass burning VE: Vehicular emissions CC: Coal combustion
10). 네 지역의 PM2.5 농도는 미국과 유럽의 도시 지역 의 관측값보다 약 1~2 차수 높은 수준이었다. 유기물 (organic matter, OM)이 PM2.5의 가장 주요한 성분으로 분석되었으며, 시안을 제외한 지역에서 이차 무기 에 어로졸(secondary inorganic-rich aerosol)과 이차 유기 에어로졸(secondary organic-rich aerosol)이 주된 배출 원 기여도로 밝혀졌다. 시안은 토양 먼지가 가장 주된 기여도로 나타났다.
같은 기간 양쯔강삼각주(Yangtze River Delta, YRD) 의 경우 바이오매스/바이오연료 소각에 기인한 입자 들, 유기탄소, 원소탄소, 질산염 및 황산염의 농도가 중 요하게 상승하여 중금속, 토양 먼지와 해염(sea salt)과 같은 물질의 비중은 청정했을 때에 비해 감소하였다 (Wang et al., 2014a).
또한, 이 기간을 GEOS-Chem으로 모의하였을 때 PM2.5 농도가 실제 관측치보다 낮게 모의되었으며, 연 무 기간이 발생할 정도로 황산염 농도의 큰 증가를 모
의하지 못했다. 기상장의 보정과 SO2 배출량을 2배로 증가시켰을 때 관측치와 유사하게 나타났으나, 모델 내 황산염 발생 메커니즘의 불확실도에 기인한 것으로 판단하여 추가로 황산염 발생 과정을 모델에 매개 변 수화하여 모델을 개선하였다. 이것은 황산염 증가율의 70%를 증가시켰고 PM2.5에서 황산염 비중을 120% 증 가시켰다. 따라서 현재 모델의 모의 수준에서 배출량, 기상장 및 황산염 화학의 조정이 모두 필요함을 시사 한다.
2. 4. 5 PM2.5의 인체 영향
PM2.5의 단기 노출(short-term exposure)이 중국 인 구의 건강에 미치는 영향에 대한 역학 연구는 많이 진 행되지 않았으며, 그 중 유병률보다는 사망률(mortali- ty)에 관한 연구가 더 많다(Pui et al., 2014). 일반적으 로 PM2.5의 단기 노출은 유병률(예, 병원입원 비율과 응급실 내원)에 대한 과도한 위험과 사고로 인한 사망 을 제외한 전체 사망률뿐만 아니라 심혈관(cardiovas- cular)과 호흡기(respiratory)와 관련된 사망률이 양의 상관관계 및 통계적으로 중요한 관련이 있다고 보고되 고 있다.
사망률과 관련된 연구에서 PM2.5의 10μg/m3 증가에 따라 전체 사망률과 심혈관 및 호흡기 관련 사망률에 대한 변화 범위는 각각 0.00~0.90%, 0.26~1.22%, 그 리고 0.07~0.97%의 영향으로 산정되었다(그림 11).
PM2.5와 심폐(cardio-respiratory)의 사망률은 일반적으 로 전체 사망률에 비해 더 연관성이 높게 나타났으며, 호흡기 질병의 사망률 위험도가 상대적으로 심혈관계 질병의 사망률의 위험도보다 높았다.
그림 12는 잠재적 영향 한정자(modifier)들인 나이, 성별, 교육 정도, 그리고 계절을 포함한 분석결과이다.
장년층, 여성 그리고 초등학교 이하 학력을 가진 사람 들이 그렇지 않은 그룹에 비해 일반적으로 더 높은 영 향을 받고 있었다.
3. 향후 연구방향에 대한 제언
중국에서 수행되고 있는 초미세먼지에 관한 다양한 연구의 범위를 참조하여 우리나라 연구의 부족한 부분 을 찾아 보완하는 것이 필요하다. 먼저 초미세먼지의 Fig. 9. PM2.5 concentrations in 74 Chinese cities: (a) daily
average on 12th January 2013 and (b) monthly average in January 2013(Jiang et al., 2014).
(a)
(b)
80°E 90°E 100°E 110°E 120°E 130°E
80°E 90°E 100°E 110°E 120°E 130°E
80°E 90°E 100°E 110°E 120°E 130°E 50°N
40°N
30°N
20°N
50°N
40°N
30°N
20°N 50°N
40°N
30°N
20°N
50°N
40°N
30°N
20°N
0~ 50 50~ 75 75~ 100 100~ 150 150~ 200 200~ 250 250~ 350 0~ 50 50~ 75 75~ 100 100~ 150 150~ 200 200~ 250 250~ 350 350~ 500 500~ 750 PM2.5(μg/m3) daily average
PM2.5(μg/m3) monthly average
장거리 수송 및 배출원을 판단하는데 도움이 되는 세 부적 화학적 특성을 살펴보는 연구가 필요하다. 예를 들어, Huang et al.(2014b)의 경우 14C 측정을 활용하여 탄소성 에어로졸(carbonaceous aerosol)의 화석과 비화 석 기원을 구분하였으며, 유기성 탄소 에어로졸의 세 부 성분들(e.g., HULIS, PAHs, dicarboxylic acids)을 분석하여 바이오매스 소각, 화석연료 및 이차 생성 등 의 기원을 구분하는데 활용하는 연구가 더 필요하다. 더불어 AMS를 측정 및 분석에 활용한다면, 초미세먼 지의 배출원 추정의 정확도와 범위가 확대될 수 있을 것이다.
이차 생성 물질의 경우 배출원-수용처 관계(source-
receptor relationship)에서 화학 반응식의 비선형성에 영향을 받게 되므로, 기존의 기본 모의(모든 배출량 포 함)와 민감도 모의(분석 대상이 되는 지역의 배출량을 제거)의 비교와 같은 방식에는 문제가 있을 수 있다고 지적되고 있다(Li et al., 2014). 초미세먼지의 경우 이 차 생성 에어로졸의 구성비가 미세먼지보다 더 크므로 이에 대한 구체적 메커니즘 개발이 필요하며, 이러한 연구에 챔버(chamber) 실험을 통한 모델 내 추가적인 매개변수화 개발을 고려해야 한다. 더불어 CMB 모델, PMF 모델의 배출원 프로파일을 초미세먼지에 맞추어 개발하는 것이 필요하며, 배출원의 기여도를 100% 이 하로 산정하는 SMP(Solver for Mixture Problem) 모델 Fig. 10. Chemical composition and source apportionment of PM2.5 collected during the high pollution events of 5 ~ 25
January 2013 at the urban sites of Beijing, Shanghai, Guangzhou and Xi’an. Centre map showing locations of the four sites, indicated by arrows. Pie charts around the map show PM2.5 composition and sources for each site. The measured PM2.5 concentrations are shown next to the site name. The measured trace elements include K, Na, Ca, Mg, Fe, Ti, Pb, As, Cu, Zn and Ni, while the major crustal elements, Si and Al, could not be measured due to interference from the quartz fibre substrate of the sample. The central map presents aerosol optical depth(AOD, colourcoded, see key at right), retrieved from satellite(Terra/Modis) observations over the whole month of January 2013(http://www.nasa.gov), and shows the large coverage of severe particle pollution in China(Huang et al., 2014b).
Beijing: 158.5μg/m3
55°N
45°N
35°N
25°N
15°N70°E 90°E 110°E 130°E 1
0.8
0.6
0.4
0.2
0
Xi’an: 345.1μg/m3 Shanghai: 90.7μg/m3
AOD
Composition(%) OM Nitrate Sulphate Ammonium Chloride
Measured trace elements EC
Unidentified
Traffic Coal burning Biomass burning Cooking Dust related Secondary organic-rich Secondary inorganic-rich Sources/factors(%)
Guangzhou: 69.1μg/m3
(Kim, 2013)을 활용하면 배출원 추정의 정확도를 향상 시킬 수 있을 것이다.
초미세먼지의 경우 국지적인 배출량의 영향을 받는 것뿐만 아니라 장거리 수송된 가스 및 입자들의 영향 을 받으므로, 국가 간의 공동 연구가 필요하다(He et al., 2003; Lee et al., 2001). 우리나라의 경우 중국의 풍 하 측에 위치하므로 중국과 공동 연구를 통해 초미세 먼지의 원인을 규명하고, 이에 적합한 저감정책을 펼
치는 것이 중요하다. 초미세먼지의 경우 입자 형태로 국가 간에 이동할 뿐만 아니라 가스상 물질이 이동 과 정에서 또는 특정 지역을 지나가면서 이차 생성될 수 있는 부분이 있으므로, 이러한 구체적인 원인을 규명 하기 위해서는 국가 간에 공동 사례 연구를 실시할 필 요가 있다. 특히 겨울에 빈번한 연무 사례가 중국과 우 리나라에서 발생하고 있으므로, 이러한 현상을 규명하 기 위하여 국가 간의 배출원, 기상장의 영향, 이동 기류 Fig. 11. Estimated percentage increase and 95% confidence interval(CI) in total(nonaccidental) and causespecific
mortality associated with each 10μg/m3 increase in PM2.5(Pui et al., 2014).
- 1 0 1 2
%Increase
상의 반응, 수용처 지역의 특성 등을 고려한 관측, 모델 링, 배출원 기여도 산정 등의 통합적 연구가 필요하다.
마지막으로 초미세먼지가 인체에 미치는 영향에 대한
연구는 매우 미흡하므로, 환경보건과 환경오염 분야가 협력하여 장기 계획을 수립하여 연구하여야 한다. Fig. 12. Estimated percentage increase and 95% confidence interval(CI) in total(nonaccidental) mortality per 10μg/m3
increase in PM2.5 by various effect modifiers(Pui et al., 2014).
- 0.5 0 0.5 1 1.5
%Increase
감사의 글
본 연구는 한국공학한림원의 2014년 정책연구사업 과 한국과학기술연구원의 기관고유사업의 지원을 받 아 수행하였습니다.
References
Che, H., X. Xia, J. Zhu, Z. Li, O. Dubovik, B. Holben, P. Gol- oub, H. Chen, V. Estelles, and E. Cuevas-Agulló (2014) Column aerosol optical properties and aero- sol radiative forcing during a serious haze-fog month over North China Plain in 2013 based on ground- based sunphotometer measurements, Atmos. Chem.
Phys., 14(4), 2125-2138.
Chen, R., Y. Li, Y. Ma, G. Pan, G. Zeng, X. Xu, B. Chen, and H. Kan(2011) Coarse particles and mortality in three Chinese cities: the China Air Pollution and Health Effects Study(CAPES), Sci. Total Environ., 409(23), 4934-4938.
Cheng, Z., J. Jiang, O. Fajardo, S. Wang, and J. Hao(2013) Characteristics and health impacts of particulate matter pollution in China(2001~2011), Atmos.
Environ., 65, 186-194.
Dai, H., W. Song, X. Gao, L. Chen, and M. Hu(2004) Study on relationship between ambient PM10, PM2.5 pollu- tion and daily mortality in a district in Shanghai, J.
Hyg. Res., 33(3), 293-297.
Deutsche Bank Market Research(2013) ‘Big Bang Measures to Fight Air Pollution’. 1 March 2013. http://www.
fullermoney.com/content/2013-03-01/Deutsche_
ChinaStrategy28Feb2013.pdf
Gao, B., H. Guo, X.-M. Wang, X.-Y. Zhao, Z.-H. Ling, Z.
Zhang, and T.-Y. Liu(2013) Tracer-based source apportionment of polycyclic aromatic hydrocar- bons in PM2.5 in Guangzhou, southern China, using positive matrix factorization(PMF), Environ. Sci.
Pollut. Res., 20(4), 2398-2409.
Gao, L., R. Zhang, Z. Han, C. Fu, P. Yan, T. Wang, S. Hong, and L. Jiao(2014a) A modeling study of a typical winter PM2.5 pollution episode in a city in eastern China, Aerosol Air Qual. Res., 14(1), 311-322.
Gao, Y., C. Zhao, X. Liu, M. Zhang, and L.R. Leung(2014b) WRF-Chem simulations of aerosols and anthropo- genic aerosol radiative forcing in East Asia, Atmos.
Environ., 92, 250-266.
Geng, F., J. Hua, Z. Mu, L. Peng, X. Xu, R. Chen, and H. Kan (2013) Differentiating the associations of black carbon and fine particle with daily mortality in a Chinese city, Environ. Res., 120, 27-32.
He, Z., Y. Kim, K. Ogunjobi, and C. Hong(2003) Characteris- tics of PM2.5 species and long-range transport of air masses at Taean background station, South Korea, Atmos. Environ., 37, 219-230.
Huang, K., G. Zhuang, J.S. Fu, Q. Wang, T. Liu, R. Zhang, Y.
Jiang, C. Deng, Q. Fu, and N. Hsu(2012a) Typical types and formation mechanisms of haze in an East- ern Asia megacity, Shanghai, Atmos. Chem. Phys., 12, 105-124.
Huang, K., G. Zhuang, Q. Wang, J. Fu, Y. Lin, T. Liu, L. Han, and C. Deng(2014a) Extreme haze pollution in Bei- jing during January 2013: chemical characteristics, formation mechanism and role of fog processing, Atmos. Chem. Phys. Discuss., 14(6), 7517-7556.
Huang, R.-J., Y. Zhang, C. Bozzetti, K.-F. Ho, J.-J. Cao, Y.
Han, K.R. Daellenbach, J.G. Slowik, S.M. Platt, and F. Canonaco(2014b) High secondary aerosol contribution to particulate pollution during haze events in China, Nat., 514(7521), 218-222.
Huang, W., J. Cao, Y. Tao, L. Dai, S.-E. Lu, B. Hou, Z. Wang, and T. Zhu(2012b) Seasonal variation of chemical species associated with short-term mortality effects of PM2.5 in Xi’an, a central city in China, Am. J.
Epidemiol., 175, 556-566.
Huang, W., J. Tan, H. Kan, N. Zhao, W. Song, G. Song, G.
Chen, L. Jiang, C. Jiang, and R. Chen(2009) Visi- bility, air quality and daily mortality in Shanghai, China, Sci. Total Environ., 407(10), 3295-3300.
Jiang, J., W. Zhou, Z. Cheng, S. Wang, K. He, and J. Hao (2014) Particulate matter distributions in China during a winter period with frequent pollution epi- sodes(January 2013), Aerosol Air Qual. Res., DOI 10.429/aaqr.2014.04.0070.
Kim, B.M. (2013) Development of a new SMP model satisfy- ing all known physical constraints in environmental application, Chemom. Intell. Lab. Syst., 121, 57-65.
Lang, J., S. Cheng, J. Li, D. Chen, Y. Zhou, X. Wei, L. Han, and H. Wang(2013) A monitoring and modeling study to investigate regional transport and charac- teristics of PM2.5 pollution, Aerosol Air Qual. Res., 13(3), 943-956.
Lee, J.H., Y.P. Kim, K.-C. Moon, H.-K. Kim, and C.B. Lee (2001) Fine particle measurements at two back-
ground sites in Korea between 1996 and 1997, Atmos. Environ., 35, 635-643.
Li, J., W. Yang, Z. Wang, H. Chen, B. Hu, J. Li, Y. Sun, and Y.
Huang(2014) A modeling study of source-receptor relationships in atmospheric particulate matter over Northeast Asia, Atmos. Environ., 91, 40-51.
Liu, J., J. Li, Y. Zhang, D. Liu, P. Ding, C. Shen, K. Shen, Q.
He, X. Ding, and X. Wang(2014a) Source appor- tionment using radiocarbon and organic tracers for PM2.5 carbonaceous aerosols in Guangzhou, South China: Contrasting local- and regional-scale haze events, Environ. Sci. Technol., 48(20), 12002-12011.
Liu, Z., B. Hu, L. Wang, F. Wu, W. Gao, and Y. Wang(2014b) Seasonal and diurnal variation in particulate matter (PM10 and PM2.5) at an urban site of Beijing: analy- ses from a 9-year study, Environ. Sci. Pollut. Res., DOI 10.1007/s11356-014-3347-0.
Ma, Y., R. Chen, G. Pan, X. Xu, W. Song, B. Chen, and H.
Kan(2011) Fine particulate air pollution and daily mortality in Shenyang, China, Sci. Total Environ., 409(13), 2473-2477.
Ma, Z., X. Hu, L. Huang, J. Bi, and Y. Liu(2014) Estimating ground-level PM2.5 in China using satellite remote sensing, Environ. Sci. Technol., 48, 7436-7444.
Pui, D.Y., S.-C. Chen, and Z. Zuo(2014) PM2.5 in China: Mea- surements, sources, visibility and health effects, and mitigation, Partic., 13, 1-26.
Shen, Z., J. Cao, R. Arimoto, Z. Han, R. Zhang, Y. Han, S. Liu, T. Okuda, S. Nakao, and S. Tanaka(2009) Ionic composition of TSP and PM2.5 during dust storms and air pollution episodes at Xi’an, China, Atmos.
Environ., 43(18), 2911-2918.
Sun, Y., G. Zhuang, A. Tang, Y. Wang, and Z. An(2006) Che- mical characteristics of PM2.5 and PM10 in haze-fog episodes in Beijing, Environ. Sci. Technol., 40(10), 3148-3155.
Tan, J., S. Guo, Y. Ma, J. Duan, Y. Cheng, K. He, and F. Yang (2011) Characteristics of particulate PAHs during a typical haze episode in Guangzhou, China, Atmos.
Res., 102(1), 91-98.
The National Academy of Engineering of Korea(2014) Con- struction of International Collaboration Network against PM2.5 Pollution in East Asia, Report No.
14-01-04.
Wang, H., J. An, L. Shen, B. Zhu, C. Pan, Z. Liu, X. Liu, Q.
Duan, X. Liu, and Y. Wang(2014a) Mechanism for the formation and microphysical characteristics of submicron aerosol during heavy haze pollution epi-
sode in the Yangtze River Delta, China, Sci. Total Environ., 490, 501-508.
Wang, H., J. Xu, M. Zhang, Y. Yang, X. Shen, Y. Wang, D.
Chen, and J. Guo(2014b) A study of the meteoro- logical causes of a prolonged and severe haze epi- sode in January 2013 over central-eastern China, Atmos. Environ., 98, 146-157.
Wang, J.-F., M.-G. Hu, C.-D. Xu, G. Christakos, and Y. Zhao (2013a) Estimation of citywide air pollution in Beijing, PLoS ONE, 8(1), e53400. DOI 10.1371/
journal.pone.0053400
Wang, J., Z. Hu, Y. Chen, Z. Chen, and S. Xu(2013b) Contam- ination characteristics and possible sources of PM10
and PM2.5 in different functional areas of Shanghai, China, Atmos. Environ., 68, 221-229.
Wang, Y., Q. Zhang, J. Jiang, W. Zhou, B. Wang, K. He, F.
Duan, Q. Zhang, S. Philip, and Y. Xie(2014c) En- hanced sulfate formation during China’s severe winter haze episode in January 2013 missing from current models, J. Geophys. Res.: Atmos., 119(17), 10425-10440.
Xiao, Z.-M., Y.-F. Zhang, S.-M. Hong, X.-H. Bi, L. Jiao, Y.-C.
Feng, and Y.-Q. Wang(2011) Estimation of the main factors influencing haze, based on a long-term moni- toring campaign in Hangzhou, China, Aerosol Air Qual. Res., 11(7), 873-882.
Xu, D., M. Dan, Y. Song, Z. Chai, and G. Zhuang(2005) Con- centration characteristics of extractable organohal- ogens in PM2.5 and PM10 in Beijing, China, Atmos.
Environ., 39(22), 4119-4128.
Yang, C., X. Peng, W. Huang, R. Chen, Z. Xu, B. Chen, and H. Kan(2012) A time-stratified case-crossover study of fine particulate matter air pollution and mortality in Guangzhou, China, Int. Arch. Occup. Environ.
Health, 85(5), 579-585.
Ying, Q., L. Wu, and H. Zhang(2014) Local and inter-regional contributions to PM2.5 nitrate and sulfate in China, Atmos. Environ., 94, 582-592.
Yu, L., G. Wang, R. Zhang, L. Zhang, Y. Song, B. Wu, X. Li, K.
An, and J. Chu(2013) Characterization and source apportionment of PM2.5 in an urban environment in Beijing, Aerosol Air Qual. Res., 13(2), 574-583.
Zhang, F., H.-R. Cheng, Z.-W. Wang, X.-P. Lv, Z.-M. Zhu, G.
Zhang, and X.-M. Wang(2014) Fine particles(PM2.5) at a CAWNET background site in Central China:
Chemical compositions, seasonal variations and regional pollution events, Atmos. Environ., 86, 193- 202.
Zhang, F., J. Chen, T. Qiu, L. Yin, X. Chen, and J. Yu(2013a) Pollution characteristics of PM2.5 during a typical haze episode in Xiamen, China, Atmos. Clim. Sci., 3, 427-439.
Zhang, R., J. Jing, J. Tao, S.-C. Hsu, G. Wang, J. Cao, C. Lee, L. Zhu, Z. Chen, and Y. Zhao(2013b) Chemical characterization and source apportionment of PM2.5
in Beijing: seasonal perspective, Atmos. Chem.
Phys., 13(14), 7053-7074.
Zhao, P., F. Dong, D. He, X. Zhao, X. Zhang, W. Zhang, Q.
Yao, and H. Liu(2013a) Characteristics of concen-
trations and chemical compositions for PM2.5 in the region of Beijing, Tianjin, and Hebei, China, Atmos.
Chem. Phys., 13(9), 4631-4644.
Zhao, P., F. Dong, Y. Yang, D. He, X. Zhao, W. Zhang, Q.
Yao, and H. Liu(2013b) Characteristics of carbona- ceous aerosol in the region of Beijing, Tianjin, and Hebei, China, Atmos. Environ., 71, 389-398.
Zhao, X., X. Zhang, X. Xu, J. Xu, W. Meng, and W. Pu(2009) Seasonal and diurnal variations of ambient PM2.5
concentration in urban and rural environments in Beijing, Atmos. Environ., 43(18), 2893-2900.

![Fig. 8. Average source contributions to (a) the total PAHs, (b) Pyrene, (c) Chrysene, and (d) Benzo[g,h,i]perylene in Guangzhou (mean±standard error) (Gao et al., 2013).](https://thumb-ap.123doks.com/thumbv2/123dokinfo/4901190.534884/12.807.112.683.113.486/average-source-contributions-pyrene-chrysene-perylene-guangzhou-standard.webp)
