213
F OREST S OCIETY
Growth Characteristics of 100 Open-pollinated Families in an Early-age Test of Agathis loranthifolia in West Java, Indonesia
Kyu-Suk Kang
1, 3*, Eduardo P. Cappa
2and Jaehong Hwang
31
Division of Forest Policy, Korea Forest Service, Daejeon 302-701, Republic of Korea
2
Instituto Nacional de Tecnología Agropecuaria (INTA), Instituto de Recursos Biológicos, Los Reserosy Las Cabañas s/n, 1712, Castelar, Buenos Aires, Argentina
3
Department of Forest Resources Development, Korea Forest Research Institute, Suwon 441-350, Republic of Korea
Abstract : Early results from a field trail of Agathis loranthifolia are reported from a progeny test of 100 open-pollinated families in west Java, Indonesia. The average of height and diameter at root collar (DRC) was 40.18 cm and 0.52 cm at age 15 months. Family survival rate ranged from 86.5% at age 10 months to 81.7% at age 15 months. Family means of 10 best and 10 poorest families for each trait indicated that there was a large difference of growth performances among individual families. For height and DRC growth, the poorest groups had averages of 33.98 cm and 0.43 mm while the averages of the best groups were 47.35 cm and 0.62 mm at age 15 months as a difference of 39.36% and 43.65%, respectively.
Differences between the best group and the test population mean, which is the selection differential, were implying that genetic gain from selection for the improvement of height and DRC growth would be achieved. The family variances of DRC and height were relatively small compared to replicate and residual variances. Family heritabilities for both studied traits were fluctuated, and the genetic coefficients of variation for DRC and height at age of 15 months were 7.19% and 5.22%, respectively.
Key words : genetic component, heritability, correlation, breeding strategy, selection
Introduction
Agathis loranthifolia is native to Papua New Guinea, New Britain, Central Malesia (Maluku, Celebes and Philippines), Kalimantan and Sumatra. It can grow up to 65 m tall with a diameter of up to 200 cm. The seedling needs shade and growth is slow during the first year.
Later, when released from competition from weeds, growth is rapid. It is cultivated as a plantation tree and used in enrichment planting and reforestation in various areas within the natural range, especially in Irian Jaya. It has also been planted intensively in Java, outside the natural range because the species is important from the ecological, silvicultural, industrial, genetic and landscape points of view in Indonesia (Hardiyanto and Na’iem, 2001; Nurhasybi and Sudrajat, 2002).
A. loranthifolia is wind pollinated, and female and male cones are on different branches on the same tree.
In plantations in Java, cone production begins when the tree is about 15 years old, and viable seeds are usually
produced after the age of 25 years. Trees produce flow- ers and fruits throughout the year, but the best fruiting season is from August to October. The seed has no dor- mancy and does not need pretreatment before sowing.
Germination percentage of 90-100% is reached within 10 days. Vegetative propagation is done by stem cutting from seedlings aged 7 months (30 cm tall) dipped in IBA 10 ppm. Roots will emerge 6-8 weeks after the stem cutting has been placed in the rooting bed (Nurhasybi and Sudrajat, 2002).
Indonesia has over 120 million hectares of natural for- ests among 195 million hectares total land area. These represent a tenth of the World’s remaining tropical rain- forests and they are also vital to Indonesia’s economic development, meeting most of the domestic demand for wood. Owing to factors such as logging, conversion of forest land to other uses, fire and shifting cultivation, Indonesia’s forests are being degraded and deforested at an unprecedented rate (Hardiyanto and Na’iem, 2001).
Plantation forests in Indonesia are found mainly on Java, and cover an area of about two million hectares.
They consist of teak ( Tectona grandis ), Merkus pine ( Pinus merkusii ), mahogany ( Swietenia macrophylla ),
*Corresponding author
E-mail: [email protected]
rosewood ( Dalbergia latifolia ), agathis ( Agathis loranthifo- lia ), cajuput ( Melaleuca cajuputi ) and other species. By 2000, about 2.5 million hectares of plantations had been established on outer islands, particularly Sumatra and Kalimantan (Ministry of Forestry, 2000; Kartodihardjo and Supriono, 2000).
A tree improvement program has not yet initiated with
A. loranthifolia in Indonesia. So, the Korea Forest Research Institute has been supporting Indonesian tree breeding cooperating with the Ministry of Forestry, Indonesia and the Korea International Cooperation Agency since 2005.
The cooperation has selected 100 plus trees of A.
loranthifolia throughout whole Java Island in Indonesia and established the progeny test of open pollinated fam- ilies in Jasinga, west Java. Improvement of growth traits is the main objective of the program (RSSNC, 2007).
The objectives of this study are (i) to survey the sur- vival of 100 selected plus trees of A. loranthifolia in Java, (ii) to estimate genetic parameters of growth traits of the open pollinated progenies, and (iii) to identify superior families of the A. loranthifolia for reforestation in west Java. We also discussed genetic constitutes in relation to the genetic improvement of A. loranthifolia in Java, Indonesia.
Materials and Methods 1. Progeny trial and data assessment
Open pollinated seeds were collected from the selected 100 plus trees of A. loranthifolia growing in several arti- ficial populations that reached at rotation age (over 40 years) from west Java. Growth, tree form, stem straight- ness, disease/insect resistance, seed availability were all taken into account in the parental selection. To reduce the likelihood of relatedness, the trees were separated by a minimum of 100 meters.
Seeds were collected from the selected plus trees and extracted by the seed research team of the Bogor Agri- cultural University (IPB). Then, seeds were sown in polyethylene pots (22 cm × 18 cm) filled with vermicu- late, perlite and peatmoss (1:1:1 in volume). After sow- ing, the seeded pots were placed in nursery beds where they were arranged in a randomized complete block design. Seedlings were grown for two months (Decem- ber 2006 to January 2007) in local nurseries at Gunung Walat nursery near planting site in the west Java.
Outplanting started at early February 2007 and seed- lings were transplanted within a week. Weeding was car- ried out four times during the first year and three times during the second year. On the nursery and planting site, families were arranged in randomized complete blocks, with eight replicates of 4-trees in line per plot in the field (lat. 6
o30' S, long. 106
o33' E, elev. 820 m). The
spacing was 2.5 m × 2.5 m in the field whereas seeding containers were side by side in the nursery.
We measured growth traits (seedling height and diam- eter at root collar) at different ages of 0, 10 and 15 months. Here, age 0 means the measurement just before the outplanting (i.e., assessment in the nursery stage).
2. Statistical analyses
Individual tree data for seedling height and diameter at root collar were checked for normality using the SAS Univariate procedure (SAS Institute Inc., 2002). Plot means (i.e., the average of all trees from a given family within a replication) improved the normality of data for both traits at the different ages, as mentioned Jansson and Danell (1993). Therefore, plot means were employed for both traits at the different ages in subsequent anal- yses, in order to improve the normality and on the basis that this decision does not affect the precision with which any parental breeding value is predicted (White and Hodge, 1989).
Separate analyses of variance were fitted for each growth trait at different ages for examination the differ- ences among families, using the MIXED procedure in SAS program according to the following linear mixed model:
y
ij= µ + B
i+ F
j+ e
ij(1) where y
ijis the plot means of the dependent variable of the i
threplicate of the j
thfamily, µ is the overall mean, B
iis the random effect of the i
threplicate, F
jis the fixed effect of the j
thfamily and e
ijis the random residual error term.
Variance components for individual traits, where esti- mated with the linear mixed Model (1), but considering family as random effect rather than a fixed effect. Her- itability of family ( h
f2, (2)) was estimated as follows,
(2) where , and are the family genetic variance, replicate variance component and residual variance, respectively. To compare the absolute level of family genetic variance across the traits, the genetic coefficients of variation (GCV) was calculated with the formula (3) as follows,
(3) where , is the family genetic variance and is the population mean.
The family genetic correlations ( r
f) among pairs of traits at the age of 0, 10 and 15 months were estimated using a bivariate model that was extended from the
h
f2σ
f2σ
f2+ + σ
h2σ
e2---
=
σ
f2σ
b2σ
e2h
f2σ
f2σ
f2+ + σ
b2σ
e2---
=
σ
f2σ
b2x
univariate linear mixed model (1) also considering fam- ily as random effect. Given that, some family genetic correlations were difficult to estimate due to estimations were out of the parameter space, genetic correlations were also calculated with the predicted family breeding values using Pearson’s correlation by the CORR proce- dure in SAS program. In order to determine to what extent the variation in one trait is associated with that in others, phenotypic correlations among pairs of traits at the age of 0, 10 and 15 months were also obtained with the CORR procedure in SAS.
All analyses were performed by means of Restricted Maximum Likelihood (REML) (Patterson and Thomp- son, 1971), using Average Information algorithm imple- mented with ASREML (Gilmour et al ., 2006). One important limitation of the REML (co)variance estimates is that their distribution is unknown. Only approximate measure of precision of the estimates based on asymp- totic theory can be calculated. Standard errors of the her- itability and family genetic correlation were computed approximately with the “delta method” based on Taylor expansion (Lynch and Walsh, 1998) using an ASREML post-processing program (Gilmour et al ., 2006).
Expected genetic gain ( G ) was calculated by Fal- coner's (1981) formula (4) as follows,
(4) where i is the intensity of selection taken from Becker (1984), and σ
Pis the family phenotypic standard devi- ation of each trait.
Results and Discussion
Based on individual assessment, data of overall sur- vival rate, means value, standard deviation and range for diameter at root collar (DRC) and height growth (HT) at the 0, 10 and 15 months are shown in Table 1. Survival
rate increased 13.5% at age 10 months and 18.5% at age 15 months, respectively. Also a large difference of sur- vival rate among families was found and the rage of average survival rate was from 62.5% to 96.9% at age 15 months. The grand mean of height at age 15 months was 40.18 cm and that of diameter at root collar was 0.518 cm. The standard deviation for both traits increased with the ages from 0, 10 and 15 months.
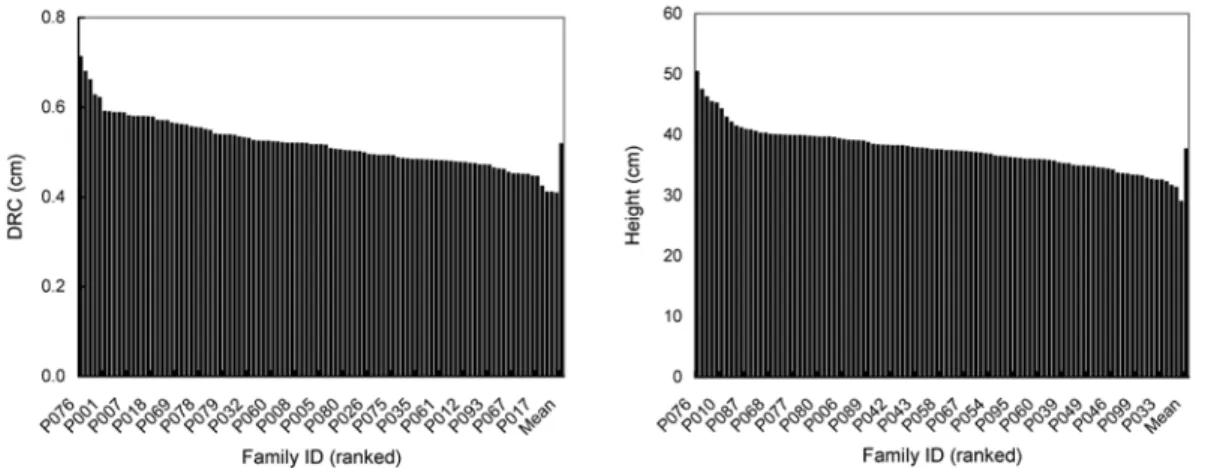
1. Family effect and variation of family means Highly significant ( p <0.001) differences of both growth traits at ages of 0, 10 and 15 months, among the 100 families were found from the analysis of variance using the family linear mixed Model (1) (data not shown). Figure 1 shows a large phenotypic variation of diameter at root collar and height growth among the 100 open-pollinated families of A. loranthifolia at age 15 months.
Table 2 shows family means of 10 best and 10 poorest families for each trait, indicating the magnitude of fam- ily variation. Large variation among family means was found. For height growth and root collar diameter, the
G
∆ = ih
f2σ
PTable 1. Number of tree with records ( n ), survival, overall means (Mean), standard deviation (SD) and range for diameter at root collar (DRC) and height growth (HT) under different ages in the progeny trial of A. loranthifolia in west Java, Indonesia (based on individual assessment data).
Trait Age n Survival (%) Mean
(cm) SD Range
(cm) DRC 0 3,200 100 0.27 0.124 0.1 - 0.7
10 2,769 86.5 0.47 0.136 0.1 - 1.2 15 2,613 81.7 0.52 0.235 0.1 - 1.6 HT 0 3,200 100 23.8 8.603 10.0 - 77.0
10 2,769 86.5 36.4 12.101 10.0 - 100.0 15 2,613 81.7 40.2 18.635 10.0 - 110.0
Figure 1. Averages of the diameter at root collar (DRC) and height of the 100 open-pollinated families of A. loranthifolia
at age 15 months.
poorest groups had averages (X2) of 33.98 cm and 0.43 mm, respectively while the averages of the best groups (X1) were 47.35 cm and 0.62 mm at age 15 months, respectively; a difference (D1) of 39.36% and 43.65%.
Differences (D2) between the best group (X1) and the test mean (X), which is the selection differential, were smaller but still significant (Table 2). As expected, dif- ferences among individual families were much greater.
For example, at 15 months of age, the worst family was 30.63 cm tall and 0.41 cm DRC, while the best family measured 52.5 cm tall and 0.71 cm DRC, i.e. a differ- ence of 171.6% and 174.4 %, respectively.
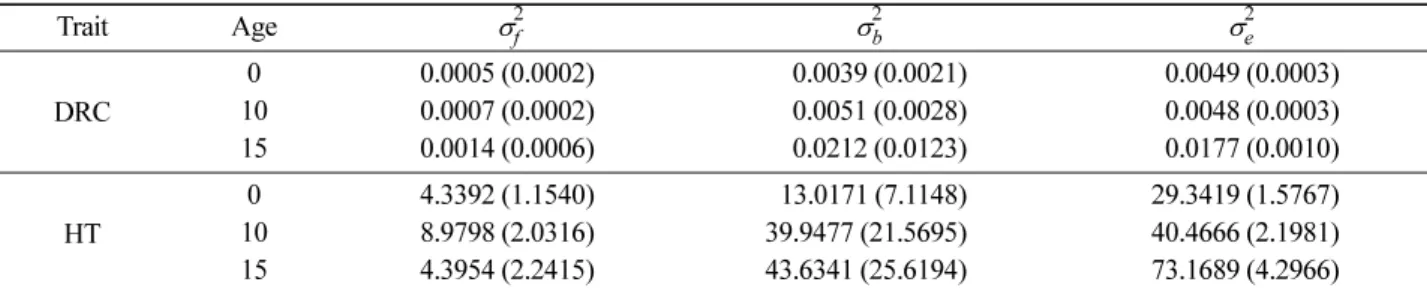
2. Genetic variation among families
The family genetic variances of DRC and height were relatively small compared to replicate and residual vari- ances across ages (Table 3). Family heritabilities for both studied traits were not stable by ages (Figure 2).
Although, the average heritability estimates for DRC and height across ages were 0.040 and 0.077, respectively.
The ability of traits to respond to the selection can be compared by the genetic coefficients of variation (GCV) that measures levels of genetic variation while account- ing for scale and size effect. The GCV was 7.19% and 5.22% at age 15 months for DRC and height, respec- tively (Figure 2). Thus, it has been demonstrated that A.
loranthifolia half-sib families posses considerable genetic variation in the DRC and height traits, suggesting that selection for improvement would be promising.
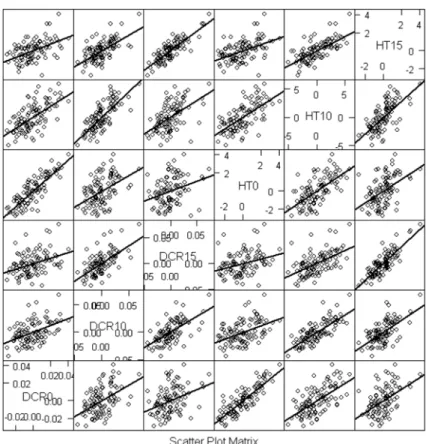
3. Correlations in time and among traits
Positive and highly significant ( p <0.0001) phenotypic correlations were found between DRC and height growth for all ages (Table 4). They ranged from 0.684 for HT10/DRC10 to 0.214 for HT0/DRC15. As expected, phenotypic correlation between traits at the same age was higher than that at across ages.
Table 2. Ranking of the 10 best and the 10 poorest families of
A. loranthifolia based on the height and DRC performances at age of 0, 10 and15 months.
Family
rank
aAge 0 Age 10 Age 15
Height DRC Height DRC Height DRC 1 31.31 0.365 45.64 0.604 52.54 0.712 2 29.97 0.347 44.92 0.565 51.05 0.679 3 29.29 0.344 44.80 0.564 48.71 0.661 4 28.63 0.340 43.07 0.544 48.50 0.627 5 28.28 0.340 42.97 0.544 48.50 0.620 6 28.22 0.337 42.68 0.534 46.87 0.590 7 28.16 0.334 42.19 0.530 45.50 0.589.
8 28.09 0.332 42.03 0.519 44.70 0.587 9 28.00 0.328 41.88 0.519 43.58 0.587 10 27.75 0.322 41.79 0.517 43.58 0.587 X1 28.77 0.339 43.20 0.544 47.35 0.624 91 20.00 0.233 31.50 0.432 35.76 0.451 92 19.93 0.232 31.30 0.421 35.64 0.450 93 19.78 0.230 31.25 0.421 35.44 0.450 94 19.66 0.228 31.07 0.419 35.05 0.449 95 19.56 0.227 30.58 0.417 34.08 0.446 96 19.50 0.225 30.21 0.417 33.58 0.445 97 19.28 0.225 29.89 0.416 33.29 0.423 98 19.13 0.217 29.86 0.414 33.16 0.410 99 19.06 0.213 29.85 0.404 33.16 0.410 100 18.78 0.210 28.89 0.400 30.63 0.408 X2 19.47 0.224 30.44 0.416 33.98 0.434 X 23.83 0.275 36.36 0.473 40.16 0.518 D1(%) 47.78 51.16 41.91 30.67 39.36 43.65 D2(%) 20.73 23.42 18.81 14.99 17.92 20.56
a