Structure and Characteristic Analysis of Chinese Scientific Research Network Based on the SNA
Na Chao
1, Hyung-Ho Kim
2*1
Professor, School of Foreign Languages, HeZe University
2
Professor, Dept. of Air Transport and Logistics, Sehan University
SNA를 활용한 중국 과학연구 네트워크의 구조 및 특징 분석에 관한 연구
조나
1, 김형호
2*1
중국 하택대학교 외국어학부 교수,
2세한대학교 항공교통물류학과 교수
Abstract The purpose of this study is to identify the current status and research trends of the efficiency assessment of scientific research and development in Chinese universities over the last 10 years through social network analysis(SNA). The data used in the analysis were extracted from 589 papers from CNKI academic archives in China and analyzed among them 190 papers directly related to the evaluation of scientific research and development efficiency. The analysis showed that the present state of science and technology research efficiency assessment in Chinese universities, identifying research trends, major factors on scientific research and development and major factors promoting exchanges of scientific research. This study can provide positive meaning to facilitate the development of scientific research and development in universities, enhance scientific research management and promote knowledge exchange. This study has limitations in comprehensively analyzing scientific research trends in the actual Chinese research environment. Subsequent studies need to compare trends in China and other countries.
Key Words : Social Network Analysis, Scientific Research, Efficiency, Degree centrality, Betweenness Centrality
요 약 본 연구는 사회 연결망 분석 기법(SNA)을 통하여 최근 10년간 중국대학의 과학연구 및 개발의 효율성 평가 현황과 연구동향을 파악하는데 목적이 있다. 분석에 사용된 자료는 중국의 CNKI 학술 자료집에서 589개의 논문을 추출하여 과학 연구 개발 효율성 평가와 직접적으로 관련된 190개의 논문을 선택하여 분석하였다. 분석 결과 중국 대학의 과학기술 연구 효율성 평가 현황, 연구 트렌드 파악, 과학 연구개발에 미치는 주요 요인 및 과학연구의 교류를 촉진하는 주요 요인을 확인할 수 있었다. 본 연구는 대학의 과학 연구 개발을 촉진하고, 과학 연구 관리를 강화하며 지식 교류를 촉진하는 긍정적인 의미를 제공할 수 있다. 이 연구는 실제 중국 연구 환경의 과학 연구 동향을 종합적으 로 분석하는 데 한계가 있다. 후속 연구는 중국과 다른 나라의 동향을 비교할 필요가 있다.
주제어 : 소셜 네트워크 분석, 과학연구, 효율성, 연결 중심성, 매개 중심성
*Corresponding Author : Hyung-Ho Kim([email protected])
Received March 27, 2020 Revised April 30, 2020
Accepted June 20, 2020 Published June 28, 2020
1. Introduction
With the significant improvement of China's overall national strength and economic strength, the science and technology the industry has made great progress, and the status of innovation in science and technology activities in the process of social and economic development have also improved significantly. China's scientific and technological strength and innovation capacity has greatly improved, innovation-driven development has produced remarkable results.
China ranks among the top 15 countries in the world in terms of its comprehensive innovation capacity, making it an innovation-oriented country[1]. This plan fully reflects the importance of scientific and technological activities in China.
The competition between nations is essentially the competition of science and technology. Only by reasonably promoting the development of scientific and technological innovation activities can we effectively enhance the national competitive advantage. The 13th five-year plan also puts forward the strategy of "implementing innovation-driven development", emphasizing the integrated development of science and education and promoting the full participation of institutions of higher learning in the construction of the national innovation system. The scientific research and innovation activities of colleges and universities not only concern the development of colleges and universities, but also play an important role in promoting the economic transformation and upgrading of various regions[2]. Colleges and universities provide important talents for scientific research, they have both academic advantages and talent advantages, how to build a university scientific and technological innovation team and promote its growth has become an important part of university scientific research management. With the increasing emphasis of the state on the development of scientific research activities in
colleges and universities, the financial expenditure of the Chinese government on scientific research activities in colleges and universities keeps increasing. According to statistics in the compilation of statistics on science and technology in institutions of higher learning, the Chinese government allocated 65.5 billion yuan to institutions of higher learning in 2009, and the 10-year growth rate was as high as 135% to 153.7 billion yuan in 2017, with an average annual growth rate of 13.5%. With the increasing emphasis of the state on the scientific research activities of colleges and universities and the continuous expansion of the input funds, the use of the funds in the scientific research activities of colleges and universities in China.
That is, the research on the input-output efficiency of the funds in the scientific research activities of colleges and universities, have gradually become an important subject. The academic research on the scientific research activities of colleges and universities is also increasing gradually. This article takes the actual needs as a starting point, analyze the current the development process, development status and research hot spots of research literature related to scientific research efficiency in Chinese universities, research objectives are as follows:
First, it helps the Chinese government and
universities monitor the scientific research
efficiency of universities in real time, so they can
adjust the allocation of university scientific
research resources in a timely and reasonable
manner; Second, it can guide the Chinese
government and universities to grasp the
development trends and scientific research
activities trend in Chinese universities; Third, it
is helpful for foreign scholars to keep abreast of
the development trend of scientific research in
Chinese universities,also provides reference
materials for scholars who study the comparative
research of foreign and Chinese scientific
research development.
With the rapid popularity of the Internet, the information society has fully entered the era of big data now. Use advanced technical methods, select appropriate data models and statistical analysis methods to visualize big data, make people more intuitively observe large-scale and complex data, and have a clearer cognitive observation of data characteristics. The social network analysis method (SNA) has the above characteristics. This article will use the social network analysis method (SNA) to collate and analyze the data of the papers published in China from 2010 to 2019 related to the efficiency of scientific research activities in colleges and universities. Build a visual network structure diagram to grasp the characteristics of time series distribution and periodical distribution of literature in the field of scientific research efficiency in Chinese universities; analyze the overall structure of the visual network, explore the research hotspots and trends in the field in recent years from 2010 to the present and changes in the subject of literature research in this field to provide references for scientific research management in colleges and universities.
2. Literature Review
As the main department of knowledge production and dissemination, universities undertake the important tasks of technological innovation and technological development.
University scientific research activities is an important part of the national science and technology innovation system. Many scholars have conducted a lot of researches on university research, and the results of different scholars in different countries are different.
T.K.Sung, H.D.Jo, D.H.Lee & P.Lee analyzes the chain reaction of universities research on industrial R&D and technological innovation
activities. The results of the research, the effect of university research in industrial R & D and technological innovation is relatively small. At present, governments, enterprises, and universities all tend to use joint research, contract research, branch companies and cooperative enterprises as their communication channels. But in the future, we must realize that technical knowledge can be spread in various forms, such as papers, patents, academic conferences, seminars, technical guidance and human resource development[3]. K.H.Bong, J.H.Bae & J.M.Park used the value-at-risk model (VAR) to observe the increase and decrease of patent applications in the R & D of the main body. Dynamically observed the relationship between the research and development costs of each subject and Korean patent applications.
Analysis of the data from 1991 to 2016 shows that the R & D of Korean universities directly or indirectly provides technology to the industry, but public research institutions have failed to play a role in creating value through patents[4].
C.J.Lee & J.I.Choi used a systematic literature review method to analyze Korean papers published in related fields since 2000, and the factors promoting technology transfer or entrepreneurship in Korean universities were confirmed. From the analysis results, it is found that the number of literatures that study the influencing factors of technology transfer is the largest. The number of papers on the influencing factors of entrepreneurship has increased significantly recently, and the most commonly used research method is empirical research[5].
Q.T.Fan, J.S.Huang, Y.Du & J.Liu use CiteSpace visual tools and bibliometric method to analyze the core journals included by CNKI and 1936 scientific research management documents from CSSCI. The retrieval subject word is "scientific research management", and the time range is
"unlimited-2018". The result shows that colleges
and universities occupies a leading position
among the document issuing organizations in the field of scientific research management in China.
Universities should strengthen the research and practice cooperation of research management, and constantly improve scientific research level and comprehensive strength[6]. H.Zhu & R.B.Wei analyzed the research hotspots, dynamic evolution and cutting-edge trends of China's scientific research policies with scientific metric methods, reveal domestic research hotspots in terms of word frequency statistics and keyword clustering. Through the analysis results, we have obtained the conclusion that in the field of scientific research in China, the research data privacy protection policy, scientific research achievement transformation policy evaluation, university scientific research innovation policy and scientific research integrity policy will get more researchers' attention[7].
It can be found by sorting out relevant research literature that there are certain differences in the scientific research development process of Korea and China. Till 2011, the research and innovation cause of Korea was not highly influenced by colleges and universities. With the economic development and government support after 2011, the colleges and universities of Korea gradually got some achievements and surpassed public institutions in 2019, they also provided more technical supports to Korea industry and occupied a leading position in Korea scientific research field. The research projects and research technologies of Korea universities were adjusted to meet its scientific research development needs. In China, colleges and universities have always dominated the scientific research field. Although it has received strong support from government funds and national policies, the scientific research level and comprehensive strength of Chinese universities still need to be improved, the quality of scientific research and the allocation of scientific research resources need to be improved.
In recent years, scholars have conducted
in-depth and extensive research on universities
from various perspectives by using SNA. L.X.Xu
using SNA, the national college of engineering
management specialty evaluation project of 30
colleges and universities management associate
professor title more than scientific research
personnel as the research object, to retrieve the
object of the study published in 2008-2018 CNKI
and core journals of CSSCI periodicals paper
co-author network data analysis. The results
show that the forms of the network can consist
of four types. It is also noted that there exists a
faction classification in the field of project
management[8]. T.Liu&M.Wang used SNA to
analyze citation network relationships in the
research field. By entering keywords "scale-free
network, scientific research" into CNKI, papers
with less than 10 citations from 2010 to 2018
were selected as the final data. Through analysis,
the author found the core authors in the
scientific research network, the authors who play
the role of the intermediary of scientific research
communication, and the information of the
scientific research network revealed by the
calculation results of SNA are of guiding
significance for identifying industry leaders,
component scientific research teams, promoting
knowledge exchange and diffusion, and scientific
research management[9]. In conclusion, in recent
years, scholars have made a number of
researches on various fields of universities by
using SNA, and got some achievements. The
application of social networks has been widely
studied by sociologists, which make SNA develop
gradually. SNA can be applied not only in the
field of education, but also in other fields of
sociology. N.R.Kim, H.R.Choi & T.H. Lee
conducted a social network analysis of degree
theses on governance information published
after 2016, centering on the Academic Research
Information Service. The results showed that the
research topics are divided into cooperative
governance and local governance. Keywords include network, participation, conflict and trust, which is consistent with the characteristics of governance. Typical governance topics include education, urban regeneration and the environment[10]. M.K.Lee focused on family and personal travel, collected social data, and used network analysis to analyze Korean tourism trends. The text data generated by network users were collected by using naver and daum search keywords. The results of analysis showed word frequency, n gra(2 gram) frequency, travel attributes, centrality, and structural equivalence in the networks of family travel and solo travel[11]. C.Y.Wang used SNA to characteristics of seasonal Korean tourism itineraries of individual Chinese visitors were analyzed. The analysis showed that Seoul is the hub of Chinese travel to Korea, and the main visits of Chinese visitors are concentrated in Seoul, Busan, Jeju Island, Gyeongju, and Gangneung.[12].
To sum up, many scholars have used SNA to analyze and study different fields of sociology from their own perspectives. However, so far, in the field of scientific research efficiency in universities, the use of social network analysis results are still very few. This article will use the SNA to China hownet (CNKI) collection of academic papers published from 2010 to 2019 of input keywords' efficiency of scientific research in colleges and universities' or 'efficiency of scientific research at the university of sorting, screening for nearly 10 years scholars of the popular research fields in the efficiency of scientific research in colleges and universities is analyzed, in order to reveal the development present situation and development trend of this field.
3. Data collection and research method
3.1 Data sources
This article aims to study the research trends
and hotspots of scientific research efficiency in
Chinese colleges and universities, so this article
selected to search the relevant Chinese research
data in the world's largest Chinese database
CNKI database. In order to retrieve the research
information related to the efficiency of scientific
research in colleges and universities, this article
set the search topic as ‘research efficiency of
colleges and universities’ or ‘university research
efficiency’. The purpose is to make the direction
more clear and more targeted, which can better
reflect the purpose of this article. And set the
publication time as January 1
st, 2010 and
September 30
st, 2019, and the retrieval time as
October 2019 in the advanced search of CNKI
database. The retrieval results showed that there
are 589 related papers, excluding non-related
literary theory and non-academic papers, and
190 valid papers were selected. After that,
selected the keywords in the effective papers to
use Excel for data statistics. After that, it will be
converted to TXT file and imported into KH
Coder3 software to construct a scientific
research network structure diagram of Chinese
universities. KH Coder3 can analyze text data in
TXT format, it has the functions of word
frequency statistics, part-of-speech analysis,
topic word generation, and visualization of the
relationships between text analysis objects. The
ways of visual display include histogram, line
graph, network graph and so on. Based on KH
Coder3‘s function of visually displaying the
relationships between text analysis objects, in
order to more intuitively and clearly observe the
relationships between keywords in the field of
scientific research efficiency in Chinese
universities. In this paper the keywords of the
scientific research efficiency subject literature in
colleges and universities will be sorted out, and
then convert them into a TXT file and import the
file into KHCoder3 software to construct a
scientific research network structure diagram of
Chinese colleges and universities.
3.2 research method
SNA is a sociological research method, which studies the network structure formed by different nodes based on relationships[13]. It not only analyzes the attribute characteristics of nodes, but also analyzes the overall characteristics of the network, which is helpful to discover the law of the existence of social relations[14]. SNA is mainly based on data mining and is represented by visual graphs and social network structures.
This research method can be used to establish the social relationship model and discover the social relationships among the actors in the community[15]. In this article, by using the social network analysis method, the thesis with the theme of "university scientific research efficiency" or "university scientific research efficiency" is regarded as a whole network, and the network structure characteristics of key words in the thesis are demonstrated through co-word analysis. At the same time, through the degree centrality and betweenness centrality of the social network analysis method, the keywords are analyzed to construct the current research hotspots, development status and development trend in the visual field of scientific research efficiency of Chinese colleges and universities with the subject words.
3.2.1 Degree centrality
Degree centrality, also understood as connection centrality, refers to the sum of the direct connections between a node and other nodes. The higher the sum, the more control the point has over other points in the network. For example, if you want to know which node has the most connections with other nodes, and judge who has the greatest centrality based on this, you need to know how many connections this node has with other nodes, and you need to judge by degree centrality. It is also sometimes expressed by the Size of the node. The larger the
Size of a node, the higher the centrality it occupies[16].
3.2.2 Betweenness centrality
Betweenness centrality refers to the number of times a node acts as the shortest bridge between two other nodes. The higher the number of times a node acts as a "betweenness", the greater its betweenness centrality. Betweenness centrality is measured by Betweenness centrality or relative Betweenness centrality. In common words in the network, the betweenness centrality said a high-frequency word co-occurrence network influence other high frequency words were now in the same paper size, namely whether other research topics of academic contact plays an important role, so the Betweenness centrality with high degrees of high-frequency words not only means the relationship with its co-occurrence of high frequency words, and also affect other high-frequency through the high-frequency word co-occurrence words.
Therefore, the higher the degree of Betweenness centrality, the greater the influence of high-frequency words on other high-frequency words and the whole network[17-18].
4. Analysis Results
In this article, 190 papers were searched in the CNKI database, and 254 keywords were obtained.
254 keywords were sorted out in Excel, and the
network structure of scientific research in
Chinese universities was studied from the
perspective of the network by using SNA. The
network structure was analyzed by using KH
Coder3 software, and the network structure of
scientific research in Chinese colleges and
universities was constructed. The network
structure of scientific research in Chinese
colleges and universities was analyzed from the
angle of degree centrality and intermediary centrality.
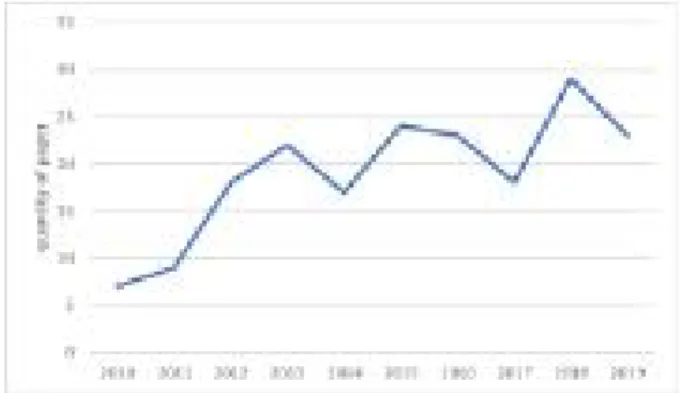
4.1 Document quantity characteristic According to the time series to view the distribution of related topic papers, can grasp the overall changes in the development of related topic papers. As shown in Fig. 1, according to the chronological distribution, the number of articles published from 2010 to 2011 was in single digits, and the number of articles published in 2012 was twice that of 2011, showing an explosive growth.
From 2013 to 2019, although there are also annual fluctuations, the overall trend is on the rise. (due to the time set for searching related papers in this article, the number of articles published 23 did not reflect the number of articles published in the whole year of 2019 as of September 30, 2019)
Fig. 1. Annual distribution of research literature
4.2 Keywords frequency characteristic Keywords are the embodiment of the central content of the paper. In this article, 190 related papers were searched through CNKI database and 254 keywords were obtained. As shown in Table 1, this article collects and sorts keywords, and arranges the top 20 keywords as shown in Table 1. The keyword with the highest frequency was "dea" (95 times), and the keyword with the fourth highest frequency was "malmquist index"
(41 times). This shows that dea method is the
most frequently used method by Chinese scholars to study the efficiency of scientific research in colleges and universities, followed by malmquist index method. Keywords such as' scientific research efficiency ', which ranked second, 'university', which ranked third, and 'scientific research in university', which ranked fifth, reflected the research theme of this article, and also reflected the accuracy of targeted search in this article when searching for related papers.
NO. Key word Frequency
1 DEA 95
2 Scientific research efficiency 64
3 University 49
4 Malmquist index 41
5 Scientific research in university 28
6 Efficiency evaluation 20
7 Humanities and science 10
8 Efficiency 9
9 Input output efficiency 9
10 Achievement evaluation 8
11 Scientific research 8
12 dea tobit 7
13 Input output 7
14 Regional difference 6
15 Scientific research management 6
16 Super efficiency dea 6
17 Super sbm 6
18 dea cross evaluation model 5
19 Scientific research expenditure 5
20 Scientific research innovation 5
Table 1. A list of high frequency words for efficiency research in universities
4.3 Representative body
This article analyzes the sources of relevant
papers. As shown in table 2, 190 papers have
been published in 122 journals, with an average
of 1.56 papers published in each journal. In this
article, the journal rankings are sorted out
according to the number of publications. The
number and proportion of publications of the
top five journals are shown in table 2. "Science
and Technology Management Research" acc
ounted for 7.9% of the total number of publications, including 15. The largest number of posts, the highest proportion. The number of 'Science Technology and Industry' publications accounted for 1.5% of the total, including three.
The number and proportion of articles published ranked fifth. In the top five journals 1, 2 and 5 journals belong to science and technology journals, thus it can be seen that most related to the efficiency of the university of science and
technology papers published in the journal of science and technology. This analysis shows that the quality of sci-tech journals can directly reflect the quality and level of scientific research achievements in colleges and universities.
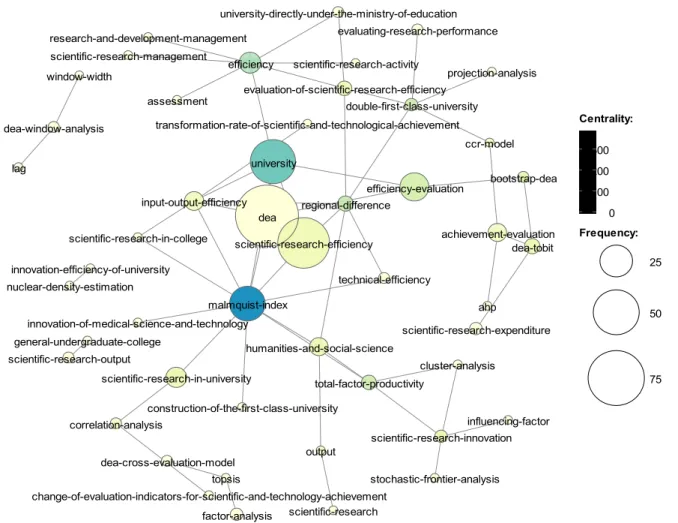
4.4 Construction of research network of scientific research efficiency in colleges and universities
Convert the node data stored in Excel into TXT text file and import it into KH Coder3 software to construct the network structure chart of scientific research efficiency in Chinese universities. The purpose of establishing the network structure diagram is to understand the hot spots of literature and the degree of connection between them more intuitively.
dea
scientific-research-efficiency university
malmquist-index
efficiency-evaluation efficiency
scientific-research-in-university input-output-efficiency
humanities-and-social-science
achievement-evaluation dea-tobit regional-difference
evaluation-of-scientific-research-efficiency
total-factor-productivity
double-first-class-university
scientific-research-expenditure
scientific-research-innovation bootstrap-dea
correlation-analysis
evaluating-research-performance
technical-efficiency university-directly-under-the-ministry-of-education
ahp assessment
ccr-model
change-of-evaluation-indicators-for-scientific-and-technology-achievement
cluster-analysis
construction-of-the-first-class-university scientific-research-output
general-undergraduate-college
influencing-factor innovation-of-medical-science-and-technology
dea-window-analysis
lag
innovation-efficiency-of-university nuclear-density-estimation
output
projection-analysis research-and-development-management
scientific-research scientific-research-activity
scientific-research-in-college scientific-research-management
stochastic-frontier-analysis
factor-analysis topsis dea-cross-evaluation-model
transformation-rate-of-scientific-and-technological-achievement window-width
0 100 200 300 Centrality:
Frequency:
25
50
75
Fig. 2. The network structure diagram of research efficiency in Chinese colleges and universities
Provenance The number
of papers Share Science and Technology Management 15 7.9%
Science Research Management 8 4.2%
Super Heilongjiang Researches on Higher
Education 5 2.6%
Super Modern Education Management 4 2.1%
Science Technology and Industry 3 1.5%
Table 2. Journal distribution of published literature
Although there are scattered individuals in Fig. 2, there are connections among the basic points.
Each circle in the figure represents a node. The more lines touching the node, the greater the center degree of the node. In other words, the more lines indicate the more connections and closer relations between the node and other nodes. As shown in Fig. 2, malmquist index, efficiency, university, input-output efficiency such as node is efficiency of China's scientific research mainly focus in the literature research on related subjects. The darker the color of the node, the more other nodes connected through the node, and the higher the betweenness centrality of the node, that is, the node is an important transportation hub connected by other nodes. As shown in Fig. 2, malmquist index, university, efficiency such as node has large betweenness centrality. They bear the communication of scientific research and scientific research to connect the intermediary.
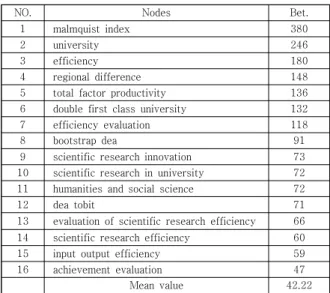
This article counts and ranks node data, and performs degree centrality analysis and betweenness centrality analysis. The mean value of degree centrality analysis is 2.45, and that of betweenness centrality analysis is 42.22. This article introduces the results of node analysis above the average value. There were 15 nodes above the mean of degree centrality and 16 nodes above the mean of betweenness centrality, as shown in Table 3 and Table 4.
4.5 Degree centrality analysis
Degree centrality is the sum of the direct connections between one node and other nodes.
The higher the sum, the stronger the centrality of the node in the network, the stronger the control power to other nodes, and the more important the node is in the network.
As can be seen from Table 3, in the research network of Chinese universities, each node is directly connected to 2.45 nodes on average. The degree centrality of the high-frequency words
malmquist index is the largest, indicating that it is at the center of the whole network and has the greatest influence in the field of scientific research in Chinese universities. It is proved that the malmquist index is the most widely used research method in universities. In addition, the efficiency, university, input output efficiency, regional difference, dea and double first-class university and other high frequency word centrality is higher, these high-frequency words are Chinese core keywords in the field of scientific research in colleges and universities.
NO. Nodes Deg.
1 malmquist index 11
2 efficiency 7
3 university 6
4 input output efficiency 6
5 regional difference 6
6 dea 5
7 double first class university 5
8 scientific research efficiency 4
9 humanities and social science 4
10 evaluation of scientific research efficiency 4
11 total factor productivity 4
12 scientific research innovation 4
13 efficiency evaluation 3
14 achievement evaluation 3
15 dea-tobit 3
Mean value 2.45
Table 3. The keywords network model degree centrality index
NO. Nodes Bet.
1 malmquist index 380
2 university 246
3 efficiency 180
4 regional difference 148
5 total factor productivity 136
6 double first class university 132
7 efficiency evaluation 118
8 bootstrap dea 91
9 scientific research innovation 73
10 scientific research in university 72
11 humanities and social science 72
12 dea tobit 71
13 evaluation of scientific research efficiency 66
14 scientific research efficiency 60
15 input output efficiency 59
16 achievement evaluation 47
Mean value 42.22