489 Corresponding author: [email protected]✽
참굴
( Crassostrea gigas )
유생의 절식에 따른 성장 및 체내 에너지원의 소비변화허영백✽・김태익1・이승주・허성범2
국립수산과학원 남동해수산연구소, 1국립수산과학원 남서해수산연구소,
2부경대학교 해양바이오신소재학과
Variations in Reserved Nutrient Consumption and Growth of Pacific Oyster (Crassostra gigas) Larvae during Starvation
Young Baek Hur*, Tae Eic Kim1, Seung Ju Lee and Sung Bum Hur2
Southeast Sea Fisheries Research Institute, NFRDI, Tongyeong 650-943, Korea
1Southwest Sea Fisheries Research Institute, Yeosu 650-943, Korea
2Department of Marine Bio-materials and Aquaculture, Pukyong National University, Busan 608-737, Korea
The nutritional demand of oyster larva (Crassostrea gigas) were investigated to determine the optimal culture conditions and improve micro-algae utilization. Changes in nutrients and shell growth were examined in fed and 96-h (48 h in late umbone stage) oysters at four larval stages. Shell growth increased significantly in D shape larvae, regardless of feeding variations. No growth was observed in starved larvae, except in shell length of umbone (to 11.9 μm). Fed larvae showed significant growth in all development stages (P < 0.05). During starvation, lipids were most significantly decreased in all larval stages (by 76.8%, 68.3%, 76.3%, and 40.3%, respectively), followed by protein (41.1%, 31.1%, 33.1%, 16.7%) and nitrogen-free extracts (40.8%, 24.3%, 36.9%, 20.1%), Gross energy (kcal/g) consumption in each larval stage was 49.6%, 35.1%, 39.1%, and 20.4%, respectively. Our results indicate that lipids are the most important energy source during the early larval development stages of C. gigas.
Key words: Pacific oyster, Crassostrea gigas, Larval growth, Starvation, Nutritional demand
서 론
최근 참굴 인공종묘생산의 산업화 기술이 확립 (Helm and Millican, 1977; Collet et al., 1999)됨에 따라 인공종묘 생산에 의한 종묘확보가 늘어나고 있는 추세로 미국의 서부해안에서 는 80%, 프랑스 10~20%로 보고 (Donaldson, 1989)되고, 국내에 서는 약 15% 정도가 생산되어 산업 현장에서 이용되고 있다.
그러나 인공종묘는 천연종묘에 비해 생산단가가 높고, 먹 이생물 배양 등 고난도의 기술이 필요함으로써 대량생산에 많은 어려움이 있다. 따라서 단위면적당 생산량을 높이고 초 기 유생의 폐사를 최소화시킬 수 있는 최적 생존조건을 구명 하는 것은 매우 중요한 일이다.
인공종묘의 생존율은 사육단계에 따라 많은 차이를 보이는 데, 수정에서 부착기까지는 0~18%로 매우 낮은 생존율을 보 이고 (Gallager et al., 1986), 부착기 유생에서 초기 부착치패 까지는 10~30% (Jones and Jones, 1983), 부착치패에서 30 mm 까지는 90~100% (Garcia-Esquivel et al., 2001)로 유생발달 단 계에 따라 폐사율이 다르게 나타나고 있다. 그렇지만, 아직까 지 근본적인 원인은 정확히 밝혀지지 않은 상태이다. 부분적 으로는 필요한 에너지 부족 또는 부유유생기 동안 특정 시기 에 영양적인 스트레스가 생리적인 조건과 결부되어 폐사로
이어지는 것으로 추정하고 있다.
이와 같은 이유로 건강한 유생 사육을 위한 영양조건을 구명하는 것은 매우 중요한 과제이며 (Newkirk et al., 1977;
Losee, 1979; Collet et al., 1999; Garcia-Esquivel et al., 2001) 인공종묘생산에서 공급되는 영양조건의 변화는 직접적으로 유생의 성장과 생화학적 조성 변화에 영향을 미치고, 유생사 육 조건의 질을 결정 한다 (Mann and Gallager, 1985; Gallager et al., 1986; His and Maurer, 1988; Ferreiro et al., 1990; Farias et al., 1998). 이와 같은 요인으로 인공종묘생산과정에서 유생 의 에너지 대사와 생화학적 영양 요구조건을 분석하여 정확한 먹이공급 방법을 규명하는 것은 건강한 유생사육을 위한 중요 한 요소 (Farias et al., 1998)이며 전반적인 인공종묘생산 과정 의 성공과 효율적인 먹이생물 관리의 기초적인 요소로 작용할 수 있다 (Hur et al., 2008).
참굴 유생의 영양조건에 관한 연구로는 공급되는 먹이생물 의 종류에 따른 생화학적 변화 (Holland and Spencer, 1973;
Gallager et al., 1986, His and Maurer, 1988; Rodriguez et al., 1990; Farias et al., 1998; Videla et al., 1998), 먹이 섭취 및 생리적 조건 (Gerdes, 1983a, b), 에너지 요구조건 (Holland and Spencer, 1973; Farias et al., 1998; Labarta et al., 1999) 등 다수의 연구결과가 있지만 대부분 사육 및 생리적 조건 등에 따라 그 요구조건이 다르므로 제 환경조건에 따른 영양
요구조건을 제 평가할 필요성이 있음을 강조하고 있는데, 지 금까지 상업적인 규모의 대량배양 조건에서 대량 유생사육을 위한 체계적인 영양요구조건을 밝힌 연구는 찾아보기 어렵다.
본 연구는 참굴 인공종묘생산에 필요한 효과적인 먹이생물 공급 관리를 위한 영양요구조건을 구명하고, 나아가 조개류 유생사육용 인공배합사료개발에 요구되는 기초적인 사료 설 계 자료를 얻기 위하여 상업적인 규모의 대량배양조건에서 인위적인 절식에 따른 축적 영양원의 이용도를 평가하여 기본 적인 참굴 유생의 영양요구 조건 밝히고자 실시하였다.
재료 및 방법
유생사육
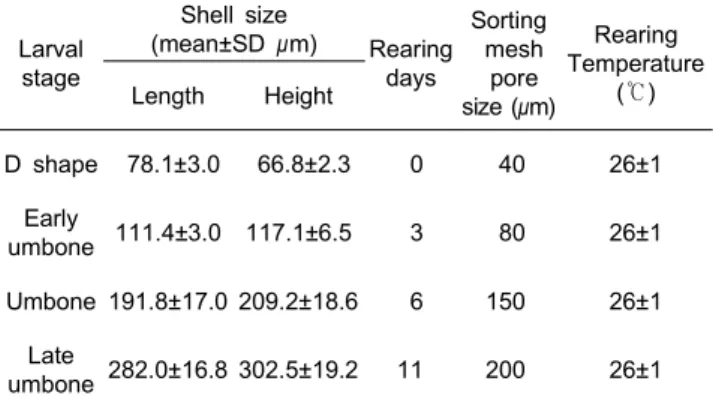
실험은 유생의 발달단계에 따라 D형, 초기 각정기, 각정기 및 후기 각정기 단계로 나누어 실시하였다. 실험 유생은 먼저 60톤 대형수조에서 대량 사육하면서 크기에 따른 발달단계별 로 선별망을 이용하여 선별하여 별도 여과해수가 채워진 10톤 콘크리트 수조에 수용하여 먹이공급구와 절식구로 설정하였 다 (Table 1).
Table 1. Shell size, rearing days and sorting mesh pore size of larval development stage of Crassostrea gigas
Larval stage
Shell size
(mean±SD μm) Rearing days
Sorting mesh pore size (μm)
Rearing Temperature Length Height (℃)
D shape 78.1±3.0 66.8±2.3 0 40 26±1
Early
umbone 111.4±3.0 117.1±6.5 3 80 26±1
Umbone 191.8±17.0 209.2±18.6 6 150 26±1
Late
umbone 282.0±16.8 302.5±19.2 11 200 26±1
D형 유생에서 각정기 유생 단계까지는 12, 24, 48, 96시간별 로 수거 후 성장 및 소모된 축적에너지 함량의 변화를 조사하 였고, 후기각정기 유생 단계는 48시간이 경과하면 대부분 사 육수조벽면 등에 부착하기 때문에 12, 24, 48시간 째 성장 및 에너지함량변화를 분석하였다 (n=3). 본 연구의 실험을 위해 사용한 어미는 남해특성화연구센터 패류중간육성장에 서 사육 중이던 만 1년생 참굴이었으며, 크기는 평균 각장 60.0±5.8 mm, 각고 107.4±11.3 mm, 전중 95.7±27.2 g이였다.
모든 과정의 유생사육은 지수식으로 행하였으며 사육수온 은 26±1℃로 조절하였고, 사육수는 일차 고압모래여과기로 여과한 후 규조토여과기로 2차 여과하여 망목크기 1μm의 bag filter로 3차의 여과과정을 거친 후 사용하였다. 환수는 2일마다 걸름망을 이용하여 사육 중인 전체 유생을 수거한 후 깨끗한 여과해수가 채워진 수조에 재 수용하는 방법으로 하였다. 먹이공급구에 공급된 먹이생물은 Isochrysis galbana (KMCC H-2), Cheatoceros gracilis (KMCC B-52), Pavlova
lutheri (KMCC H-006), Phaeodactylum tricornutum (KMCC B-14), Nannochloris oculata (KMCC C-31), Tetraselmis tetrathele (KMCC P-002)를 각각 30%:20%:20%:10%:10%:10%
의 비율로 혼합하여 일일 3회 공급하였다. 공급량은 초기 D형 유생을 기준으로 1회 공급 시 최초 0.3×10⁴ cells/mL으로 2일 간격으로 30%씩 증가시켜 주었다.
성장 및 성분분석
유생발달단계별 실험시간의 경과에 따라 성장변화를 조사 하기 위하여 시험구별로 100마리의 유생을 수거한 후 Profile-Project (Nikon-v12, Japan)와 Quadra-Chek 4000 Program (Metronics, USA)을 이용하여 각장과 각고를 0.1 μm 까지 측정하였다. 성분 분석용 시료는 다른 점액질 및 불순물 을 제거하기 위하여 깨끗한 여과해수로 3회 세척한 후 다시 염분기를 제거하기 위하여 증류수로 1회 세척하였다. 수분, 습중량, 건중량 및 회분제외건중량 (AFDW)은 시료수집 후 바로 처리하였고, 체성분 분석용 시료는 전 처리 후 곧 바로 -75℃에서 급냉 후 진공동결건조기로 건조시킨 다음 분석 전 까지 -75℃에서 보관하였다.
일반성분은 AOAC (1995) 방법에 따라 수분은 상압가열건 조법 (105℃, 4시간), 조단백질은 Kjeldahl 질소정량법 (N×6.25)으로 분석하였고, 조회분은 직접회화법으로 분석하 였다. 조지방은 시료를 12시간 동결 건조한 후, Soxtec system 1046 (Tacator AB, Sweden)을 사용하여 soxhlet 추출법으로 분석하였다.
통계처리
결과의 통계처리는 SPSS 프로그램을 사용하여 ANOVA- test를 실시한 후, Duncan's multiple range test (Duncan's, 1955) 로 평균간의 유의성 (P<0.05)을 검정하였다.
결과 및 고찰
참굴 유생의 발달단계별 요구되는 영양소의 변화를 조사하 기 위하여 일시적인 기아 실험을 발달단계별로 실시한 결과 실험 종료 시 각장과 각고의 크기 변화는 먹이공급 유무에 따라 유의적인 차이를 보였다 (P<0.05, n=100).
각 단계별 실험종료 시 먹이 공급구와 절식 실험구에서 각장과 각고의 크기 변화를 조사한 결과 D형 발달단계는 각각 평균 33.3 μm와 50.3 μm, 5.9 μm와 8.7 μm로 먹이공급 유무에 관계없이 모두 유의적인 성장을 보였지만, 먹이공급 실험구가 절식 실험구에 비해 5배 이상 높은 유의적인 성장을 보였다. 초기 각정기 단계의 경우는 각각 평균 80.4 μm와 92.1 μm, -2.7 μm와 -2.8 μm로 먹이를 공급한 실험구에서는 각장과 각고 모두 유의적인 성장을 하였지만, 절식 실험구는 유의적인 변화 없이 감소하는 경향을 보였다. 절식 실험구에 서 마이너스(-) 성장을 보인 것은 일부 큰 개체가 폐사함으로 써 전체 평균크기에 영향을 미친 결과로 보인다. D형과 초기 각정기 단계에서 영양적으로 가장 크게 작용하는 것은 난내 축적된 에너지원으로 주로 난황물질에 의존하게 되는데, D형 발달단계에서 먹이를 공급하지 않은 경우에도 일부 성장이
관찰된 것은 축적된 난황물질을 이용한 결과로 사료된다. 이 와 같은 이유로 난질은 매우 중요한데, 주로 배발생 및 먹이섭 취이전 유생단계 (Gallager et al., 1986; Couturier and Newkirk, 1987) 뿐 만 아니라, 전체 유생의 성장, 부착, 치패성장과 생존 에도 난질이 영향을 미치는 것으로 보고되고 있다 (Wilson et al., 1996).
각정기 단계는 평균 각장과 각고의 변화가 먹이공급구는 각각 90.2 μm와 93.3 μm 매우 높은 성장을 보였지만, 절식 실험구는 각각 11.9 μm와 10.4 μm로 일부 성장 변화를 보였 지만, 각고의 경우는 초기 실험개시 시에 비해 유의적인 성장 차이를 보이지 않았다. 후기 각정기 단계의 실험종료 시 평균 각장과 각고의 성장변화는 먹이 공급구에서는 각각 40.2 μm 와 38.9 μm로 성장하였지만, 절식 실험구에서는 각장은 성장 변화가 없었고, 각고는 11.1 μm로 초기 실험개시 시에 비해 어느 정도 성장변화를 보였지만, 유의적인 변화는 나타나지 않다 (Table 2).
Table 2. Growth of Crassostrea gigas larvae by starvation and feeding trial
Larval stage
Size (µm) Rearing
hours
Initial Un-fed Fed
D shape
S.L1 78.1±3.0a 84.0±2.7b 111.4±5.4c 96 S.H2 66.8±2.3a 75.5±2.8b 117.1±6.5c
Early umbone
S.L 111.4±3.0a 108.7±4.6a 191.8±17.0b 96 S.H 117.1±6.5a 114.3±6.4a 209.2±18.6b
Umbone
S.L 191.8±17.0a 203.7±14.2b 282.0±16.8c 96 S.H 209.2±18.6a 219.6±14.9a 302.5±19.2b
Late umbone
S.L 282.0±16.8a 282.0±11.9a 322.2±11.9b 48 S.H 302.5±19.2a 313.6±21.2a 341.4±16.9b
1S.L : Shell length.
2S.H : Shell height.
Values (means±SD, n=100) with different superscripts in the same row are significantly different at P<0.05.
실험구별 실험 시간경과에 따른 발달단계별 각고의 성장변 화를 조사한 결과 D형 유생 단계의 경우 먹이 공급구에서는 실험 12시간째 평균 6.8 μm로 성장변화를 보이면서 모든 조사 시간대별로 유의적인 성장변화를 보였다. 절식 실험구에 서도 실험 12시간째부터 2.3 μm로 성장하면서 실험 개시 시에 비해 유의적인 성장변화를 보였지만, 48시간대 이후에서 는 유의적인 성장변화가 나타나지 않았다 (P<0.05). 초기 각 정기 유생 단계의 경우는 먹이 공급구는 D형 유생단계와 비슷 한 경향을 보였지만, 절식 실험구는 48시간째 초기 평균 각고 117.1 μm에서 119.7 μm로 2.6 μm 성장한 후 96시간째에는 -2.8 μm로 감소하는 경향을 보였는데, 이와 같은 결과는 시간 이 경과함에 따라 비교적 큰 개체들이 많이 폐사함에 따라
나타난 현상으로 보인다. 각정기 및 후기 각정기 유생단계에 서도 먹이 공급구에서는 모두 조사 시간이 경과함에 따라 유의적인 성장변화를 보이지만, 절식 실험구에서는 유의적 (P<0.05)인 변화가 나타나지 않았다 (Fig. 1).
Fig. 1. Change of shell hight of Crassostrea gigas larvae at each rearing times by starvation and feeding trial. The data presented are the average size of three replicates.
Different superscripts on the bar are significantly different at P<0.05, based on ANOVA. Error bars represent ± SD.
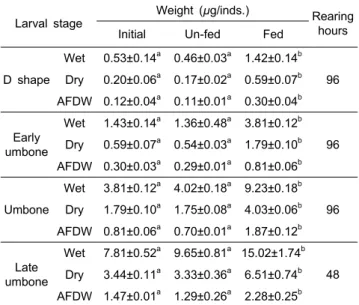
먹이공급의 중요성은 체내 영양소의 변화를 보면 명확히 알 수 있는데, 본 실험의 결과 (Table 3) 먹이 공급구에서는 모든 유생 발달단계에서 조사된 체중 성장요소가 실험 개시 때에 비해 유의적 (P<0.05)으로 증가한 경향을 보이지만, 절 식 실험구에서는 각정기와 후기 각정기 유생 단계에서 습중량 이 개시 시에 비해 일부 증가하였으나, 건중량과 회제거건중 량 (AFDW)는 모든 발달단계에서 감소하는 경향이 나타났다.
그러나 모든 발달단계에서 무게변화의 유의적인 차이는 나타 나지 않았다 (Table 3).
Table 3. Variation of wet weight, dry weight and ash free dry weight (AFDW) of Crassostrea gigas larvae on the various larval development stage of fed and un-fed
Larval stage
Weight (µg/inds.) Rearing hours
Initial Un-fed Fed
D shape
Wet 0.53±0.14a 0.46±0.03a 1.42±0.14b 96 Dry 0.20±0.06a 0.17±0.02a 0.59±0.07b AFDW 0.12±0.04a 0.11±0.01a 0.30±0.04b
Early umbone
Wet 1.43±0.14a 1.36±0.48a 3.81±0.12b 96 Dry 0.59±0.07a 0.54±0.03a 1.79±0.10b AFDW 0.30±0.03a 0.29±0.01a 0.81±0.06b
Umbone
Wet 3.81±0.12a 4.02±0.18a 9.23±0.18b 96 Dry 1.79±0.10a 1.75±0.08a 4.03±0.06b AFDW 0.81±0.06a 0.70±0.01a 1.87±0.12b
Late umbone
Wet 7.81±0.52a 9.65±0.81a 15.02±1.74b 48 Dry 3.44±0.11a 3.33±0.36a 6.51±0.74b AFDW 1.47±0.01a 1.29±0.26a 2.28±0.25b
Values (means±SD, n=3) with different superscripts in the same row are significantly different at P<0.05.
한편, 유생 발달단계별 절식시간에 따른 축적 유기물질의 변화를 알아보기 위하여 조단백질, 조지질 및 nitrate free extract (NFE)의 조성변화를 조사하여 Table 4에 나타내었다.
모든 유생발달단계에서 유기물질 중 가장 높은 조성을 보인 것은 조단백질 이었고, 다음으로 NFE, 조지질 순이었다. 한편, 절식 시간 경과에 따라 전체 영양소를 구성하고 있는 총 유기 물질의 변화는 개시 시에 비해 실험종료 시 모든 발달단계에 서 감소하였다. 영양소별로 단백질은 D형, 초기각정기, 각정 기, 후기각정기 발달단계에서 절식 12 시간부터 유의적으로 감소하기 시작하여 절식 96시간 (후기각정기 48시간) 동안 각각 평균 41.1%, 31.1%, 33.1% 및 16.7% 감소하였다. 지질은 전체 영양소 중 가장 높은 감소율을 보였는데, 전 유생발달단 계에서 대체적으로 시간경과에 따라 유의적으로 감소하여 실험 종료 시 발달단계에 따라 각각 76.8%, 68.3%, 76.3%
및 40.3% 감소하였다. 회분은 전체적으로 실험기간이 경과함 에 성장에 따른 패각 형성과 관련하여 유의적으로 증가하는 경향을 보였다.
한편, 탄수화물 함량으로 대변되면 Nitrogen free extracts (NFE) 함량은 단백질과 지질에 비해 비교적 적은 감소를 보였 는데, 실험종료 시 각 발달단계에 따라 각각 13.6%, 5.9%, 11.9% 및 7.9%로 개시 시에 비해 유의적인 감소를 보였다.
이에 따라 총에너지 함량의 변화는 유생발달단계에 따라 실험 종료 시 각각 49.6%, 35.1%, 39.1% 및 20.4%로 유의적인 감소 를 보였다. 이와 같은 결과는 지질이 유생의 성장기 또는 기아 시 주 에너지원으로 이용되어 진다 (Millar and Scott, 1967;
Utting, 1986)점을 알 수 있고, 전체 유생사육 기간 동안 축적된 지질의 함량이 유생의 성장활력에 많은 영향을 미칠 수 것으 로 사료된다.
Table 4. Proximate body composition of crude protein, lipid, ash, nitrogen free extracts (NFE) and gross energy (GE) content of Crassostrea gigas larvae during starvation (dry weight based)
Larval stage
Starved times (hours)
Proximate body composition (mean±SD, %)
Gross energy (kcal/g/dry) Moisture Protein Lipids Ash NFE
D shape
Initial 2.13±0.20 15.17±0.40a 2.47±0.15a 77.03±0.20a 3.2±0.70a 95.67±1.89a 12 1.37±0.31 12.57±0.50b 1.73±0.06b 82.87±0.57b 1.47±0.50b 72.80±2.21b 24 1.67±0.06 12.10±0.36b 1.37±0.12c 82.90±0.53b 1.97±0.92b 70.01±1.56b 48 1.23±0.06 11.77±0.75b 0.90±0.10d 84.13±0.40c 1.97±0.50b 64.88±1.85c 96 1.13±0.06 8.93±0.21b 0.57±0.12e 98.17±0.32d 1.83±0.32b 49.75±0.80d
Early umbone
Initial 1.20±0.10 12.63±0.12a 1.07±0.12a 82.23±0.25a 2.87±0.29a 73.63±0.84a 12 1.40±0.17 11.40±0.10b 0.63±0.06b 84.00±0.00b 2.57±0.29a 61.57±0.65b 24 2.43±0.06 10.90±0.53b0.53±0.06bc83.87±0.59bc 2.27±0.58a 59.57±2.44bc 48 1.27±0.06 9.77±0.31c 0.43±0.06cd 85.87±0.68c 2.67±0.39a 53.63±3.31c 96 1.50±0.10 8.70±0.10d 0.33±0.06d 87.07±0.25d 2.17±0.15a 46.47±0.60d
Umbone
Initial 1.23±0.06 17.63±0.45a 1.40±0.10a 74.23±0.55a 5.50±0.26a105.13±1.59a 12 1.87±0.12 15.60±0.44b 0.93±0.06b 76.80±0.30b4.80±0.79ab 90.00±1.85b 24 1.00±0.10 14.80±0.20bc0.77±0.06bc 79.70±0.36c 3.73±0.67b 81.03±1.59c 48 1.53±0.06 13.10±0.01c 0.63±0.06c 81.20±0.36d 3.53±0.49b 74.93±1.52d 96 1.33±0.06 11.80±0.30d 0.30±0.06d 83.07±0.31e 3.47±0.06b 64.07±1.23e
Late umbone
Initial 1.43±0.06 22.40±0.36a 1.90±0.10a 69.13±0.35a 5.13±0.12a127.23±1.90a 12 1.53±0.06 20.87±0.31b 1.43±0.06b 71.37±0.12b 4.80±0.35a115.57±0.49b 24 1.70±0.10 19.43±0.59c1.27±0.06bc 73.40±0.57c 4.20±0.17b109.39±1.70c 48 1.53±0.06 18.67±0.38c 1.13±0.06c 74.57±0.41d 4.10±0.10b101.27±2.11c Values (means±SD, n=3) with different superscripts in the same column are significantly different at P<0.05.
한편 Utting (1986)은 버지니아굴, Crassostrea virginica을 크기별로 3일간 기아시켰을 때 전체 지질이 72.8~36.9%의 감소를 보였고, Mann and Gallager (1985)는 일시적인 기아 시 탄수화물은 무시할 수준의 변화를 보였지만, 단백질은 40~70%가 줄어들어 지질 다음으로 중요한 에너지원으로 이 용됨을 보고하였다. 본 실험에서 비록 종과 사육온도는 달랐 지만, 각각의 영양소별 감소율은 발달단계에 따라 지질 76.8~40.3%, 단백질 41.1~16.7%, 탄수화물로 대변되는 NFE의 감소율 40.8∼20.1%를 보여 전체적으로 절식기간 동안 가장 많은 소비율을 보인 영양소는 지질이었으며 버지니아굴에 대한 Utting (1986)과 Mann and Gallager (1985)의 결과와 비슷 한 경향을 보였다. 이러한 결과에 비추어보면 지질은 해산 이매패류의 부유유생기 동안 주 축적 에너지원으로서 매우 중요한 역할을 하며 (Holland and Spencer, 1973; Waldock and Nascimento, 1979) 유생 발달 동안 지질의 결핍이 발생할 경우 유생의 발달이 지연되거나 사망할 가능성이 매우 높은 것으로
사료된다. 그런데 본 조사에서는 단백질과 탄수화물의 감소율 이 비슷한 경향으로 축적에너지 이용성에 있어 상기 보고와 비교하여 단백질은 어느 정도 비슷한 경향이지만, 탄수화물 (NFE)의 이용성에는 많은 차이를 보였다. 이와 같은 결과는 사육환경 조건의 차이에서 유래된 것으로 보이지만, 향 후 보다 다양한 조건에서 깊이 있는 연구가 있어야 될 것으로 사료된다. 한편, 단백질은 중요한 생화학적 요소 (Whyte, 1987;
Whyte et al., 1990; His and Maurer, 1988)로 조직구성 및 필요시 에너지원으로 이용되고, 탄수화물은 전체 유생의 유기물질 중 5%이하로 그 에너지원으로서의 중요성이 지질과 단백질 에 비해 낮다고 하였다.
일반적으로 전체 대사 가능한 에너지의 구성 비율은 해산 무척추동물의 유생을 안정적이고 건강하게 사육하기 위해서 는 매우 중요 (Lucas, 1990)하기 때문에 이용 가능한 영양소의 균형을 맞추기 위해서는 올바른 먹이생물의 공급이 매우 중요 하다. 본 실험의 결과로 보아 참굴 유생의 발달단계에 따른 영양소별 소비율의 변화와 결핍에 따른 성장변화의 파악은 가능하지만, 각각의 영양소별 결핍에 따른 정확한 현상을 파 악하는 데는 어려움이 있다. 뿐만 아니라, 생물이 요구하는 영양원은 크기와 환경조건에 따라 달라지기 때문에 성공적인 상업적 인공종묘생산을 위해서는 보다 다양한 조건에서 깊이 있는 유생의 영양요구조건에 대한 연구가 진행 되어야 할 것이다.
사 사
본 연구는 국립수산과학원 수산시험연구사업비 (RP-2009- AQ-027) 지원에 의해 수행된 연구결과입니다.
참고문헌
AOAC. 1995. Official methods of Analysis, 16th ed., Association of Official Analytical Chemists.
Washington, D.C., U.S.A. 69-74.
Collet B, Boudry P, Thebault A, Heurtebise S, Morand B and Gérard A. 1999. Relationship between pre- and post-metamorphic growth in the Pacific oyster Crassostrea gigas (Thunberg). Aquaculture 175, 215-226.
Couturicr CY and Newkirk GF. 1987. Aspects of reproduction and larval production in Placopecten magellanicus held in a semi-natural environment.
Proc. Annu Meet Aquacult Assoc Canada 1, 26-27.
Donaldson J. 1989. Overview of and operating oyster hatchery. In: Fourth Alaska aquaculture conference.
Keeler S, eds. November 1987, 77-81.
Duncan DB. 1955. Multiple-rage and multiple F tests.
Biomerics 11, 1-42.
Farias A, Uriarte I and Castilla JC. 1998. A biochemical study of the larval and postlarval stages of the Chilean scallop Arogpecten purpuratus. Aquaculture
166, 37-47.
Ferreiro MJ, Perez-Camacho A, Labarta U, Beiras R, Planas M and Fernández-Reiriz MJ. 1990. Changes in the biochemical composition of Ostrea edulis larvae fed on different food regimes. Marine Biology 106, 395-401.
Gallager SM, Mann R and Sasaki GC. 1986. Lipid as an index of growth and viability in three species of bivalve larvae. Aquaculture 56, 81-103.
Garcia-Esquivel Z, Bricelj VM and Gonzalez-Gomez MA.
2001. Physiological basis for energy demands and early postlarval mortality in the Pacific oyster, Crassostrea gigas. J Exp Mar Biol Ecology 263, 77-103.
Gerdes D. 1983a. The Pacific oyster Crassostrea gigas:
Part Ⅰ. Feeding behaviour of larvae and adults.
Aquaculture 31, 195-219.
Gerdes D. 1983b. The Pacific oyster Crassostrea gigas:
Part Ⅱ. Oxygen consumption of larvae and adults.
Aquaculture 31, 221-231.
Helm MM and Millican PF. 1977. Experiments in the hatchery rearing of Pacific oyster larvae (Crassostrea gigas Thunberg). Aquaculture 11, 1-12.
His E and Maurer D. 1988. Shell growth and gross biochemical composition of oyster larvae (Crassostrea gigas) in the field. Aquaculture 69, 185-194.
Holland DL and Spencer BE. 1973. Biochemical changes in fed and starved oysters, Ostrea edulis L. during larval development, metamorphosis and early spat growth. J Mar Biol Assoc UK 53, 287-298.
Hur YB, Min KS, Kim TE, Lee SJ and Hur SB. 2008.
Larvae growth and biochemical composition change of the Pacific Oyster Crassostrea gigas, Larvae during artificial seed production. J Aquaculture 21, 203-212.
Jones G and Jones B. 1983. Methods for setting hatchery produced oyster larvae. Marine Resources Branch, Ministry of Environment, Information Report No. 4, BC, Canada, 94.
Labarta U, Fernandez-Reiriz MJ and Perez-Camacho A.
1999. Energy, biochemical substrates and growth in the larval development, metamorphosis and postlarvae of Ostrea edulis (L.). J Exp Mar Biol Ecology 238, 225-242.
Losee E. 1979. Relationship between larval and spat growth rates in the oyster (Crassostrea virginica).
Aquaculture 16, 123-126.
Lucas A. 1990. Feeding and digestion in bivalve larvae,
In: Proc, of Memorial Symposium in Honor of Sir Charles Maurice Yonge. Morton B. eds. Hong Kong, 173-190.
Mann R and Gallager SM. 1985. Physiological and biochemical energetics of larvae of Teredo navalis L. and Bankia gouldi (Bartsch) (Bivalvia:
Teredinidae). J Exp Mar Ecology 85, 211-228.
Miller RJ and Scott JM. 1967. The larvae of the oyster Ostrea edulis during starvation. J Mar Biol Assoc UK 47, 475-484.
Newkirk GF, Haley LE, Waugh DL and Doyle R. 1977.
Genetics of larvae and spat growth rate in th oyster Crassostrea virginica. Marine biology 41, 49-52.
Rodriguez JL, Sedano FJ, Garcia-Martin LO, Perez-Camacho A and Sanchez JL. 1990. Energy metabolism of newly settled Ostrea edulis spat during metamorphosis. Mar Biology 106, 109-111.
Utting SD. 1986. A preliminary study on growth of Crassostrea gigas larvae and spat in relation to dietary protein. Aquaculture 56, 123-138.
Videla JA, Chaparro OR and Thompson RJ. 1998. Role of biochemical energy reserves in the metamorphosis
and early development of the oyster Ostrea chilensis.
Mar Biology 132, 635-640.
Waldock MJ and Nascimento IA. 1979. The triacyglycerol composition of Crassostrea gigas larvae fed on different algal diets. Mar Biol Letter 1, 77-86.
Whyte JNC. 1987. Biochemical compostion and energy content six species of phytoplankton used in mariculture of bivalves. Aquaculture 60, 231-241.
Whyte JNC, Bourne N and Ginthe NG. 1990. Biochemical and energy changes during embryogenesis in th rock scallop, Crassadoma gigantea (Gray). Aquaculture 86, 25-40.
Wilson JA, Chaparro OR and Thompson RJ. 1996. The importance of broodstock nutrition on the viability of larvae and spat in the Chilenan oyster Ostrea chilensis. Aquaculture 139, 63-75.
2009년 10월 5일 접수 2010년 7월 14일 수정 2010년 10월 11일 수리