Airway Airway Airway
Airway
Narrowing Narrowing Narrowing Narrowing
Patterns Patterns Patterns Patterns
during during during during
Obstructive Obstructive Obstructive Obstructive
Sleep Sleep Sleep Sleep
Apnea Apnea: Apnea Apnea : : : Airway
Airway Airway
Airway
CT CT CT CT
and and and and
Multi Multi- Multi Multi -- -level level level level
Airway Airway Airway Airway
Pressure Pressure Pressure Pressure
Monitoring Monitoring Monitoring Monitoring
SeungCheolJeong,3 SeungBongHong,1 SeungHyunKyung,2 HooWon Kim1
ABSTRACT
Objectives: To investigate the airway narrowing patterns by multi-level airway pressure(MAP) monitoring during sleep and to
evaluate the value of CT scan taken during waking and sleep apneic periods to identify the level of airway narrowing(LAN) in patients with obstructive sleep apnea syndrome(OSAS).
Methods: Eleven patients with OSAS underwent a night polysomnography with continuous MAP monitoring by 4-sensor(placed at nasopharynx, caudal-uvula, hypopharynx, esophagus) or 2-sensor(placed at caudal-uvula and esophagus) catheter. All patients had cine CT at five levels of high retro and alatal, low retropalatal, retroglossal, epiglottis and hypopharynx during awake and sleep periods. In each patient, LAN determined by CT scan(LANCT) during sleep apnea was compared with LAN by MAP monitoring(LANMAP).
Results: MAP monitoring showed that four patients(36%) had a single pattern of LAN while the other seven patients(64%) showed two or more different LANs in different apneic episodes. Velopharynx was the most common level of frequently observed airway narrowing during sleep apnea(63.6%). However, a single pattern of airway narrowing was more frequent(72.7%) in airway CT during sleep apnea. Velopharynx was the most common narrowest level also in apneic CT(66%). In comparing LANCT with LANMAP, the LANCT of five patients(45.5%) were high-concordant, those of another five(45.5%) low-concordant, and that of one(9%) discordant with LANMAP.
Conclusions: Cine CT scan during the awake state or sleep apnea may not reflect the LAN correctly in OSAS because most patients showed two or more different airway narrowing patterns during different episodes of sleep apnea in each patient. Sleep Medicine and Psychophysiology 1999;;;7((((1)))):; ::18-26 :
Key words: Obstructive sleep apnea syndrome·Multi-level airway pressure monitoring·Airway CT·Airway narrowing pattern.
INTRODUCTION
Obstructive sleep apnea syndrome(OSAS) increases mo- rtality and morbidity with a grave impact on the patients’
quality of life(1,2). For the best treatment of patients with OSAS, it is fundamental to find the accurate level of airway
narrowing(LAN) during sleep apnea. Diverse diagnostic modalities have been used to identify the exact LAN in OSAS, which include cephalometry, computed tomography, magnetic resonance imaging, fluoroscopy, nasopharyngo- scopy, acoustic reflection studies, and functional studies such as airway pressure monitoring(3-6). In spite of the relatively expensive cost, upper airway CT scan is a useful method for studying the physiologic changes of airway during res- piration and to evaluate the pathogenesis of OSAS. Recently, cine CT scan is superior to the conventional CT scan bec- ause of the faster imaging process that provides the cap- ability of obtaining multiple images of the upper airway under a variety of physiologic conditions(4). Previous upper airway CT studies suggest that the retropalatal or retro- glossal region is the primary site of obstruction in patients with OSAS(5,7-10). However, CT studies have also limit- ations because most studies were performed during the
1성균관대학교 의과대학 삼성서울병원 신경과학교실
Department of Neurology, Samsung Medical Center, Sungkyunkwan University School of Medicine, Seoul, Korea
2성균관대학교 의과대학 삼성서울병원 교정과학교실
Department of Orthodontics, Samsung Medical Center, Sungkyun- kwan University School of Medicine, Seoul, Korea
3한림대학교병원 신경과
Department of Neurology, Hallym University Hostpital, Seoul, Korea
1이화여자대학교 의과대학 신경정신과학교실
Corresponding author: Seung Bong Hong, Department of Neurology, Samsung Medical Center, Sungkyunkwan University School of Medi- cine, Ilwon-Dong 50, Kangnam-Ku, Seoul 135-710, Korea
Tel: 02) 3410-3592, Fax: 02) 3410-0052 E-mail: [email protected]
waking state. Although several CT studies had been per- formed during sleep apnea(11-12), they didn’t reflect the whole picture of the airway status during sleep because only a few apneic episodes were analyzed.
Since Hudgel et al.(13) measured the airway pressure continuously during sleep in patients with OSAS, several studies have been performed to evaluate OSAS patients by airway pressure monitoring (14-19). Continuous multilevel airway pressure(MAP) monitoring is a valuable diagnostic tool, if the pressure sensors are located adequately. The MAP monitoring is an inexpensive method that registers the continuous changes of airway pressure at multiple levels and this may reflect the serial dynamic changes of the upper airway throughout the night sleep in patients with OSAS.
In this study, we aimed to analyze the pattern of airway narrowing detected by MAP monitoring during sleep apnea and to evaluate the value of cine CT scan taken during awake breathing and sleep apneic period to identify the LAN in OSAS patients.
METHODS
Of the fifteen patients with OSAS, four patients were excluded because they didn’t fall asleep during the cine CT scan. So nine male and two female patients participated in this study. All subjects were free of other respiratory or upper airway diseases. Their mean age was 51.6±8.6 years and mean body mass index(BMI) was 26.3±2.6 kg/m2.
All patients underwent a night polysomnography using a polygraph(Alice 3;Healthdyne tech., Marietta, Georgia. or S-series;Compumedic Pty Ltd., Abbotsford, Australia) to record the electroencephalograms(EEG) from the central and occipital leads(C3-A2, C4-A1, O1-A2, O2-A1), left, right, superior and inferior electrooculgrams(EOG), sub- mental electromyograms(EMG), nasal airflow, thoracoab- dominal wall motion, electrocardiogram(ECG), snoring with microphone, right and left leg movement and oxyh- emoglobin saturation(Model 8600;Nonin Medical Inc., Plymouth, MN.). Two polysomnography technologists sc- ored the recordings according to the standard criteria(20) using 30-second epoch. Reduction of more than 90% of airflow lasting for ≥10 s was defined as apnea. Hypopneas were defined as 50-90% reduction in airflow for ≥10 s or arousal associated with ≥4% fall in arterial oxygen satu- ration. Apnea-hypopnea index(AHI) defined as the mean number of apneas or hypopneas per hour of sleep were calculated from the polysomnograms.
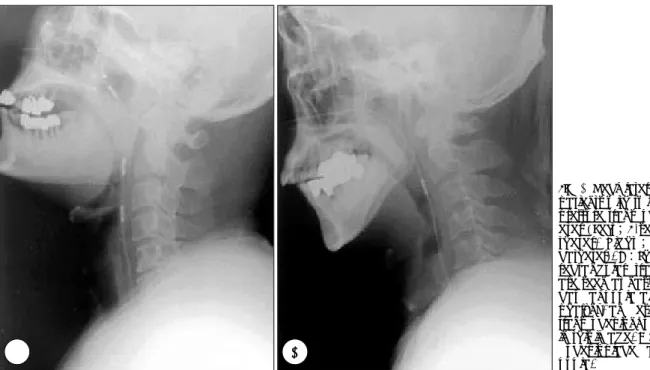
Airway pressure was monitored using a catheter tip pre- ssure transducer with 2-sensor catheter(Model CTO-2, Ga- eltec Ltd., Dunvegan, Scotland) in six patients and 4-sensor catheter(Model CTO-4, Gaeltec Ltd., Dunvegan, Scotland) in five patients. The sensors of 4-sensor catheter were lo- cated at the nasopharynx, caudaluvula, hypopharynx and esophagus and the probes of 2-sensor catheter were located at the caudaluvula and the esophagus(Fig. 1). The pressure differences between the baseline, and during apnea or hypo-
Fig. 1. Neck lateral x-ray of patients with two kinds of pressure transducer cath- eter (Left;4-sensor ca- theter, Right ; 2-sensor catheter). A:Three white rectangular transducers are seen at nasopharynx, caudal uvula and hypo- pharynx, and esophageal transducer is not visualized in this image. B:A trans- ducer is placed at caudal uvula.
AA
AA BBBB
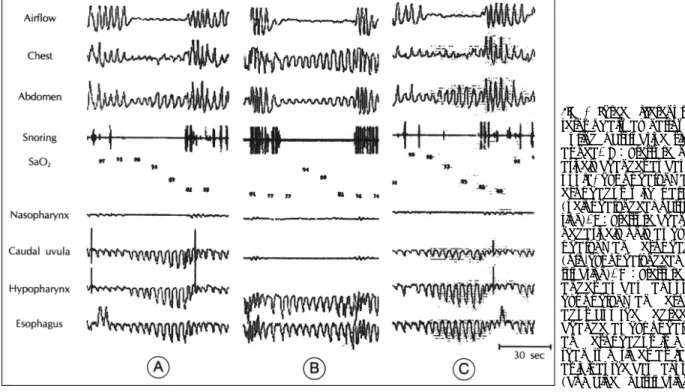
pnea at each level of sensor were measured(dPn, pressure change at nasopharynx;dPo, at oropharynx;dPh, at hypo- pharynx;dPe, at esophagus). The levels of airway narro- wing determined by MAP monitoring(LANMAP) were cla- ssified as 1) velopharynx(VP) when dPn did not change but dPo, dPh and dPe changed negatively with parallel, 2) oro-hypopharynx(OHP) when only dPh and dPe changed negatively, and 3) combined obstruction(CB) if dPo, dPh and dPe changed negatively, but the degree of change at dPh or dPe was more than two times as large as it was at dPo(Fig. 2). Apneas and hypopneas of up to 100 episodes in each patient were evaluated and the most frequent pa- ttern of airway narrowing(LANMAP1) and the other patterns (LANMAP2) were determined. If LANMAP1 was more than 90 percent, LANMAP was considered as a single pattern of obstruction and if not, as a multiple pattern.
Cine CT studies of the upper airway were performed us- ing a CT scanner(High-speed Advantage, GE medical sys- tems, Milwaukee, Wis.). All subjects were studied during the awake and asleep periods in a supine position with simultaneous monitoring of modified polysomnograms(EEG, EOG, submental EMG, airflow, chest and abdominal move- ment channels) to assess sleep, wakefulness and apneahy- popnea. At first, patients were instructed to hold their breath in the supine position and a preview scan(sagittal projec- tion image) was taken to localize the exact levels of interest, i.e. high retropalatal, low retropalatal, retroglossal, epiglottis
and hypopharynx levels. Waking CT scans were performed during the tidal breathing and 10 images were taken for 10 seconds with 1 second interval to include about 2 complete respiratory cycles. After acquisition of 50 waking CT ima- ges at all 5 levels, patients were encouraged to sleep. Apneic scans were performed when the airflow showed more than 50% reduction from the baseline. Each patient’s apneic im- ages of 5 airway levels were checked at one apneahypo- pnea episode. All CT scans were transferred to GE PACS (Picture Archiving and Communication System, GE medical systems, Milwaukee, Wis.) and cross-sectional areas were traced manually by an assigned technician(WS Tae).
The level of airway obstruction by cross-sectional CT area(LANCT) was determined by primary narrowing level (LANCT1) and other narrowing levels(LANCT2). LANCT1
was defined as the narrowest segment through five airway levels during apnea-hypopnea with significant reduction in the size of the airway(more than 70% of ANR;airway na- rrowing rate, see below equation-(1)). LANCT2 was defined as the other narrow segments with significant airway redu- ction. If ANRs of all segments did not exceed 70%, LANCT
was determined as the narrowest segment through five upper airway levels but it must be smaller than the minimal wak- ing area at that level. LANCT was classified as 1) velopha- rynx(VP) if LANCT1 and LANCT2 were present only at the high or low retropalatal level, 2) oro-hypo pharynx (OHP) if at retroglossal, epiglottis or hypopharynx and 3) combined
Fig. 2. Three different pat- terns of airway narrowing during obstructive sleep apnea. A:Pressure neg- atively changes at caudal uvula, hypopharynx and esophagus with parallel (velopharyngeal obstruc- tion). B:Pressure changes negatively only at hypo- pharynx and esophagus (oro-hypopharyngeal ob- struction). C:Pressure ch- anges at caudal uvula, hypophrynx and esoph- agus but the degree of change at hypopharynx and esophagus is more than two times as large as it is at the caudal uvula (combined obstruction).
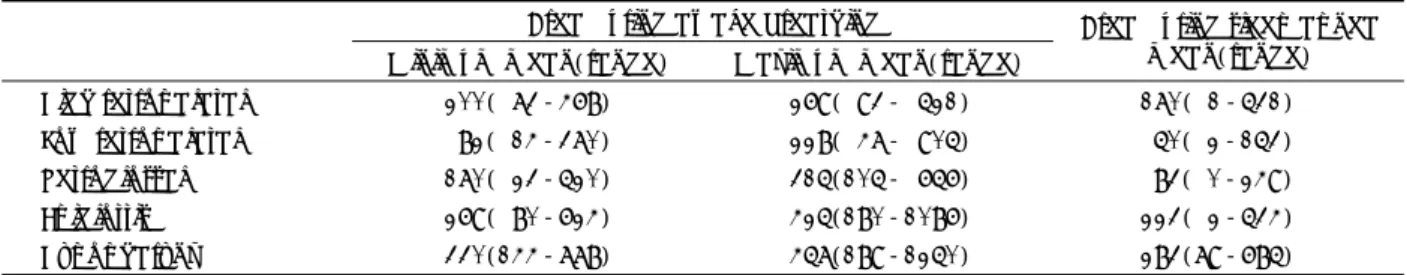
Fig. 3. Three different patterns of airway narrowing determined by cross-sectional CT area measured during awake breathing(A, B, C) and sleep apnea(a, b, c) at five different levels(high retropalatal;1, low retropalatal;2, retroglossal;3, epiglottis;4, hypopharynx;5). A, a:The narrowest airway level was low retropalatal during both awake breathing and sleep apnrea(velopharyngeal obstruction). B, b:The narrowest airway level was low retropalatal during awake breathing but airway obstruction occurred at the retroglossal level during sleep apnea(oro-hypopharyngeal obstruction). C, c:The narrowest airway level was retroglossal during awake breathing but airway obstruction occurred at both low retropalatal and retroglossal levels, and airway size decreased markedly at hypopharynx(combined obstruction).
1 2 3 4 5
A AA A
bb bb a a a a
CCC C B BB B
c cc c
obstruction(CB) if LANCT1 and LANCT2 were simultan- eously present above and below the retro-palatal level(Fig.
3). For the assessment of airway wall motion during res- piration, airway narrowing rate(ANR) and collapsibility index(CI) were calculated at five airway levels as follows:
ANR(%)=〔(Amin-Aa) / Amin〕×100---(1) CI(%)=〔 (Amax-Amin) / Amax〕×100---(2) Amin and Amax are the minimum and maximum areas
(in square millimeters) of the airway at each level mea- sured during awake breathing and Aa is the area during sleep apnea.
LANMAP and LANCT were compared, and the coincident patterns were defined as high-concordant if LANCT was consistent with LANMAP1, low-concordant if LANCT was not consistent with LANMAP1 but with LANMAP2 and dis- cordant if LANCT was not consistent with LANMAP1 or LANMAP2.
RESULTS
Demographic and polysomnographic data are presented in Table 1.
1. Multi-level airway pressure((((MAP)))) monitoring Four of the 11 patients(36%) showed a single pattern of LANMAP throughout the night sleep while the other seven patients(64%) showed a multiple pattern of LANMAP(Ta- ble 2). The most frequent pattern of airway narrowing (LANMAP1) was velopharynx in seven(63.6%), oro-hypo-
Table 2. Pressure changes at different airway levels and the level of airway narrowing determined by continuous multi- level airway pressure monitoring
LAN MAP(%)
Patient No. dPn* dPo* dPh* dPe*
VP OHP CB
1 0±0.22 2± 1.45 13± 5.24 9±3.18 3 71 26
2 0±0.41 13± 3.94 23± 9.23 17±6.18 68 3 29
3 0±0.27 12± 7.21 38±11.0 32±9.64 16 10 74
4 0±0.27 18± 5.82 23± 4.86 24±3.74 92 0 8
5 0±0.64 7± 4.67 17± 9.42 11±5.21 32 40 28
6 20± 3.93 17±4.5 97 0 3
7 2± 1.67 31±9.46 0 100 0
8 12± 5.21 18±4.25 67 24 9
9 5± 3.78 10±5.09 71 14 15
10 10± 3.87 13±3.56 96 0 4
11 39±12.06 19±5.05 80 17 3
*:Values are mean±SD(cmH2O). dPn:amplitude of pressure change at nasopharynx, dPo:at oropharynx, dPh:at hy- popharynx, dPe:at esophagus. LAN MAP indicates the frequency of airway narrowing pattern in each patient determined by multi-level airway pressure monitoring;VP, velopharynx pattern of airway narrowing;OHP, oro-hypopharynx pattern;
CB, combined pattern.
Table 3. Cross-sectional areas of five airway levels measured during awake breathing and sleep apnea period Area during awake breathing
Minimum mean(range) Maximum mean(range)
Area during sleep apnea mean(range) High retropalatal 200( 73-468) 269( 93- 521) 170( 1-531) Low retropalatal 82( 14-370) 228( 47- 905) 50( 2-153) Retroglossal 170( 23-520) 315(105- 656) 83( 0-249) Epiglottis 269( 80-624) 425(180-1086) 223( 2-534) Hypopharynx 330(144-778) 457(189-1250) 283(79-685) All values are cross-sectional area(mm2).
Table 1. Demographic and polysomnographic data of 11 patients with obstructive sleep apnea syndrome
Age(years) 51.6± 8.6
Male sex(%) 9 (81.8)
BMI(kg/m2) 26.3± 2.6
TST(minutes) 310.0±89.9 REM sleep(%TST) 13.6± 7.9
AHI(/hour) 43.5±26.1
Minimum SaO2(%) 79.5±10.2 All values are mean±SD, except for male sex
BMI means body mass index;TST, total sleep time;REM, rapid eye movement;AHI, apnea-hypopnea index;SaO2, arte- rial oxygen saturation
pharynx in three(27.3%) and combined pattern in one patient (9.1%)(Table 5).
2. Cross-sectional areas of airway measured during awake breathing and sleep apnea
The mean cross-sectional area of the low retropalatal level was the smallest not only during awake breathing but also during sleep apnea(Table 3). In individual patients, the na- rrowest airway segment during awake breathing was velo- pharynx in 10(90.9%), and oro-hypopharynx in one subject
(9.1%)(Table 4). Eight of the 11 patients(72.7%) had single airway narrowing pattern(LANCT1 only) and three(27.3%) patients had multiple airway narrowing pattern(LANCT1
and LANCT2). Six patients(66%) showed the narrowest ai- rway level during sleep apnea at velopharynx, three(27.3%) at oro-hypopharynx and two(18.2%) at both velopharynx and oro-hypopharynx. In six of the 11 patients(54.5%), the narrowest airway level during awake breathing was consis- tent with LANCT1. The airway segment with the maximum ANR was usually consistent with LANCT1 except for one
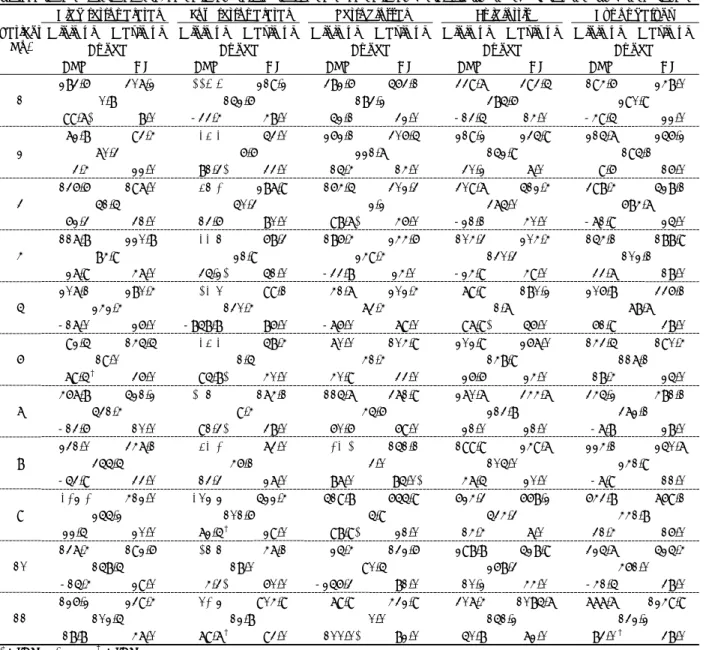
Table 4. The cross-sectional areas of 5 airway levels during awake breathing and sleep apnea, the airway narrowing rate and the airway collapsibility index determined by cine CT scan Table 4. The cross-sectional areas of 5 airway levels during awake breathing and sleep apnea, the airway narrowing rate and the airway collapsibility index determined by cine CT scan
High retropalatal Low retropalatal Retroglossal Epiglottis Hypopharynx Minimum Maximum Minimum Maximum Minimum Maximum Minimum Maximum Minimum Maximum
Apnea Apnea Apnea Apnea Apnea Patient
No.
ANR CI ANR CI ANR CI ANR CI ANR CI 283.6 307.2 114.4 219.2 382.6 563.1 339.7 393.5 194.6 248.0
0.8 152.6 183.2 385.6 290.9 1
99.7* 8.0 -33.4 48.0 52.1 32.0 -13.5 14.0 -49.5 22.0 72.8 93.4 35.3 53.0 262.1 306.5 219.2 235.9 215.7 256.2
70.3 6.6 221.7 152.9 195.1
2
3.4 22.0 81.3* 33.0 15.4 14.0 30.2 7.0 9.6 16.0 136.6 197.0 58.2 287.9 164.5 302.3 309.7 512.4 398.4 528.1
51.5 50.3 2.2 375.0 684.7
3
62.3 31.0 13.6 80.0 98.7* 46.0 -21.1 40.0 -71.9 25.0 117.8 220.8 33.8 68.3 186.4 244.6 104.3 204.4 154.1 188.9
84.9 21.9 249.4 130.3 102.1
4
27.9 47.0 35.2* 51.0 -33.8 24.0 -24.9 49.0 33.7 18.0 207.1 280.4 13.6 99.1 41.7 202.4 79.9 180.2 206.8 336.1
242.4 130.4 73.4 1.7 78.7
5
-17.0 26.0 -858.8 86.0 -76.0 79.0 97.9* 56.0 61.9 38.0 92.5 145.5 35.3 58.4 70.0 104.9 202.9 267.0 143.5 190.4
19.0 1.5 41.4 148.9 117.1
6
79.5† 36.0 95.8* 40.0 40.9 33.0 26.6 24.0 18.4 25.0 467.8 521.2 108.0 174.1 115.7 371.9 270.7 344.7 345.2 481.1
531.4 9.4 45.6 213.8 372.1
7
-13.6 10.0 91.3* 38.0 60.6 69.0 21.0 21.0 -7.8 28.0 231.0 347.1 53.2 73.0 23.1 151.1 199.9 249.7 224.1 250.7
355.5 46.1 3.0 105.0 241.9
8
-53.9 33.0 13.3 27.0 87.0 85.0* 47.5 20.0 -7.9 11.0
329.2 412.0 369.9 522.4 519.8 655.9 624.3 668.2 643.8 769.1
255.2 101.6 5.9 534.3 441.8
9
22.5 20.0 72.5† 29.0 98.9* 21.0 14.4 7.0 31.4 16.0 137.4 192.6 18.8 47.1 25.4 132.6 298.8 528.9 325.7 525.4
158.5 18.0 90.5 268.3 461.0
10
-15.4 29.0 4.3* 60.0 -256.3 81.0 10.2 44.0 -41.5 38.0 126.2 239.4 62.9 904.9 79.9 432.9 307.4 1085.7 777.7 1249.9
102.5 12.8 0.0 151.2 132.2
11
18.8 47.0 79.7† 93.0 100.0* 82.0 50.8 72.0 83.0† 38.0
*;LANCT1, †;LANCT2
Maximum:mean maximal cross-sectional area(mm2) of airway during awake breathing, Minimum:mean minimal cross- sectional area(mm2) of airway during awake breathing, Apnea:cross-sectional area of airway during sleep apnea, ANR(%):
airway narrowing rate, CI(%):collapsibility index of airway, Bold number:the narrowest level of airway during awake brea- thing, Italic bold number:the narrowest level of airway during sleep apnea.
patient(patient No. 10) and the airway segment with the maximum CI was consistent with LANCT in only four of the patients(36.4%)(Table 4).
3. The concordance rate between LAN CT and LAN MAP
The concordance rate of LANCT with LANMAP was det- ermined in each patient. LANCT was high-concordant with LANMAP in five of the patients(45.5%), low-concordant in five(45.5%), and discordant in one(9%)(Table 5).
DISCUSSION
The peculiar finding of this study was that many OSAS patients(64%) showed two or more different patterns of ai- rway obstruction during sleep apneas by continuous multi- level airway pressure monitoring. A similar finding was presented in a previous study(16), and in that study 33%
of the patients showed complex patterns of obstruction. This result had an important clinical implication in that a patient with OSAS may have different levels of airway obstruction during each episode of apnea and this fact may be the cause of unfavorable outcome of surgical treatment for patients with OSAS. To this point, it is important to measure LAN for a prolonged period due to the variability of LAN in OSAS patients.
In the present study, we defined the combined pattern of LANMAP when the airway pressure difference was larger
(more than two times) at the hypopharynx or esophagus than at the oropharynx. The nature of these pressure chan- ges is consistent with the extending pattern of several pre- vious studies(15,17-18) and may be compatible with the propagation of airway obstruction from velopharynx to oro- hypopharynx(a seesaw type of closure) alluded in two studies using pharyngeal cine CT scan(11-12). Although the results of several studies using airway pressure moni- toring to record the obstruction level in patients with OSAS are variable according to the study design, the usual data shows that velopharyngeal obstruction(25-50%) and ext- ending obstruction pattern(25-45%) are more frequent than oro-hypopharygneal obstruction(10-30%)(17-19).
These data are consistent with our results. All the results including our study suggest that velopharynx is an impor- tant obstruction site in OSAS patients and lots of velopha- ryngeal obstructions extend to the distal segment. This ext- ending pattern has been reported to be an important limi- ting factor influencing on the surgical outcome in OSAS patients(12,17). Furthermore, our study showed that most patients with velopharyngeal airway narrowing had oro- hypopharynx narrowing and/or combined narrowing of velo- and oro-hypopharynx during different apneic episodes.
Although the multi-level airway pressure monitoring during sleep was very helpful to identify the location of airway obstruction, there are several limitations in this technique. First, a few patients could not tolerate the in- sertion of catheter through a nasal cavity and pharynx even though lidocaine spray was applied to nasopharnx and oro- pharnx if necessary. Second, there wre infrequent failures of pressure sensor from unknown etiology. Third, the defi- nition of combined obstruction pattern was not verified by other methods because airway pressure monitoring and airway cine CT were not performed simultaneously in this study.
Upper airway CT scan has been considered as a good clinical tool for evaluating OSAS due to its fine anatomical delineation of the airway and is performed with conven- tional(7,8,21-23) or cine CT scan(11,12,24,25). It is well known that a short acquisition time of cine CT gives more information about normal physiology of respiration(26- 28) and pathogenesis of OSAS(11,12,24,25). Two previous studies(7,8) showed multiple level airway narrowing during waking CT scan(30-45%) and it is similar with our result during sleep(27.3%). In spite of the different methodolo- gies, several studies(7,8,21,22,25) performed during wak-
Table 5. The concordance of airway narrowing patterns bet- ween LANMAP and LANCT
LANMAP
Patient
No. LANMAP1 LANMAP2 LANCT Coincident pattern 1 OHP CB, VP VP Low-concordant 2 VP CB, OHP VP High-concordant 3 CB VP, OHP OHP Low-concordant 4 VP CB VP High-concordant 5 OHP VP, CB OHP High-concordant 6 VP CB VP High-concordant
7 OHP VP Discordant
8 VP OHP, CB OHP Low-concordant 9 VP CB, OHP CB Low-concordant 10 VP CB VP High-concordant 11 VP OHP, CB CB Low-concordant LANMAP1 indicates the most common pattern of airway narro- wing measured by multilevel airway pressure monitoring during sleep apnea;LANMAP2, the other patterns of airway narrowing except for LANMAP1;LANCT, level of airway narro- wing determined by CT cross-sectional area;VP, velopharynx level;OHP, oro-hypopharynx level;CB, combined veloph- arynx and oro-hypopharynx.
ing period showed that retropalatal and retroglossal levels are important narrowing points in OSAS patients and this finding is consistent with our result. The narrowest airway site during waking period does not always indicate where the airway obstruction occurs during sleep apnea. Our study showed that the narrowest segment of airway during wake- fulness was concordant to the real obstruction level during sleep apnea in only 54.5% of patients. Airway collapsibility index during waking period also was not a good predictor of airway obstruction during sleep apnea. In only four pati- ents(36.4%), the airway levels of maximum collapsibility index were consistent with the true obstruction site during sleep apnea. However, the ANR is well correlated with the obstruction level(91%). These observations emphasize a further limitation of waking pharyngeal CT study without consideration of airway state during sleep.
Two studies(11,12) performed during asleep period rep- orted that all patients had obstruction at the retropalatal or retroglossal level and about 50% of them showed extension of obstruction to oro-hypopharynx(seesaw pattern). How- ever, our study did not show such extending pattern due to the difference of the study design. These studies scanned the airway several times during one apnea while we per- formed CT scan only once during an apneic episode. The serial changes of the upper airway during apnea were not demonstrated in our study.
LANCT was high-concordant with LANMAP in only five of the patients(45.5%), and low-concordant or discordant in the other six patients(54.5%). Because most patients with OSAS showed multiple patterns of airway narrowing during sleep apnea by MAP monitoring, examining only one episode of apnea-hypopnea by CT scan may not reflect the most frequent pattern of airway narrowing and cannot represent various patterns of airway narrowing during sleep apnea in each patient.
OSAS is a very dynamic and complex disorder. In ad- dition, the level of airway narrowing shows temporal fluc- tuation in the same patient. This may result in serious diag- nostic error if LAN is solely assessed by CT scan. The usage of multi-level airway pressure monitoring may play a crucial role in determining LAN more accurately in pa- tients with OSAS. Furthermore, according to MAP moni- toring, 64% of patients with OSAS showed two or more different patterns of airway narrowing during different episodes of sleep apnea in each patient. This finding em- phasizes once again that nasal CPAP should be tried before
a surgery is considered in patients with OSAS.
Acknowledgements
The authors thank Dr. Hansuk Koh(Department of Neu- rology, Temple University Hospital, Philadelphia) and Meen Jong Lee for the English correction of the manuscript, Mr.
Woo Suk Tae for the measurement of airway sizes of pa- tients and Mr. Kibong Kim and Minsung Kim for the tec- hnical assistance.
REFERENCES
1. Phillipson EA. Sleep disorders. In: Murray JF, Naedel JA, eds. Text- book of respiratory medicine. Vol.2. Philadelphia: W.B. Saunders;
1988. p.1841-1860
2. Guilleminualt C. Clinical features and evaluation of obstructive sleep apnea. In: Kryger MH, Roth T, Dement WC, eds. Principles and practice of sleep medicine. Philadelphia: W.B. Saunders;1994:
667-677
3. Shepard JW Jr, Gefter WB, Guilleminault C, Hoffman EA, Hoff- stein V, Hudgel DW, Suratt PM, White DP. Evaluation of the upper airway in patients with obstructive sleep apnea. Sleep 1991;14(4):
361-371
4. Fleetham JA. Upper airway imaging in relation to obstructive sleep apnea. Clin Chest Med 1992;13(3):399-416
5. Schwab RJ. Upper airway imaging. Clin Chest Med 1998;19(1):
33-54
6. Schwab RJ, Goldberg AN. Upper airway assessment: radiographic and other imaging techniques. Otolaryngol Clin North Am 1998;
31(6):931-968
7. Haponik EF, Smith PL, Bohlman ME, Allen RP, Goldman SM, Ble- ecker ER. Computerized tomography in obstructive sleep apnea:
correlation of airway size with physiology during sleep and wake- fulness. Am Rev Respir Dis 1983;127:221-226
8. Bohlman ME, Haponik EF, Smith PL, Allen RP, Bleecker ER, Gold- man SM. CT demonstration of pharyngeal narrowing in adult obstr- uctive sleep apnea. AJR 1983;140:543-548
9. Stauffer JL, Zwillich CW, Cadieux RJ, et al. Pharyngeal size and re- sistance in obstructive sleep apnea. Am Rev Respir Dis 1987;136:
623-627
10. Avrahami E, Englender M. Relation between CT axial cross-sec- tional area of the oropharynx and obstructive sleep apnea syndrome in adults. AJNR 1995;16:135-140
11. Crumley RL, Stein M, Golden J, Gamsu G, Dermon S. Determining of obstructive site in obstructive sleep apnea. Laryngoscope 1987;
97:301-308
12. Stein MG, Gamsu G, de Geer G, Golden JA, Crumley RL, Webb WR.
Cine CT in obstructive sleep apnea. AJR 1987;148:1069-1074 13. Hudgel DW. Variable site of airway narrowing among obstructive
sleep apnea patients. J Appl Physiol 1986;61:1403-1409
14. Chaban R, Cole P, Hoffstein V. Site of upper airway obstruction in patients with idiopathic obstructive sleep apnea. Laryngoscope 1988;
98:641-647
15. Shepard JW Jr., Thawley SE. Localization of upper airway collapse during sleep in patients with obstructive sleep apnea. Am Rev Res- pir Dis 1990;141:1350-1355
16. Skatvedt O. Continuous pressure measurements in the pharynx and esophagus during sleep in patients with obstructive sleep apnea synd- rome. Laryngscope 1992;102:1275-1280
17. Woodson BT, Wooten MR. A multisensor solidstate pressure mano- meter to identify the level of collapse in obstructive sleep apnea.
Otolaryngol Head Neck Surg 1992;107:651-656
18. Katsantonis G, Moss K, Miyazaki S, Walsh J. Determining the site of airway collapse in obstructive sleep apnea with airway pressure mo- nitoring. Laryngoscope 1993;103:1126-1131
19. Skatvedt O. Continuous pressure measurements during sleep to lo- calize obstructions in the upper airways in heavy snorers and patients with obstructive sleep apnea syndrome. Eur Arch Otorhinolaryngol 1995;252:11-14
20. Rechtschaffen A, Kales A. A manual of standardized terminology, techniques, and scoring system for sleep stages of human subjects.
Washington, DC: US Governmental Printing Office;1968 21. Shepard JW Jr., Thawley SE. Evaluation of the upper airway by
computerized tomography in patients with undergoing uvulopalato- pharyngoplasty for obstructive sleep apnea. Am Rev Respir Dis 1989;140:711-716
22. Polo O, Tafti M, Fraga J, Billiard M. Pharyngeal CT studies in pa- tients with mild or severe upper airway obstruction during sleep.
Sleep 1993;16:S152-S155
23. Caballero P, Alvarez-Sala R, Garcia-Rio F, Prados C, Hernan MA, Vill-
amor J, Alvarez-Sala JL. CT in the evaluation of the upper airway in healthy subjects and in patients with obstructive sleep apnea syndrome.
Chest 1998;113(1):111-116
24. Galvin JR, Rooholamini SA, Stabford W. Obstructive sleep apnea:
diagnosis with ultrafast CT. Head Neck Radiol 1989;171:775-778 25. Schwab RJ, Gefter WB, Hoffman EA, Gupta KB, Pack AI. Dynamic
upper airway imaging during awake respiration in normal subjects and patients with sleep disordered breathing. Am Rev Respir Dis 1993;148:1385-1400
26. Burger CD, Stanson AW, Sheedy PF II, Daniels BK, Shepard JW Jr.
Fastcomputed tomography evaluation of age-related changes in upper airway structure and function in normal man. Am Rev Respir Dis 1992;145:846-852
27. Burger CD, Stanson AW, Daniels BK, Sheedy PF II, Shepard JW Jr.
Fast-CT evaluation of the effect of lung volume on upper airway size and function in normal men. Am Rev Respir Dis 1992;146:
35-339
28. Burger CD, Stanson AW, Daniels BK, Sheedy PF II, Shepard JW Jr. Fast-computed tomographic evaluation of the effect of route of breathing on upper airway size and function in normal men. Chest 1993;103:1032-1037
수면무호흡 중에 관찰된 다양한 기도협착의 형태:상기도 CT 및 상기도 압력 측정법
정승철·홍승봉·경승현·김후원
목적 및 방법:수면무호흡증 환자들에서 상기도 압력 측정법을 이용하여 수면 중 기도협착의 형태를 연구하고, 각성시와 수
면 중에 실시한 상기도 CT scan의 수면무호흡 중 기도 협착 부위의 예측도를 평가하기 위하여, 11명의 수면무호흡증 환자에서 4 압력 센서 또는 2 압력 센서가 달린 도관을 상기도로 삽입하여 상기도의 압력을 측정하면서 수면다원검사를 시행하고, 이 환 자들에서 각성시와 수면 중에 상기도의 다섯 곳(high-retropalatal, low-retropalatal, retroglossal, hypopharynx, eso- phagus)에서 cine CT를 시행한 후 각 방법에 의하여 기도 협착 부위를 진단하고, 수면 중 상기도 압력 측정 결과에 의거하여 상기도 cine CT의 정확도를 평가하였다.
결 과:상기도 압력 측정 결과 4명(36%)만이 수면 중에 단일 형태의 기도 협착을 보였고, 나머지 7명(64%)은 여러 가지 형태의 기도 협착을 보였다. Velopharynx가 수면무호흡시에 가장 흔히 관찰되는 기도 협착 부위였다(63.6%). 그러나, 상기도 cine CT결과는 수면무호흡 중에 8명이 단일 형태의 기도 협착을 보였다(72.7%). Apneic CT에서도 Velopharynx가 가장 흔한 기도 협착 부위였다. 상기도 압력 측정법과 상기도 CT 촬영법 사이의 기도 협착 진단의 일치율은 단 5명에서만 잘 일치하 였고(high-concordant), 5명은 잘 일치하지 않았으며(low-concordant), 나머지 1명은 전혀 일치하지 않았다.
결 론:대부분의 수면무호흡증 환자는 수면 중 여러 번 발생하는 수면무호흡에서 2가지 또는 그 이상의 기도 협착 형태를 보이므로, 단 1회의 수면무호흡의 상태만을 반영하는 상기도 CT는 수면무호흡의 기도 협착 부위를 적절히 반영하지 못한다고 생각된다.
중심 단어:폐쇄성 수면무호흡증・상기도 압력 측정법・상기도 CT・수면 중 기도협착의 형태.
초 록