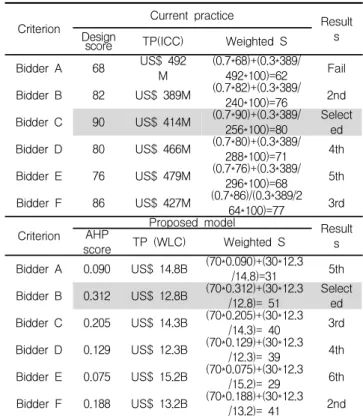
Whole Life Performance Bid Evaluation in the Korean Public Sector
19
0
0
전체 글
(2)
(3)
(4)
(5)
(6)
(7)
(8)
(9)
(10)
(11)
(12)
(13)
(14)
(15)
(16)
(17)
(18)
(19)
수치
+2
관련 문서
• 이명의 치료에 대한 매커니즘과 디지털 음향 기술에 대한 상업적으로의 급속한 발전으로 인해 치료 옵션은 증가했 지만, 선택 가이드 라인은 거의 없음.. •
The Dutch physicist Pieter Zeeman showed the spectral lines emitted by atoms in a magnetic field split into multiple energy levels... With no magnetic field to align them,
Modern Physics for Scientists and Engineers International Edition,
그리고 인터넷을 통해 이 세상의 PC나 휴대폰이 모두 연결 될 수 있으므로, 제3단계부터 본격적으로 사이버 스페이스로
The index is calculated with the latest 5-year auction data of 400 selected Classic, Modern, and Contemporary Chinese painting artists from major auction houses..
The Public Authority for Manpower (PAM) has linked the disbursement of additional financial support for the national personnel in the private sector with their
PI protection technologies necessary in the public environment in Korea were examined from multiple viewpoints with reference to related research. A table of the PI
The Joseon government designed and promulgated the Taegeukgi as a national flag for diplomatic and political purposes, but it was the independence movement that made it
