Introduction
Oral squamous cell carcinoma (OSCC) is the most common cancer of the oral and maxillofacial region, with more than 300,000 new cases reported annually worldwide. Based on currently available clinical assessment and treatment methods, patients are often diagnosed at a late stage of the disease and
the 5-year survival rate has remained relatively low (50–0%) (Schliephake, 2003).
Surgical treatment for oral cancer can cause functional and aesthetic impairment, leading to withdrawal and social isolation (Hopper et al., 2004). Complications of radiotherapy can impair wound healing and further complicate surgical salvage after a failed procedure (Bodin et al., 2004). Conventional chemotherapeutic agents have been associated with numerous significant clinical complications, including nausea, hair loss, and pancytopenia; thus, alternative and less toxic chemical treatments for oral cancer are required (Yamachika et al., 2004).
Th e main risk factor for oral cancer is exposure to exogenous carcinogens such as tobacco smoke and alcohol. Annually, it is estimated that 127,459 deaths are caused from oral cavity
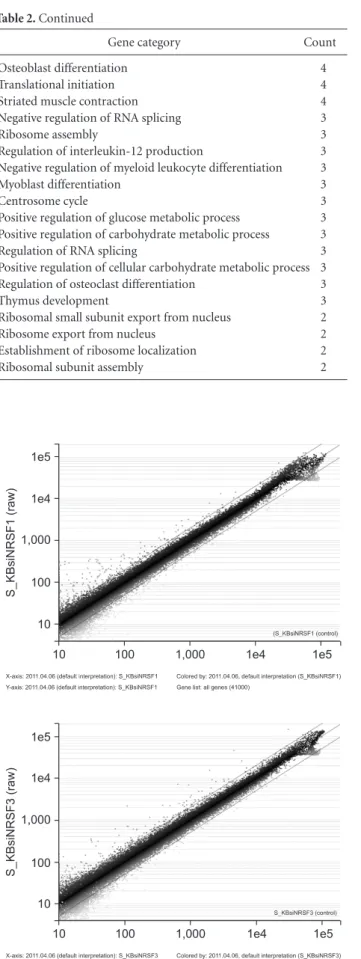
Microarray analysis in KB human oral cancer cells treated with neuron restrictive silencer factor siRNA
Woo-Jin Jun 1,† , Eugene Cho 2,† , Myung Mi Kim 2 , Mi Suk Choi 2 , Joong-Ki Kook 2 , Su-Gwan Kim 1 , Do-Kyung Kim 3 , Heung-Joong Kim 4 , Young-Ju Cha 5 , Sung Kyu Lee 1 , Chun Sung Kim 2, *
Departments of
1Oral and Maxillofacial Surgery,
2Oral Biochemistry,
3Oral Physiology, and
4Oral Anatomy, School of Dentistry, Chosun University, Gwangju,
5Coff ee & Wine Barista, Koguryoe College, Naju, Korea
ABSTRACT
Strong expression of neuron restrictive silencer factor (NRSF) has been observed in many aggressive types of cancer cells and mature neurons. However, the function of the neuron restrictive silencer element (NRSE)/NRSF system in KB human oral cancer cells is unknown. Findings from previous studies in our lab have demonstrated the importance of NRSF as a factor in regulationof cell proliferation of KB human oral cancer cells. Treatment of KB cells with NRSF siRNA resulted in signifi cant inhibitionof cell growth through repression of NRSF expression. In this study, in order to understand the NRSE/NRSF regulatory network in KB cells, we performed microarray analysis in KB cells treated with NRSF specifi c targeted siRNA. The expression profi les of several genes were further validated in KB cells treated with NRSF siRNA. Results of microarray analysis showed up- regulation of 117 genes and down-regulation of 215 genes in KB cells treated with NRSF siRNA. Most of the up-regulated genes were involved in signal transduction, cell communication, cell cycle, and apoptosis;down-regulated genes were involved in RNA processing, neurogenesis, transcription factor activity, and synaptogenesis. NRSF is known as a transcriptional repressor for silencingof neuronal genes; however, according to our data, treatment of KB cells with NRSF siRNAresulted in down-regulation of more than 200 genes. As a result, genes identifi ed in this screen represent a novel control pathway via NRSF expression in KB oral cancer cells. Further investigation will be needed in order to defi ne the mechanism of gene regulation by expression of NRSF in KB human oral cancer cells.
Key Words: Neuron restrictive silencer factor, Cancer cells, Microarray analysis, Transcription factors, KB human oral cancer
Received Feb 1, 2012; Revised version received Feb 10, 2012 Accepted Feb 15, 2012
Corresponding author: Chun Sung Kim
Department of Oral Biochemistry, School of Dentistry, Chosun University, 375 Seosuk-dong, Dong-gu, Gwangju 501-759, Korea Tel: 82-62-230-7088, Fax: 82-62-224-3706
E-mail: [email protected]
†