ABSTRACT
BACKGROUND/OBJECTIVES: Concerns about regional disparities in heathy eating and nutritional status among South Korean adults are increasing. This study aims to identify the magnitude of regional disparities in diet and nutritional status among Korean adults who completed the 2017 Korea National Health and Nutrition Examination Survey (KNHANES).
SUBJECTS/METHODS: The participants were a nationally representative sample of Korean adults aged 19 years and older from the 2017 KNHANES (n = 6,126). We employed the svy commands in STATA to accommodate the complex survey design. The relative concentration index (RCI), absolute concentration index (ACI) and index of disparity were used to measure regional nutritional inequalities.
RESULTS: Overweight and obese adults were more prevalent among the poor than among the rich in urban areas (RCI = −0.041; P < 0.05), while overweight and obese adults were more prevalent among the rich than among the poor in rural areas of South Korea (RCI = 0.084;
P < 0.05). Economic inequality in fruit and vegetable intake ≥ 500 g per day was greater in rural areas than in urban areas in both relative size (RCI = 0.228 vs. 0.091, difference in equality = 0.137; P < 0.05) and absolute size (ACI = 0.055 vs. 0.023, difference in equality = 0.032; P < 0.05).
CONCLUSIONS: This study provides useful information identifying opposite directions in the relative concentration curves between urban and rural areas. Adult overweight/obesity was more prevalent among the poor in urban areas, while adult overweight/obesity was more prevalent among the rich in rural areas. Public health nutrition systems should be implemented to identify nutritional inequalities that should be targeted across regions in South Korea.
Keywords: Healthy eating; nutrition; inequalities; overweight; obesity; South Korea
INTRODUCTION
Health and nutrition inequalities are unjust and avoidable dissimilarities in diseases and nutritional status on the basis of socioeconomic and demographic factors [1]. Although health inequalities have received significant worldwide research attention since the 1980s [2], remarkable differences in health across and inside countries are presently noticeable [3]. Sen argued that health is one of the most critical elements in people's lives and a very significant component of individual capabilities [4].
Original Research
Received: Aug 18, 2020 Revised: Aug 25, 2020 Accepted: Sep 14, 2020
§
Corresponding Author:
Jaesin Sa
College of Education and Health Sciences, Touro University, 1310 Club Dr, Vallejo, CA 94592, USA.
Tel. +1-707-638-5214 Fax. +1-707-638-5871 E-mail. [email protected]
©2020 The Korean Nutrition Society and the Korean Society of Community Nutrition This is an Open Access article distributed under the terms of the Creative Commons Attribution Non-Commercial License (https://
creativecommons.org/licenses/by-nc/4.0/) which permits unrestricted non-commercial use, distribution, and reproduction in any medium, provided the original work is properly cited.
ORCID iDs Jounghee Lee
https://orcid.org/0000-0001-8240-7602 Jaesin Sa
https://orcid.org/0000-0002-2850-7239 Funding
Korea Centers for Disease Control and Prevention supported this research for investigating and reducing regional health disparities.
Conflict of Interest
The authors declare no potential conflicts of interests.
Jounghee Lee 1 and Jaesin Sa 2§
1
Department of Food and Nutrition, Kunsan National University, Gunsan 54150, Korea
2
College of Education and Health Sciences, Touro University, Vallejo, CA 94592, USA
Regional disparities in healthy eating and nutritional status in South Korea:
Korea National Health and Nutrition
Examination Survey 2017
Author Contributions
Conceptualization: Lee J, Sa J; Formal analysis: Lee J; Investigation: Lee J, Sa J;
Methodology: Lee J; Supervision: Lee J, Sa J;
Writing - original draft: Lee J; Writing -review &
editing: Lee J, Sa J.
Several researchers have examined socioeconomic disparities in types of health screening services, use of health care, health behaviors (e.g., physical activity), and food insecurity in South Korea (hereafter Korea) [5-8]. Kim et al. [6] reported that food insecurity was more prevalent in elderly households and households with low socioeconomic status (SES) than in households with high SES. University students with low incomes were more likely to have school-provided health screening services and less likely to have private-sector health screening services [7]. Socioeconomically disadvantaged people have a significantly low level of physical adherence to health practices among patients with metabolic syndrome [8]. Prior research reported disparities in the employment of preventive health services (i.e., influenza vaccination, regular medical checkup, and four kinds of cancer screenings) by employment status using a national dataset [5]. Permanent employees were more likely to utilize preventive health services in Korea than temporary workers, the self-employed, and unpaid family workers [5].
To describe health and nutrition inequalities, researchers have employed the concentration index as a useful method [9]. The index has been used to examine health and nutrition inequalities in areas such as cancer screening services and weight status [10,11]. In
investigating health and nutritional inequalities, the concentration index has several merits.
First, it enables researchers to examine the degree of health or nutrition inequality across SES. Second, it reveals the distribution of diseases or nutritional problems in the national population compared to a simple assessment to examine the differences between a limited number of groups (e.g., the poorest group vs. the richest group). Third, this concentration index can sensitively reveal changes in disease or nutritional status as the economic status of participants changes in the total population.
In 2015, the Ministry of Health and Welfare and Korean Health Promotion set up the National Health Plan 2020 in Korea [12]. The Health Plan 2020 consisted of 6 sections:
1) healthy lifestyle, 2) chronic disease management, 3) infectious disease management, 4) safe environment, 5) population health care, and 6) system management [13]. The National Health Plan 2020 envisions people creating a healthy community and enjoying it by expanding their healthy life expectancy and attaining health equity [14]. One of the National Health Plan is to decrease nutrition inequalities among Koreans.
Government policy and intervention programs that improve dietary practices for vulnerable groups (e.g., low-SES groups) and regions can reduce unfair differences in nutritional status and dietary behaviors. The specific aim of this study was to explore nutrition inequalities by region in Korea using a nationally representative cross-sectional survey of Koreans. First, we evaluated regional disparities across eight cities and nine provinces using the index of disparity (ID). Second, we examined differences in nutrition and dietary practices by using concentration indices. Third, we analyzed urban-rural differences in nutrition and dietary practices.
SUBJECTS AND METHODS
Dataset
We employed a nationally representative dataset from the Korea National Health and Nutrition
Examination Survey (KNHANES) collected by the Korea Centers for Disease Control and
Prevention (KCDC) in 2017. The KNHANES is a nationally representative cross-sectional health
and nutrition survey. All subjects participated voluntarily and provided informed consent for
data collection. We accessed this publicly available dataset without personal identifiers from the
KCDC website. The KNHANES used a complex survey design with multistage stratified cluster sampling. Primary sampling units (PSUs) were selected from 192 geographically predefined PSUs for the entire nation [15,16]. A PSU was composed of 60 households on average, and 20 target households were finally sampled with the use of systematic sampling. In the chosen households, the KCDC collected information on individuals aged 1 year or over. Sample weights were created for participants to represent the total Korean population, taking into account the complex survey design, nonresponse, and poststratification (i.e., sex- and age-specific Korean populations) [15]. Use of this secondary dataset in this research was approved by the institutional review board of Kunsan National University, Korea (1040117-202007-HR-013-01).
Subjects
A total of 8,127 participants completed the KNHANES in 2017. Our exclusion criteria were aged
< 19 years and pregnant participants. Subjects (n = 24) who did not provide anthropometric data were excluded. These exclusion procedures reduced the final sample size to 6,126.
Demographic characteristics
For the demographic characteristics of participants, we included gender, age, number of household members, and residential area (e.g., province or city). Korea was divided into 9 provinces and 8 special/metropolitan cities. The 9 provinces were 1) Gyeonggi, 2) South Jeolla, 3) North Jeolla, 4) South Gyeongsang, 5) North Gyeongsang, 6) South Chungcheong, 7) North Chungcheong, 8) Gangwon, and 9) Jeju Province. Additionally, the 8 special/metropolitan cities were 1) Seoul, 2) Busan, 3) Gwangju, 4) Incheon, 5) Daegu, 6) Daejeon, 7) Ulsan, and 8) Sejong city. Place of residence was classified into 2 groups: urban and rural.
Household income level
Participants provided their income from all sources, including wages, incomes from
immovable property, pensions, interest, government subsidies, and allowances from relatives or children, on a monthly or yearly basis. Total household income was divided by the number of household members.
Nutritional status
To calculate the body mass index (BMI) of the participants, we divided each individual's weight in kilograms by his or her height in meters squared (kg/m
2). According to the World Health Organization criteria for Asians, we categorized the BMI of participants into 4 groups:
1) underweight (BMI < 18.5), 2) normal weight (18.5 ≤ BMI < 23.0), 3) overweight (23.0 ≤ BMI
< 25.0), and 4) obese (BMI ≥ 25.0) [17].
Healthy eating practices
The criterion for healthy eating practices is to follow at least 2 healthy eating practices out of 4: 1) fat consumption, 2) sodium intake, 3) fruit and vegetable intake, and 4) the use of nutrition labeling [12]. A one-day 24-hour recall survey was conducted by trained dietitians.
This dietary survey included information on meal type, meal place, meal time, dish name, food name, and amount of food intake. To estimate the daily intake of energy and nutrients, we used the Korean Foods and Nutrients database developed by the Rural Development Administration [18-21].
Fat consumption
Fat intake was calculated as the percentage contributed to total energy intake. The Korean
Nutrition Society set the acceptable macronutrient distribution ranges for fat in Korean
Dietary Reference Intakes 2015 [22]. The recommended energy contribution of dietary fat to total energy is 15–30% for subjects 6 to 19 years old and 15–20% for subjects ≥ 20 years.
Sodium intake
The Korean Nutrition Society set a tolerable upper intake level of 2,000 mg for sodium [22].
If the participants' daily sodium intake was ≤ 2,000 mg, they were coded as 1.
Fruit and vegetable intake
Foods consumed by the participants were categorized into 18 food groups: 1) cereals and cereal products, 2) potatoes and starches, 3) sugars and sugar products, 4) beans and bean products, 5) seeds and seed products, 6) vegetables, 7) mushrooms, 8) fruits, 9) meat and meat products, 10) eggs, 11) fish and shellfish, 12) seaweeds, 13) milk and dairy products, 14) oils and fats, 15) beverages and alcohols, 16) seasonings, 17) ready-to-eat processed foods, and 18) others. To calculate the amount of fruit and vegetable intake, we first selected 4 food groups: 1) vegetables, 2) mushrooms, 3) fruits, and 4) seaweeds. Then, we added the amount of intake from all 4 groups. We converted the amount of dried foods based on raw foods.
If the participants' daily intake of fruits, vegetables, mushrooms, and seaweeds was ≥ 500 g, they were considered healthy eaters in terms of the recommended intake of fruits and vegetables; those who did not meet this criterion were considered nonhealthy eaters.
Nutrition labeling
The KNHANES dichotomous nutrition label-related question “Do you know about nutrition labeling?” was asked of participants to which a “yes” or “no” response was given. The next question was “When you choose or purchase processed foods, do you use nutrition labeling?”
(0 = no and 1 = yes).
Measure of nutritional disparities Index of disparity (ID)
The ID showed relative disparities among groups by calculating the average deviation of the occurrence of the nutritional status divided by the reference group with the lowest occurrence (Equation 1) [23].
(Equation 1)
r
i= the measure of health status in the ith group r
ref= the health status indicator in the reference group J = the number of groups
Absolute and relative percentage differences
To assess the nutritional disparity between the 2 groups (i.e., urban vs. rural), we employed absolute and relative percentage differences.
Relative concentration index (RCI)
The RCI indicated the relative degree of nutritional inequality by individual economic levels.
We defined RCI as twice the area between the 45-degree line of equality and the relative concentration curve (RCC) (Equation 2) [24]. To create a graph of RCC, we plotted the accumulative occurrence proportion of the nutritional status (y-axis) against the accumulated proportion of the participants ranked by economic status from lowest to highest.
𝐼𝐼𝐼𝐼𝐼𝐼𝐼𝐼 = (��𝑟𝑟𝑟𝑟 𝑖𝑖𝑖𝑖 − 𝑟𝑟𝑟𝑟 𝑟𝑟𝑟𝑟𝑟𝑟𝑟𝑟𝑟𝑟𝑟𝑟 �/𝐽𝐽𝐽𝐽)/𝑟𝑟𝑟𝑟 𝑟𝑟𝑟𝑟𝑟𝑟𝑟𝑟𝑟𝑟𝑟𝑟 × 100
𝑗𝑗𝑗𝑗−1
𝑖𝑖𝑖𝑖=1
Absolute concentration index (ACI)
The ACI provided the absolute level of nutritional inequality by economic level. To measure the ACI, we multiplied the RCI by the total mean proportion (Equation 2) [25].
(Equation 2) ACI = μ∙RCI = 2cov(x,r)
N = total number of individuals in the population
𝜇𝜇𝜇𝜇 = � 1 𝑁𝑁𝑁𝑁 � � 𝑥𝑥𝑥𝑥
𝑖𝑖𝑖𝑖𝑛𝑛𝑛𝑛
𝑖𝑖𝑖𝑖=1
= the mean level of nutrition status in the population
x
i= the weighted average level of nutrition status in the ith economic group r
i= the relative rank of the ith economic group
L(x) = concentration curve Statistical analysis
We performed data management using SPSS version 25 (SPSS, Inc., Chicago, IL, USA). We conducted data analysis with the use of Intercooled STATA version 14 (StataCorp, College Station, TX, USA). For all statistical analyses, we employed the svy commands in STATA, taking into account the complex survey design. The delta method was used to compute a standard error for both RCI and ACI with adjustment of within-cluster correlation (Equation 3) [24]. Additionally, we used the conindex commands in STATA to compare inequality indices across groups [26].
(Equation 3) 𝜎𝜎𝜎𝜎 𝑟𝑟𝑟𝑟 2 = the variance in the fractional rank
x
i= the weighted average level of nutrition status in the ith economic group
𝜇𝜇𝜇𝜇 = � 1 𝑁𝑁𝑁𝑁 � � 𝑥𝑥𝑥𝑥
𝑖𝑖𝑖𝑖𝑛𝑛𝑛𝑛
𝑖𝑖𝑖𝑖=1
= the mean level of nutrition status in the population
β
1= an estimate of the concentration index r
i= the relative rank of the ith economic group
RESULTS
Index of disparity (ID)
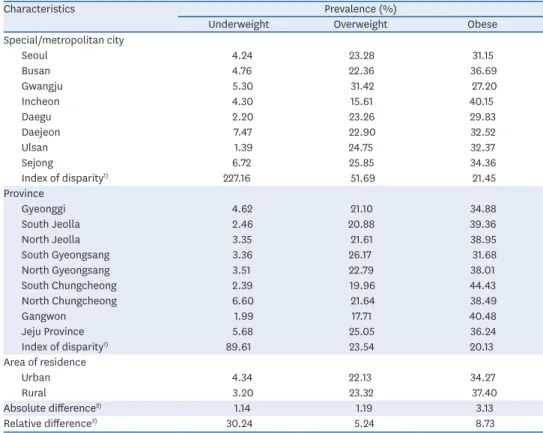
Among special and metropolitan cities, the ID was 51.69 for overweight adults and 21.45 for obese adults (Table 1). Among provinces, the ID was 23.54 for overweight adults and 20.13 for obese adults. These disparity indices showed that the magnitude of regional disparities in obese adults was similar between cities (ID = 21.45) and provinces (ID = 20.13). However, the magnitude of regional disparities in overweight adults was much greater in cities (ID = 51.69) than in provinces (ID = 23.54).
Prevalence of overweight and obese adults
The prevalence of overweight and obesity among participants was not significantly different between rural and urban areas (60.8% vs. 56.4%; P > 0.05) (Table 2). Nonsignificant results were also found for the prevalence of overweight and obese adults across income quintile groups (P > 0.05).
𝑅𝑅𝑅𝑅𝑅𝑅𝑅𝑅𝑅𝑅𝑅𝑅 = 2
𝑁𝑁𝑁𝑁 ∙ 𝜇𝜇𝜇𝜇 � 𝑥𝑥𝑥𝑥 𝑖𝑖𝑖𝑖 𝑟𝑟𝑟𝑟 𝑖𝑖𝑖𝑖 𝑛𝑛𝑛𝑛
𝑖𝑖𝑖𝑖=1 − 1 = 1 − 2 � 𝐿𝐿𝐿𝐿(𝑥𝑥𝑥𝑥)𝑑𝑑𝑑𝑑𝑥𝑥𝑥𝑥 1
0
𝑅𝑅𝑅𝑅𝑅𝑅𝑅𝑅𝑅𝑅𝑅𝑅 ∶ 2𝜎𝜎𝜎𝜎 𝑟𝑟𝑟𝑟 2 � 𝑥𝑥𝑥𝑥 𝑖𝑖𝑖𝑖
𝜇𝜇𝜇𝜇 � = 𝛽𝛽𝛽𝛽 0 + 𝛽𝛽𝛽𝛽 1 𝑟𝑟𝑟𝑟 𝑖𝑖𝑖𝑖 + 𝜀𝜀𝜀𝜀 𝑖𝑖𝑖𝑖
𝐴𝐴𝐴𝐴𝐴𝐴𝐴𝐴𝐴𝐴𝐴𝐴 ∶ 2𝜎𝜎𝜎𝜎 𝑟𝑟𝑟𝑟 2 (𝑥𝑥𝑥𝑥 𝑖𝑖𝑖𝑖 ) = 𝛽𝛽𝛽𝛽 0 + 𝛽𝛽𝛽𝛽 1 𝑟𝑟𝑟𝑟 𝑖𝑖𝑖𝑖 + 𝜀𝜀𝜀𝜀 𝑖𝑖𝑖𝑖
Prevalence of healthy eating
We found that the proportion of adults with daily fruit and vegetable intake ≥ 500 g did not differ significantly between urban and rural areas (45.9% vs. 41.2%; P > 0.05) but differed significantly across income quintile groups, showing a higher prevalence in the higher- income groups (P < 0.001) (Table 2). However, the prevalence of adults with sodium intake ≤ 2,000 mg was significantly higher in the lower-income groups (P < 0.001).
Table 1. Underweight, overweight, and obese adults across regions and summary of measures of nutritional disparities (KNHANES, 2017)
Characteristics Prevalence (%)
Underweight Overweight Obese
Special/metropolitan city
Seoul 4.24 23.28 31.15
Busan 4.76 22.36 36.69
Gwangju 5.30 31.42 27.20
Incheon 4.30 15.61 40.15
Daegu 2.20 23.26 29.83
Daejeon 7.47 22.90 32.52
Ulsan 1.39 24.75 32.37
Sejong 6.72 25.85 34.36
Index of disparity
1)227.16 51.69 21.45
Province
Gyeonggi 4.62 21.10 34.88
South Jeolla 2.46 20.88 39.36
North Jeolla 3.35 21.61 38.95
South Gyeongsang 3.36 26.17 31.68
North Gyeongsang 3.51 22.79 38.01
South Chungcheong 2.39 19.96 44.43
North Chungcheong 6.60 21.64 38.49
Gangwon 1.99 17.71 40.48
Jeju Province 5.68 25.05 36.24
Index of disparity
1)89.61 23.54 20.13
Area of residence
Urban 4.34 22.13 34.27
Rural 3.20 23.32 37.40
Absolute difference
2)1.14 1.19 3.13
Relative difference
3)30.24 5.24 8.73
Unweighted data: n = 6,150; weighted data: n = 41,875,841.
1)
The index of disparity was estimated by taking the mean difference between each group rate and the best group rate and summing up the mean difference as a proportion of the best group rate;
2)Absolute difference was estimated by subtracting the best group rate from the other group rate;
3)Relative difference was estimated between the 2 groups by dividing the absolute % difference by the average % and multiplying by 100.
Table 2. Prevalence of overweight and obese adults and healthy eating practices between urban and rural areas (n = 6,126)
Characteristics Prevalence (%) Significance
(P-value) Prevalence (%) Significance
(P-value)
Total Urban Rural Total household income per capita
Quintile 1 Quintile 2 Quintile 3 Quintile 4 Quintile 5
Overweight/obese adults 57.1 56.4 60.8 NS 57.7 59.6 56.4 55.7 56.0 NS
Fruit and vegetable intake
≥ 500 g 45.2 45.9 41.2 NS 38.6 42.1 44.6 47.7 53.3 < 0.001
Use of nutrition labeling 29.2 30.8 20.3 0.001 28.8 31.0 28.8 30.8 31.8 NS
Sodium intake ≤ 2,000 mg 24.9 24.5 26.0 NS 29.7 25.5 21.5 25.9 21.4 0.001
Fat consumption
1)21.9 22.1 20.8 NS 19.5 22.9 20.1 21.5 25.6 NS
Healthy eating practices
2)34.5 35.7 28.2 0.003 31.2 34.8 31.2 36.5 38.9 NS
NS, not significant.
1)
The criterion for fat consumption is that the contribution of the dietary intake to the total energy is 15–30% for subjects 19 years old and 15–20% for subjects
≥ 20 years;
2)The criteria for healthy eating practices is for individuals to meet ≥ 2 out of 4 healthy eating practices: (1) fruit and vegetable intake; (2) use of
nutrition labeling; (3) sodium intake; and (4) fat consumption.
Concentration curves and index of adult overweight/obesity
The RCCs of overweight/obese adults between urban and rural areas were in opposite directions (Fig. 1). The RCC of urban overweight/obese adults was above the line of equality, while the RCC of rural overweight/obese adults was below the line of equality. The Fig. 1 shows that poorer participants living in urban areas were more likely to bear the burden of adult overweight/
obesity, while richer participants living in rural areas were more likely to bear the burden of adult overweight/obesity. The RCI indicated nonsignificant economic inequalities of adult overweight/
obesity among all participants (P = 0.107) (Table 3). However, when we examined RCI by area, we found a negative RCI value (RCI = −0.041; 95% confidence interval [CI] = −0.078, −0.004) for urban areas (P < 0.05) but a positive RCI value (RCI = 0.084; 95% CI = 0.001, 0.168) for rural areas (P < 0.05). Additionally, the slope of the absolute concentration curves was steeper in rural areas than in urban areas (Fig. 2). The ACI showed significant economic inequalities of adult overweight/obesity in urban areas (ACI = −0.010; 95% CI = −0.019, −0.001; P < 0.05) and rural areas (ACI = 0.020; 95% CI = 0.000, 0.040; P < 0.05) (Table 4).
Cumulativ e pr oportion of o verweight/ obese ad ults
Cumulative % ranked by total household consumption per capita 0
0 20 40 60 80 100
20 40 60 100
80
Urban overweight/obese adults Equality
Rural overweight/obese adults
Fig. 1. Relative concentration curves of overweight/obese adults.
Table 3. RCI of nutrition inequalities (n = 6,126)
Variables Total Urban Rural Difference
RCI SE 95% CI RCI SE 95% CI RCI SE 95% CI
Overweight/obese adults −0.028 0.017 −0.615, 0.006 −0.041 * 0.019 −0.078, −0.004 0.084 * 0.041 0.001, 0.168 0.125 Fruit and vegetable intake ≥ 500 g 0.114 *** 0.018 0.079, 0.150 0.091 *** 0.020 0.052, 0.131 0.228 *** 0.049 0.128, 0.327 0.136 * Use of nutrition labeling 0.128 *** 0.020 0.089, 0.168 0.111 *** 0.021 0.070, 0.152 0.169 ** 0.059 0.049, 0.289 0.058 Sodium intake ≤ 2,000 mg −0.149 *** 0.024 −0.196, −0.102 −0.119 *** 0.026 −0.170, −0.683 −0.314 *** 0.055 −0.425, −0.202 −0.195 Fat consumption
1)0.079 *** 0.023 0.033, 0.124 0.085 ** 0.026 0.034, .0.135 0.037 0.052 −0.069, 0.143 −0.047 Healthy eating practices
2)0.105 *** 0.020 0.066, 1.440 0.101 *** 0.021 0.060, 0.142 0.092 0.052 −0.014, 0.199 −0.008 RCI, relative concentration index; CI, confidence interval.
1)
The criterion for fat consumption is that the contribution of the dietary intake to the total energy is 15–30% for subjects 19 years old and 15–20% for subjects
≥ 20 years;
2)The criteria for healthy eating practices is for individuals to meet ≥ 2 out of 4 healthy eating practices: (1) fruit and vegetable intake; (2) use of nutrition labeling; (3) sodium intake; and (4) fat consumption.
* P < 0.05; ** P < 0.01; *** P < 0.001.
Concentration index of fruit and vegetable intake
The RCI indicated significant economic inequalities of adults with fruit and vegetable intake
≥ 500 g among the total adult population (RCI = 0.114; 95% CI = 0.079, 0.150; P < 0.001) (Table 3). Both urban and rural areas showed significant economic inequalities of fruit and vegetable intake ≥ 500 g (P < 0.001). However, the degree of economic inequality in the RCI was higher in rural areas (RCI = 0.228; 95% CI = 0.128, 0.327; P < 0.001) than in urban areas (RCI = 0.091; 95% CI = 0.052, 0.131; P < 0.001). This showed that richer individuals met the recommendation of fruit and vegetable intake ≥ 500 g more than poorer individuals in both urban and rural areas.
Concentration index of nutrition labeling use
The RCI showed significant economic inequalities of nutrition labeling use among the total adult population (RCI = 0.128; 95% CI = 0.089, 0.168; P < 0.001) (Table 3). Richer adults used nutrition labeling more than poorer adults. The RCI of nutrition labeling use showed significant inequalities in both urban (RCI = 0.111; 95% CI = 0.070, 0.152; P < 0.001) and rural areas (RCI = 0.169; 95% CI = 0.049, 0.289; P < 0.01).
Table 4. ACI of nutrition inequalities (n = 6,126)
Variables Total Urban Rural Difference
ACI SE 95% CI ACI SE 95% CI ACI SE 95% CI
Overweight/obese adults −0.007 * 0.004 −0.015, 0.001 −0.010 * 0.004 −0.019, −0.001 0.020 * 0.010 0.000, 0.040 0.030 **
Fruit and vegetable intake ≥ 500 g 0.028 *** 0.004 0.019, 0.037 0.023 0.005 0.013, 0.032 0.055 0.012 0.031, 0.079 0.033 * Use of nutrition labeling 0.027 *** 0.004 0.019, 0.035 0.024 ** 0.004 0.015, 0.033 0.028 *** 0.010 0.008, 0.048 0.004 Sodium intake ≤ 2,000 mg −0.028 *** 0.004 −0.037, −0.019 −0.022 *** 0.005 −0.032, −0.013 −0.060 *** 0.010 −0.081, −0.039 −0.038 **
Fat consumption
1)0.013 ** 0.004 0.006, 0.021 0.015 ** 0.004 0.006, 0.023 0.006 0.009 −0.011, 0.024 −0.008 Healthy eating practices
2)0.024 *** 0.004 0.0149, 0.326 0.023 *** 0.005 0.014, 0.033 0.042 *** 0.004 0.034, 0.051 −0.004 ACI, absolute concentration index; CI, confidence interval.
1)